📉Gold 4H is preparing to rise above the 2000 level📈OANDA:XAUUSD
FOREXCOM:XAUUSD
Gold analytical series, Episode 05
Hello Traders, First take a look at my previous episodes.
Don't forget to risk-free your positions.
The First target, 1998.
Second target 2049
Please share ideas and leave a comment,
Let me know what's your idea.
CrazyS✌
Pitchforks

USDJPY Trend ContinuationMajor Trend is Bullish
4Hr made a higher high
4Hr reversed on Daily Resistance
4Hr broke thru 4Hr resistance
4Hr touched confluence zone drawn by a slopped wash line/wash line & Frequency line
4Hr Created a Bull Divergence along with a Bullish Hidden Divergence
To Buy I will wait for a retest on the confluence Zone or Fractal Candle on 4HR & WAIT for news event.
May the Profits be with you!

Dow shortTesting mobile app published idea. Short with a tight stop looking for continuation to the downside.

Beginning a new bull channelLooking for the formation of a new broad bull channel for the ES mini. This is what may happen...Stay tuned.

BTC/USDHere is a closer look at this chart.
BTC needs to turn the key Resistance area located around $32,157 - $28,682 into strong support.
That’s it, quick n dirty. I hope this chart is helpful.

NZDCADf you liked this idea or if you have your own opinion about it, write in the comments. I will be glad

AUDUSD Downtrend4HR Made a Lower Low & stopped on 4HR support
4HR created a Divergence in minor flow which might signal a pull back
4HR downtrend continues due to divergence on major flow and rejection on slopped wash line (in yellow) that happened last week.
To Short WAIT for pullback of price to pitchfork's upper Edge & retest Daily resistance (Note the frequency of the pitchfork Changed in dotted blue lines) a Hidden Bearish Divergence might be best in order to open a short trade
SL= upper lick of candles once reversal in minor flow is confirmed
TP1= 4H support
TP2= Daily support
May the profits be with you!

USDJPY Pullback4HR Made a Higher High
4HR broke thru Major sloped wash line (in Yellow)
4HR top candle tails rejecting from weekly resistance & Pitchfork edge
Major trend continues bullish to trade pullback wait for additional signals (inner candle+Fractal candle+Divergence) be conservative and trade short only for pull back
If Sell:
SL could be placed on top most whick of candlesticks
TP1 @ 30 Pips
TP2 @ 50 Pips
if Buy:
I will wait until price goes back to Daily Support & Pitchfork Center line to retest, wait for signs of reversal or 4HR continuation (Hidden Bullish Divergence or bullish reversal Divergence)
May the Profits be with you!


SPY can't break through resistance, will likely fallSPY, on weekly chart (and, to some extent, on daily chart as well) has been having difficulties crossing the marked upper pitchfork line which makes it likely that SPY will fall. The monthly/long term outlook remains bullish though.

BTCUSD BUYHello, how are you . O dealer. and speculators. There is a high probability of a bullish bitcoin. With a very positive candle formation on the daily chart. It means strong entry. for Tiran. With a very strong correction of 0.50% which is a very strong percentage. in the cursor.Note: If you like this analysis, please give your opinion on it. in the comments. I will be happy to share ideas. Like and click to get free content. Thank you

Fegtoken, Tecnicall analysis Based on Fibonacci and pitchfork and trend line break, probably, the fegtoken , will grow well.

ARB ABC?If you find this info inspiring/helpful, please consider a boost and follow! Any questions or comments, please leave a comment! Also, check out the links in my signature to get to know me better!
Decent case for an impulse up.
Move down could go a couple ways,
so waiting for a bit of clarity.
Some nice reactive levels to watch
in the meantime.
Cheers!

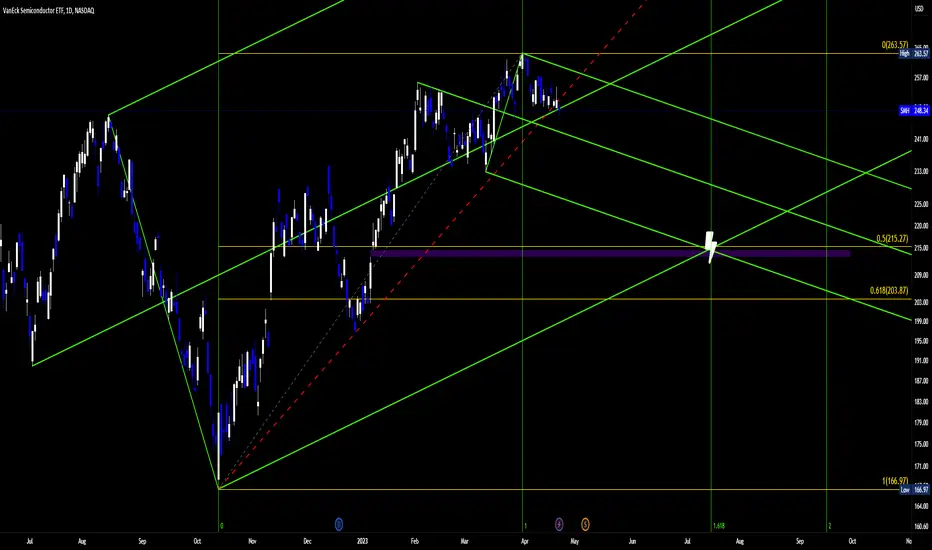
Short the ChipsNASDAQ:SMH
Short the Chips.
Why?
RSI Bearish Swing Rejection
MACD Bear Div
Price broke the ML
Unfilled Gap (212-215)
50% Fib Confluence with Price Gap
1.618 Time Zone
Fib Confluence X Price Gap X Energy Point
Target (Time x Price) = 215 USD on 7/17/23
Fat_Fat
Bull doge, or bear doge?If you find this info inspiring/helpful, please consider a boost and follow! Any questions or comments, please leave a comment!
Got some precise hits on levels identified!
Played the levels pretty nicely.
Will be looking to play off of them again.
Pierced a big level and bounced back up.
Good look for the bull doges, atm!
Cheers!

XRP just finished a 3?If you find this info inspiring/helpful, please consider a boost and follow! Any questions or comments, please leave a comment!
Got some grindage on the PF!
But could not get above and hold $.52.
Some confluence for a turn here!
I would like to see it touch the $.42 for a retest.
A break below, would watch for a flip.
Cheers!

SNXUSDTthis is where i think Forks meets NEoWAVE. price is forming last part of diametric puzzle as G and now its gonna to face 8$ soon .

VIX BUYVIX has formed a pivot on RED Shiff fork and theres a chance for a big move towrd blue fork for next 2 weeks.

Bank Rush moment meet it’s saturationDxy will try to retrace its range to general price range, so far the upbeat economic situation remains as long as some serious actions are taken by global players.
What's next?
As we know US is the most interfering country in the world, if any other trigger for chaos is welcomed by US then it looks like they will kill their own economy.

No clear trend other than upBitcoin CRYPTOCAP:BTC looks to have turned the corner, however there is no clear pattern other than an under-developed pitchfork. Likely at a near top for the short-term daily. Great deal of horizontal support and moving averages support at or above 20k. Should this bullish trend play out there is a high probably of testing 24k and moving upwards over the next several quarters into halving, interest rate cuts, and dollar TVC:DXY weakness

NVDA 65m ShortNASDAQ:NVDA
NVDA broke the neckline of this H&S.
Bearish Divergence on 30m RSI.
On a daily basis, the rally has retraced to the .702 fib.
I'm expecting that NVDA fills the gap at $211.
I'm hoping to get short when the market opens.
(Screenshots below)
Fat_Fat

SILVER FUTURES Daily Technical AnalysisSI1! Daily - No RECOMMENDATION or ADVICE Status / EDUCATIONAL only - Cup and Handle, Support, Resistance, Trend Lines, Cluster, Confluence, Parallel Channels, Rectangles, Pitchfork, Fibonacci Extension - Hope it Helps, Good Luck
DISCLAIMER - This communication is not trading or investment advice, recommendation or solicitation to buy, sell or hold any investment product is provided for informational, educational and research purposes only. All illustrations, forecasts or hypothetical data are for illustrative purposes only. The author or persons involved in the conception, production and distribution of this material cannot be held responsible for transactions or any financial loss or damages resulting directly or indirectly from the use or application of any concepts or information contained in or derived from this material. Past performance is not indicative of future results. Any person who chooses to use this information as a basis for their trading assumes all the liability and risk for themselves.

#NATURALGASNATURALGAS INVESTORS are buying the dip . i think the green PF will describe market movements for next 2 months
