WHEAT FUTURES Weekly Technical AnalysisZW1! Weekly - No RECOMMENDATION or ADVICE Status / EDUCATIONAL only - Support, Resistance, Trend Lines, Cluster, Confluence, Rectangles, Pitchfork, Modified Schiff Pitchfork, Fibonacci Extension - Hope it Helps, Good Luck
DISCLAIMER - This communication is not trading or investment advice, recommendation or solicitation to buy, sell or hold any investment product is provided for informational, educational and research purposes only. All illustrations, forecasts or hypothetical data are for illustrative purposes only. The author or persons involved in the conception, production and distribution of this material cannot be held responsible for transactions or any financial loss or damages resulting directly or indirectly from the use or application of any concepts or information contained in or derived from this material. Past performance is not indicative of future results. Any person who chooses to use this information as a basis for their trading assumes all the liability and risk for themselves.
Pitchforks

CORN FUTURES Weekly Technical AnalysisZC1! Weekly - No RECOMMENDATION or ADVICE Status / EDUCATIONAL only - Support, Resistance, Trend Lines, Cluster, Confluence, Pitchfork, Modified Schiff Pitchfork - Hope it Helps, Good Luck
DISCLAIMER - This communication is not trading or investment advice, recommendation or solicitation to buy, sell or hold any investment product is provided for informational, educational and research purposes only. All illustrations, forecasts or hypothetical data are for illustrative purposes only. The author or persons involved in the conception, production and distribution of this material cannot be held responsible for transactions or any financial loss or damages resulting directly or indirectly from the use or application of any concepts or information contained in or derived from this material. Past performance is not indicative of future results. Any person who chooses to use this information as a basis for their trading assumes all the liability and risk for themselves.

IWM: Russell 2000 ETF-Elliot Wave PathAMEX:IWM
IWM, The Russell 2000 in the middle of an ABC Zig-Zag Corrective Wave Sequence.
This Zig-Zag is retracing the upmove from the '03 low to '21 high.
As it stands now, the "A" wave has completed 5 waves down, and "B" wave flat looks to be complete.
This suggests that we are already in or about to enter the final 5 waves down for Wave "C".
Looking at a few other indicators, I'm expecting that this "C" Wave will extend 100% of the "A" wave's length.
This would take IWM to the 117 USD area.
On an Elliot-Basis, the correction should terminate somewhere within the larger degree Wave 4, and this 117 USD level is right in the middle of it.
The 117 USD level is also right in between the '18 and Covid lows, and is also in line with my non-EW Median Line target, and bear flag target. (screenshots below)
Short it.
Fat_Fat

S&P 500 Daily Technical AnalysisES Daily - No RECOMMENDATION or ADVICE Status / EDUCATIONAL only - Support, Resistance, Trend Lines , Parallel Channel, Cluster, Confluence, Pitchfork, Modified Schiff Pitchfork - Hope it Helps, Good Luck
DISCLAIMER - This communication is not trading or investment advice, recommendation or solicitation to buy, sell or hold any investment product is provided for informational, educational and research purposes only. All illustrations, forecasts or hypothetical data are for illustrative purposes only. The author or persons involved in the conception, production and distribution of this material cannot be held responsible for transactions or any financial loss or damages resulting directly or indirectly from the use or application of any concepts or information contained in or derived from this material. Past performance is not indicative of future results. Any person who chooses to use this information as a basis for their trading assumes all the liability and risk for themselves.

XRP broke fiftee!If you find this info inspiring/helpful, please consider a boost and follow! Any questions or comments, please leave a comment! Also, check out the links in my signature to get to know me better!
Could not hold the .50 level, atm.
Found some nice support on the Geo.
Need to regain that level and put the correctives back to pointing down instead of up!
Ideal path from here for the bulls on the chart.
Cheers!

Barrick Gold CO Long R/R ~ 1:5Analysis
Pitchfork. Priced is at the median. Targeting forks top
Fibs: extending range to 1.236
Target the confluence at $38.18

Major SupportAAVE holding a major support, fractal could be in play, this token could run to 100 usd, then i'll look into market conditions.
ML of the fork to be tested.

ABDUCTIVE LOGIC: This is a REVERSAL
If it looks like a duck,
If it walks like a duck...
Quacks like a duck...
Yes the macro is bearish
But macro is a product of smart money, just like the news
This chart is bullish
We have already rejected the 50% retrace and this was done with time and price squared as I've shown you previously
We are now testing the 0.382 fib support
But moreover, all of this PA has come at THE potential reversal zone which is centred upon the Andrews Fork off the last 3 pivots
No one thinks the bottom is in
That's why it's probably in
IDEA FOR ENTERTAINMENT ONLY
DYOR

S&P 500 Weekly Technical AnalysisES Weekly - No RECOMMENDATION or ADVICE Status / EDUCATIONAL only - Support, Resistance, Trend Lines , Parallel Channel, Cluster, Confluence, Fibonacci Retracement, Pitchfork, Modified Schiff Pitchfork - Hope it Helps, Good Luck
DISCLAIMER - This communication is not trading or investment advice, recommendation or solicitation to buy, sell or hold any investment product is provided for informational, educational and research purposes only. All illustrations, forecasts or hypothetical data are for illustrative purposes only. The author or persons involved in the conception, production and distribution of this material cannot be held responsible for transactions or any financial loss or damages resulting directly or indirectly from the use or application of any concepts or information contained in or derived from this material. Past performance is not indicative of future results. Any person who chooses to use this information as a basis for their trading assumes all the liability and risk for themselves.

XAUUSD Weekly Technical AnalysisXAUUSD Weekly - No RECOMMENDATION or ADVICE Status / EDUCATIONAL only - Support-Resistance Zones, Modified Schiff Pitchfork, Pitchfork, TrendLines - Hope it Helps, Good Luck
DISCLAIMER - This communication is not trading or investment advice, recommendation or solicitation to buy, sell or hold any investment product is provided for informational, educational and research purposes only. All illustrations, forecasts or hypothetical data are for illustrative purposes only. The author or persons involved in the conception, production and distribution of this material cannot be held responsible for transactions or any financial loss or damages resulting directly or indirectly from the use or application of any concepts or information contained in or derived from this material. Past performance is not indicative of future results. Any person who chooses to use this information as a basis for their trading assumes all the liability and risk for themselves.

$COIN pullback to $5X.XXWell's notice fiasco after a series of failed meeting with the SEC, bearish divergences all over crypto and heavy insider selling since Feb is a recipe for $COIN to pullback after a pump from $40 to $80. Even Cathy Wood has sold large positions in $COIN for the first time this year, which is no good news.

Wakey Wakey . . XRP Gart & FakeyHey crew, gonna drop this on ya. I probably shouldn't because "they" watch my sh!t close and I've had to figure out how to post price levels without actually posting my personal entry / exit points. I've literally had orders miss filling ROUTINELY by as little as .001 to .0001 which as you can imagine is enough to drive a person to drink lighter fluid laced egg nog even if it's NOT Christmas.
So here's the shakey shake . .
1. Remember, XRP always pumps before dumps.
2. Keep an eye on Bitty and especially the S&P 500, there's some pretty good parity there and insight into overall market directions. It's still pretty comical that crypto will trade in some degree of parity to broader markets BUT, that's "probably" intentional because if "regulators" can make the case that crypto trades to 70% or greater correlation to broader markets then they can further strengthen their claim that crypto should be classified and therefore REGULATED like securites. (FtheSECbtw, you guys are F%$@#rs)
3. Garts pretty much NEVER play nice with XRP so don't be alarmed if/when this one doesn't either. Maybe we'll get some 50/100 day ema fingerbang action in which case, I'd be TP scalping from those 0.37 buys if you got em.
I personally like XRP at lower levels, who doesn't? Even if you're a salty bull from > 1$ levels then you know it's just more opportunity to lower the cost basis, amirite? ;)
Hold the line and don't be afraid to hedge even at these levels. I still think we have a date with 10 cents.
Stay frosty and remember, * * * Not investment advice * * *
Box

XRP, way to be!If you find this info inspiring/helpful, please consider a boost and follow! Any questions or comments, please leave a comment! Also, check out the links in my signature to get to know me better!
XRP broke a major level, MO, but now the hard part... have to flip or hold above it.
This would be the ideal path based off of the swings. But, end of day, that $.42 level is the ideal level to hold and maybe play off of, NFA.
Cheers!

Bitcoin Safe Haven Bid for Real?INDEX:BTCUSD
If the safe haven bid is real, Bitcoin is looking at $83K + come October 2023.
Noted by Energy Point.
Also in line with 1.0 Fib-Extension. (Screenshot below)
Fat_Fat

Bitcoin Roadmap until FOMCBitcoin plan until FOMC
The pullback to ~$22.1k-$22.5k.
Hot CPI on Mar 14.
Dump to these supports: ~$20400, ~$19.7k, and the final and vital target for this leg down would be 0.618 Fib level (~$18.7k) until FOMC on Mar 23.
Fed will announce 0.5 bps rate hike, but this won't affect the market much because it will be priced in.
Then a new consolidation phase + uptrend will begin.
Please hit the boost button if you agree.
Thanks

$BTC $170K by Halloween 2023, believe it. If the same technicals of growth, volatility, and previous lows and highs math estimates are correct, then as strange as it may sound, Bitcoin is 23% likely to reach $170,000 by Oct 31st 2023.
Not to mention the fertile environment for Bitcoin given;
1. The recent turmoil in the regional banking world and the lack of trust of the banking system being reinforced.
2. The decline of BTC in 2022 was arguably related to the massive interest rate hikes by the Fed, and they (The FED) are now likely to stop raising rates due to #1.
3. The correlation btwn Gold and Bitcoin has re-emerged in recent weeks

Kiwi-Dollar ShortOANDA:NZDUSD
King Dollar seeks to claim another victim.
Supported by bear divergence on daily timeframe.
NZDUSD breaks & retests the median.
Next stop, lower parallel.
Fat_Fat

QQQ Pitchfork technicals at inflection pointThis pitchfork chart looks very clean to me with intersecting bullish and bearish potentials hitting an inflection point this week.


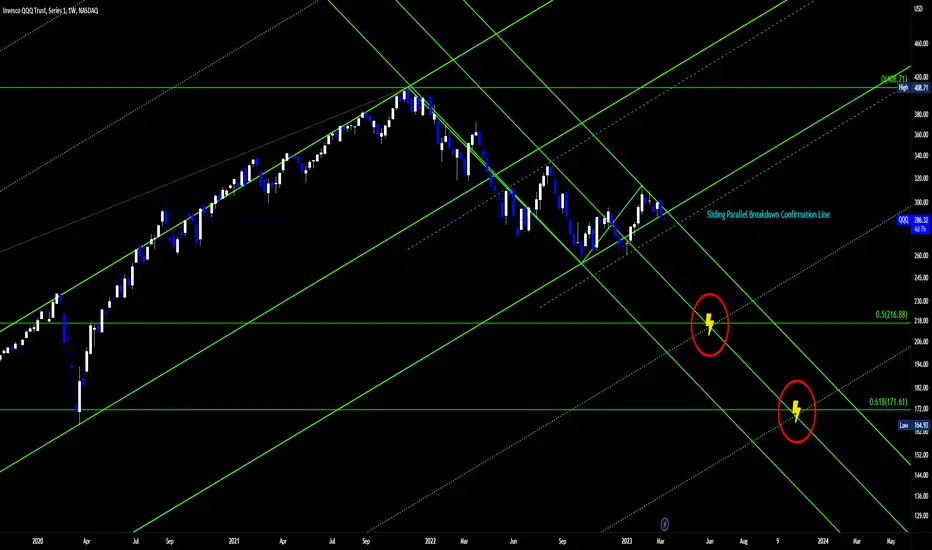
QQQ ATH-GFC Fib RetraceNASDAQ:QQQ
Here we go boiz, the moment we've all been waiting for.
QQQ to retrace the entire '09 GFC low to '21 ATHs. (Full Retrace Screenshot Below)
You could wait for Sliding Parallel Break for added confirmation if you are the cautious type.
Energy Points as shown on chart are targets.
yuh
Fat_Fat
MPS to visit 28 USD/shareAs money seems to trickle into crypto again, perhaps backed by fears caused by Silicon Valley Bank collapse, I am looking for a short-term upside potential and MPS presents such an opportunity:
In June of 2022 the MPS did return to the major support level of 4 USD (yellow line) and bounced
In July of 2022 it broke out of it's downward trend (red line) and begun drifting sideways
No sideway-movement may continue forever as it is storing up energy for a potentialy sharp release
There is no way to go down and thus I am expecting MPS to reach the median line of the pitchfork (approx. 28 USD)
At the moment of this analysis we are beginning to drift outside of the potential pitchfork and that will mess up the probability if it continues for a few more days, however I believe that a delay in price action is only caused by poor liquidity and difficulty to obtain the Mt Pelerin shares.

325 SPYAMEX:SPY
SPY has broke under the yellow trigger-line, from the previous confirmed Pitchfork.
I have been waiting for this confirmation before entering a new short position.
Plotting a new Fork from the most recent Hi-Lo-Hi pivots, we see that the upper parallel has been retested and has also held price. (Red Fork)
SPY has a 70-80% chance to reach the latest Median Line. (Red Fork)
I approximated a target on the Red ML using a trendline from previous low pivots.
Target = SPY 325.
Target Date = May 10th, 2023
Short SPY.
Fat_Fat

