USDJPY LongOANDA:USDJPY
Wait for a retest of the lower MLH & Long USDJPY
I'll update this idea when I make my move.
Target 147.8
Fat_Fat
Pitchforks

LONGIt seems that the recent drop may have been emotional, if the support is maintained, the probability of the upward trend is high

Ryder On The StormNYSE:R
Ryder is breaking down, looking to see it fall to the Energy Points noted on the chart.
Energy Point #1: April 18th @ $83.50
Energy Point #2: Mid-July to Early-August @ ~ $75
Fat_Fat

USD/CAD Scouting a Long EntryOANDA:USDCAD
USD/CAD putting in a double bottom off the Red Modified Schiff ML after breaking out above the Yellow Andrews ML.
Multiple MLs pointing to a run towards the upper parallel, @ approximately 1.4650 (screenshots below)
I am not long yet, but I plan on either longing a break above the previous peak at ~1.3705 or attempting to get a better entry if price returns back to the ML for another retest.
Stay tuned, will update when/if I make a move.
Fat_Fat

RVNUSDT DUMP, may be the last dump before flyblue fork is describing the price movement precisley and the red fork is a bearish fork which breaking its hagoppian line shows a sgnifacnt possibility for upward movement. RVN may create a big profit in 2023 ! BINANCE:RVNUSDT

MATICUSDT The first price target in case of an uptrend UpdateAs you can see, the price could not properly break the downward trend line and returned to the downward trend line again.
The pitchfork is drawn by the Auto Pitchfork indicator.
As long as the price cannot break its downward trend line correctly; The downward trend will remain.

MATICUSDT The first price target in case of an uptrendAs you can see, it is located at the lower edge of the fork, and if the downward trend line and the middle line of the fork are correctly broken, a buying position can be opened.
The specified price can be the first target of the upward movement.
Please pay attention to the word "correct failure".

$100+ CrudeNYMEX:CL1!
Crude to $100 - $105 area.
ML + TL + WL Energy Point in early May 2023.
Fat_Fat

ready to flyIt seems that the recent drop was a correction, if this idea goes well, the possibility of moving towards very high prices is high.

TIME vs PRICE is GEOMETRY... RISK ONGreetings Traders
Here we have the SPX chart with an Andrews Pitchfork off the three most recent monthly pivots, up to the ATH
We also have a fib retracement
I have scaled the chart
We can see price is currently consolidating after having completed a 50% retracement from the ath.
Time has been squared with price for the duration of the move.
We are currently finding support on the 0.382 retracement and attempting to break up from the Gann Fan
But moreover, there is huge support from the GEOMETRIC MEDIAN
I am personally long risk with a target of 5k spx
PLEASE NOTE THIS IDEA IS FOR EDUCATION ON THE PRINCIPLES OF MARKET GEOMETRY AND IS NOT A TRADE RECOMMENDATION

Potential Black swan would summon a dragon
BTC has been rejected at the apparent resistance of the 25200 zone.
Gann Square, as applied, also implies that the buy-side liquidity above is hard to reach.
Moreover, a harmonic black swan pattern (black) has formed, which would trigger another potential bearish harmonic pattern - a dragon (red).
The bearish dragon's target would be 0.618 (20104) -0.786 (19001).
However, given the Gann Square Arc's support, 0.618 or shallower is likely for the initial move.

Bearish dragon pattern unfolding
With a harmonic black swan's fluttering, BTC has broken the daily trendline (green) as the support, forming a red, bearish dragon pattern.
This price action is precisely what we predicted in our previous idea .
Please look at the related ideas for the further development expected to follow.


Update2: BTC Scalping short trading opportunity
This is the sequel to my previous idea .
The support line of the diagonal triangle has finally been broken.
The coordinate of point (A) was erroneous, so I corrected it.
TOTAL and Nen-star patterns formed.
Recommended TPs unchanged (see also gray-color zones of the Fibonacci extension.)
For details, please take a look at the related ideas below.


Update: BTC Scalping short trading opportunity
This is a sequel to my previous idea .
The diagonal triangle's unexpected, extended wave 5 (possibly an expanding diagonal) morphed the bearish white swan into a bearish anti-butterfly.
The basic strategy stays the same, but the basis for calculus would be slightly different.
Target is unchanged anyway.
If this breakout forms wave 5 of the impulse, a drop to the 22400 zone or below is likely, but some reversal is expected at FE 1.618 (23051), 2(22999), and 2.618 (22905), at each of which the price crosses a pitchfork's channel line.
This running flat scenario is invalidated above the high of A (23217), but another bearish scenario will likely develop under an expanded flat.

BTC Scalping short trading opportunity
We may witness a fractal move of the daily chart as wave 4 of a potential bearish impulse.
A bearish expanded flat (possibly a running flat) is expected with a bearish White Swan harmonic pattern.
SL above 23300. Recommended 23350 (see the trendline right up).
TP 22400-22700.
I also predicted wave 2 would be an Elliott flat, which revealed it was not (it seems to have been a zigzag).

Pitchfork has been applied to the current price movement of BTCThis Pitchfork's performance in response to BTC's recent price movement suggests that it is a valuable tool for traders and investors. By providing reliable predictions of potential support and resistance levels, Pitchfork can help users make better-informed decisions about when to enter or exit the market, ultimately improving their chances of success.
Disclosure:
It is important to note that the analysis presented here is for informational purposes only and should not be construed as financial advice. The cryptocurrency market is highly volatile and unpredictable, and any investment decisions should be made after conducting thorough research and consulting with a financial advisor.

Potential expanded flat as wave 2?
If the struggling BTC holds on to the support and shows its final flutter, it may form an expanding, possibly running flat as wave 2 of a progressive downward wave.
Such a movement may form a Deep Crab harmonic pattern.
Just an idea and could be easily invalidated, but if BTC had formed a larger expanded flat on a higher level, it wouldn't be so surprising that it shows a fractal move.

The S&P500 get's a fork in the middle of the roadAndrew Pitchfork on FX:SPX500
Andrew's Pitchfork, also known as the median line tool, is a technical analysis tool used by traders to identify potential levels of support and resistance for an asset's price. It consists of three parallel lines that are drawn based on three consecutive points in the price chart, usually a high, low, and another high (or vice versa).
The first line, called the median line, is drawn from the high or low point to the midpoint of the other two points. The second and third lines are drawn parallel to the median line, passing through the other two points. The second line is drawn at the high or low of the price chart, while the third line is drawn at the opposite side of the median line, touching the price at an important level of support or resistance.
The pitchfork is used to determine potential areas of price movement, based on the assumption that the asset's price will tend to trade within the channel created by the three parallel lines. If the price breaks above or below the channel, it may indicate a potential trend reversal or a breakout in the price direction.
I use Andrew's Pitchfork in conjunction with other technical analysis tools to identify potential trading opportunities and manage my risk by placing stop loss orders and taking profits at predetermined levels. However, like any technical analysis tool, it should not be used in isolation and should always be used in conjunction with sound fundamental analysis and risk management strategies.

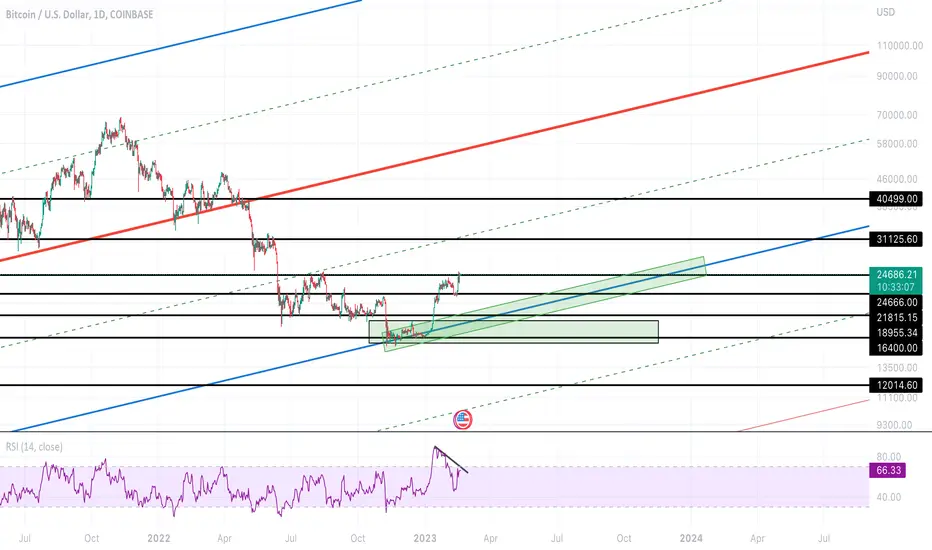
BTC/USD 1DSupports and Resistances are as shown.
Seems like Rsi Divergence to happen in daily graphic. So maybe we can expect a correction. But in weekly graphic price has more battery to go.
Green boxes would be the buyers zone.
Would use the pitchfork lines as "take profit" zones

AUDUSD short First time using Pitchfork indicators.
We are getting closer to s/r level. Price has reached 1.382 fibo level and now reversing back as correction to finally reach 1.618 fibo level.
I have pointed in a circle level where I have 4 conformations to enter:
1. s/r level
2. two pitchforks (50 and 30) crosses
3. 0.768 fibo level that was build on bearish impulse move
4. 1.618 level of a bullish impulse move (darker fibo).
It's experimental trade. Let see how it'll work.
Good luck:)
