below the median lineIf the price stays below the median line, there is a high probability of falling
Pitchforks

SPY - 130m - Dump back to the October LowsAMEX:SPY
130m Chart
Bear Div + Forks.
SPY projected to reach the October lows by early January.
Fat_Fat

Bitcoin 6h ShortBINANCE:BTCUSDT
BTC 6H Short.
Red Mod Schiff 4.236 Fib Extension x Green Mod Schiff Median Line
Target: ~ $15.9K
Fat_Fat

📉✌XAUUSD 2H Long Position✌📈BINANCE:BTCUSDT
COINBASE:BTCUSD
💥Pitchfork Setup💥
If the price stays between the yellow boxes, a long position has a good chance of winning. (Enter in several steps)
Don't forget to risk-free your positions.
Optimal stop-loss is on the chart.
Please share ideas and leave a comment,
Let me know what's your idea.
CrazyS✌

AUDCHF LongAs long as the Price concentration is on the middle of pitchfork, it's good to buy at the bottom and sell at the top.

SP500 shortt IDEAI think spl2 line is strong resistence and ES go down 3-5%. The Standard and Poor's 500, or simply the S&P 500, is a stock market index tracking the stock performance of 500 large companies listed on stock exchanges in the United States. It is one of the most commonly followed equity indices

Bitcoin impulse down, but then?PA rising and Volume falling, not usually the best mix for a bull run.
Elliott Wave count up is debatable.
My focus and I think most will accept a probable impulse down.
SO some levels of potential clarity I'm watching.
16.8k area, impulse complete
17165, resist and algo land.
17421, Impulse complete/inval
I think until one of these breaks, could go either way. Idealized patterns shown for whats next.
GLTA!
If you have found this inspiring/helpful, please consider a boost and follow! Any questions or comments, please leave on comment! Also, check out the links in my signature to get to know me better! Cheers!

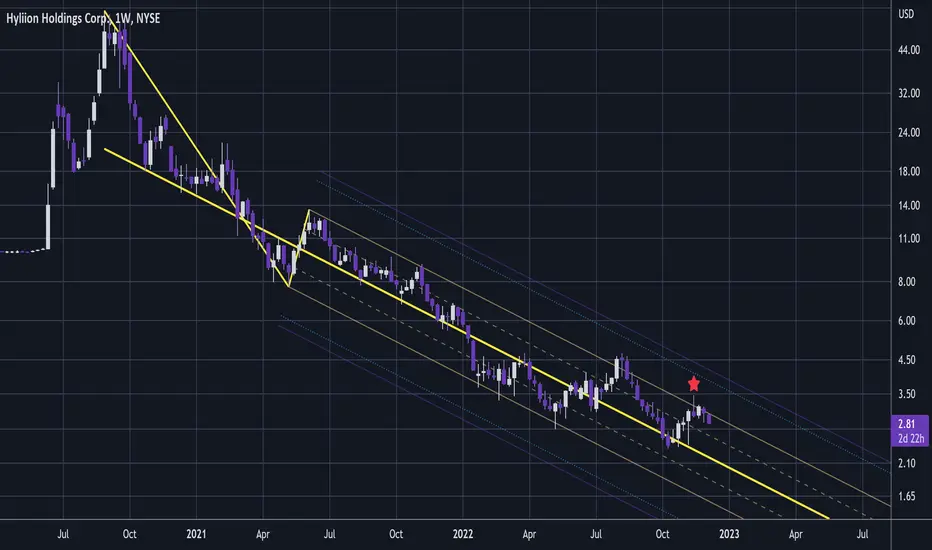
HYLN - Pitchfork Elevator Ride 🙀😾It got a bit exciting in EV for a minute or two and HYLN had a flurry upward, but just to show you in terms of trend really nothing has happened and that shooting star through the green upper median line is bearish, shows another leg down coming.
Who know where the bottom is really, I have fib targets but just like train stops the train can just keep on going and TSLA is looking bearish which is not good for small fry like HYLN.
Will be looking to buy HYLN one day but not today.
Not advice.
There's an old saying Tennessee...AMEX:XLE
Fool me once.... Shame on, Shame on you.
Fool me twice... ummm, uhhhh, you can't get fooled again. - W
Short XLE
Bear Divergence, Divergence against Crude.
XLE Targets:
Target 1 = $59 ~50% Fib Energy Point.
Target 2 = $50.50 ~61.8% Fib Energy Point.
Fat_Fat

Diamond top patternContinuation sell
Look to ride the wave down
Diamond top pattern
Short until 1.39
Green line last TP


US10Y Bounce at 3.332% then to 5.376 by Summer 2023The current pitchfork trend is holding and I'm looking at the US10Y reverse at 3.332% this month. I'm also expecting the fed to over tighten or some other news event to drive the US10Y to 5.376% by June 2023. The nature of pitchforks are able to easily visualize the physics of the market and I'll do my best below to explain what I'm seeing.
From a price action perspective the US10Y broke the median from the beginning of time and is coming back to re-test it as support.
As of August 2011 gap down to Jan 2014 price action has respected that median range through today.
In the world of physics, when you have a huge swing away from the median, you'll also have the same energy swinging back in the other direction. Think of a swinging palm tree in the wind.
The same is happening here and is illustrated by capturing the breakdown in Feb 2020 where price quickly broke trend then held the 3 standard deviant move down during the 2020 crash. US10Y has quickly made a move in the other direction and is preparing to breakout with huge force.

Shiba Shiba LongBINANCE:SHIBUSDT
Long Shiba as long as it stays within the sky blue fork.
Targets along the way are noted by the 0.618, 1.0, and 1.272 fib extension levels.

the lowest level of the 2nd wavecrab harmonic pattern:
X=$34.5
A=$0.0053
AB=0.61 XA
BC=0.38 AB
0.78 BC=$0.78
0.88 BC=$0.96
1.6 BC=$4.43
0.78 XA=$5.28
2 BC=$9.85
0.88 XA=$12.7
2.24 BC=$16.27
2.6 BC=$35.84
1.13 XA=$108
3.6 BC=$290
1.27 XA=$375
4.23 BC=$1053
1.41 XA=$1260
1.6 XA=$7815

📉✌XAUUSD 1H Short Position✌📈FOREXCOM:XAUUSD
OANDA:XAUUSD
Hello Traders, First take a look at my previous ideas on XAUUSD
💥Pitchfork Setup💥ThreedrivesPattern💥
If the price stays in the yellow box, a short position has a good chance of winning. (You can enter in several steps)
The optimal entry point for a short position is mentioned in the chart.
Don't forget to risk-free your positions.
Optimal stop-loss is on the chart.
Please share ideas and leave a comment,
Let me know what's your idea.
CrazyS✌


Is USDJPY forming an Elliott impulse?: Back to 141.2 then 135
If the chart is forming an Elliot impulse wave, and the sharp drop last week was the third wave of it, we will see the fourth wave correction and arrive at the short-term target of 135.0.
As detailed in the related idea linked below, I would see an elongated range formation, and it could take years for the yen to recover its original level.
Pitchfork. the arks, and the fans are additional TA elements in this analysis, so if you hate them, especially Gann Square, ignore them. Or skip this idea. Offensive comments aren't welcome (and will be reported)

SMVARDHNA MOTHERSON has a target of 136stock is heading up to 136 level, which is the confluence of UM of white PF, central median of yellow channel and 61.8% fib.retracement


BTC Elliott Wave Clue huntLooks like BTC has bounced out of the GZ and looks good for an Impulse up and 3 wave correction down. So is it a potential C wave or a Wave 3? If this is more than just a pump and dump, I will be looking for how price reacts to the Fibs and geometry here. The more dilly there is, the more I lean on it being a potential Wave 3 of an impulse. If you have found this inspiring/helpful, please consider a boost and follow! Also, check out the links in my signature to get to know me better! Cheers!

possibility of fallingI think that if the support is maintained, there is a high probability of falling

📉✌XAUUSD 1H Long Position✌📈FOREXCOM:XAUUSD
OANDA:XAUUSD
Hello Traders, First take a look at my previous idea on XAUUSD
💥Pitchfork Setup💥
If the price stays in the yellow box, a long position has a good chance of winning. (Enter in several steps)
The optimal entry point for a long position is mentioned in the chart.
Don't forget to risk-free your positions.
Optimal stop-loss is on the chart.
Please share ideas and leave a comment,
Let me know what's your idea.
CrazyS✌

📉✌XAUUSD 1H Short & Long Position✌📈FOREXCOM:XAUUSD \
OANDA:XAUUSD
Hello Traders, First take a look at my previous ideas.
💥Pitchfork Setup💥
If the price stays in the yellow box, a sell position has a good chance of winning.
The optimal entry point for a short & long position are mentioned in the chart.
Don't forget to risk-free your positions.
Optimal stop-loss is on the chart.
Please share ideas and leave a comment,
Let me know what's your idea.
CrazyS✌
