Light Crude to 54.09 by Jan 13th 2023Light Crude has lost a significant level at 78.16 and is reverting to the mean at 54.09 as demonstrated by my pitchfork trends and sigma measurments.
Pitchfork Price Action Analysis
Light Crude has broke out of the recent uptrend (with red median) and broke away from the (red) mean on Jun 14th 2022 (priced at 123.68).
Since then it has started to follow the down trend median with an attempt to break out on Nov 7 2022 (priced at 93.74)but failed to do so.
Price is looking for buyers at the 68.15 and if it fails to find them then this trend will revert to the median trend that broke out in Dec 22, 2021. That will take Light Crude to 54.09 by Jan 13th, 2023.
Flash Crash
Should we continue the trend down I can actually see a flash crash to 40.63 by Feb 28th 2023. This will be the full sigma move and will be an area where I'll look to buy into a reversal.
Pitchforks

VIX setting up for a Santa Rally?I've spent a lot of time drawing on the VIX chart today since we are coming up on an area that defines 3 separate ascending wedge patterns with one starting before the 2020 run that we have tapped twice without making a lower low. And although that lower trendline is still quite a way down, currently at 16.57, it's not a far stretch if retail sales come out strong, JP keeps quiet, and there are plans for a Santa rally lurking behind the scenes. With that being said, we have just broken the next oldest pattern, and the youngest one not much farther down at 19.66 and the .86 fib of the 2020 run up is smack in the middle at 20.13 so for tomorrow, I have potential reversal area from 20.44 to 20.13 with 20.13 to 19.71 becoming bearish down to below 19. My argument for the upside is a bit more hocus pocus as I had to put on a pitchfork to even feel good about it, but we made the inside candle Friday, which, big deal, it was a half day, but following that with an outside candle on a retail rich week wouldn't shock me at all. So I'm gonna throw my dart. If we gap up, we hit around 21.30 and come back down to close between 19.89 and 20.13 in which case the case for breaking down past 19.66 becomes more likely. SANTA RALLY!!! But, if we gap down into that bounce zone and don't break the 20.13, then we still close high and and head back to Wednesdays high. I like this case more if we bounce off the Daily low and just double bottom. BUT, I'm still leaning to a high of 22.30 on the WEEK, just because I feel like the case is better stated for a downside overall. We just have much more reason to pull back down with the biggest reason being that we haven't retested that 2020 pattern for over a year. Historically I don't see any rhyme or reason except that VIX does tend to rise during December if only for a day, and even that isn't well structured. Sooo... who the knows then the VIX is gonna VIX. What we do know is that we have spent so much time in what used to be high volatilely territory that we've started to make a home here and that contradicts what the VIX is designed to do. We've held above averages, between $10-20, for more days and gone higher than we did in the '08 housing crisis, and all while our economy is too strong for its own good. So we've either become fairly melodramatic, OR we're setting up residence. If the latter is true then we can just throw out all historical data that predates circa 2018 and start anew. I personally want to see what happens if we break down below 16.50. Do we stabilize and go back to a boring trend style value market? Or does everyone freak out and rabidly buy everything in sight. All we can do is wait, and look to the right.

Darvas Break-Out: Deceptive SwingsThis High on LTC is difficult to assess. Attempting to validate a Low for a Box with a tool, is necessary; a MacD of the Accumulation/Distribution aided the discovery of a Low. Obviously, the Price Action swung the levels around the new Box.

XRP Got checked out of the LibraryOK crew, if you've been following my previous XRP "Stick a fork in it" idea, we made some pretty solid moves that really focused on ;
A. Scalps and light profit taking
B. Wealth preservation and keeping the portfolio in steady growth
C. General price directions on the daily, which we nailed gloriously
So moving to the new idea here (bonus if you got the library reference)
1. SEC vs. LBRY - Bad news, Google it but long short is that (at the very least) it has an impact on the crypto market at large and especially in the minds of XRP fam.
2. Check out the Core Scientific meltdown and it's effect on BTC hashrate. I've been warning everybody.
3. Clearly somebody knew something which led to the pump starting on the 16th of September. These guys always know and play the inside but I'm sure the SEC is totally going to go after them, lol. After 4 solid days of red candle action, we crescendoed beautifully with a net beatdown drop of just under 35%. Pretty sweet and all in hours of trading.
4. Blood moons - The guys that move markets are total occultists. Look at the way Doge moved running into the culmination of Halloween. Last night's blood moon eclipse and the resulting sell-off is just their way of letting us know who they are and what they're into.
5. On the purely technical side, we're well below our key MA's and with the John Wick candle staring us in the face, that wick is sure to engulf at some point which means lower level buying ops and shorts for those willing to risk handling XRP the wrong way. She can be a cruel mistress and you don't want to pi$$ her off.
6. Look at previous potential Golden Crossings and see how many reversed and never happened on the EMA's for XRP.
7. The Harmonic totally paid out on the short side but we got pretty good results with longing back in at the bottom of the longer term Fib channel / uptrend. Keep an eye on the down fork still in play although I'm still a fan of the engulfment theory.
I probably missed a bunch of other stuff but this should do it. We're basically looking to add more on lower buy levels while minimizing and downside to the portfolio here.
Good luck my friends!
* * * Not investment advice * * *

XAU/USD Short/Long - 5/15m - NY/Asian - Nov 24/25 20222 trades taken, first short and last long. The short in the middle was another opportunity that I was looking to take but did not.
Long term PF slope is clearly being respected and validated so we followed accordingly. First trade was entered after price failed to touch the major ceiling and broke below a significant bullish candle that foreshadows a break of the parallel floor. Smaller SL was used as this is an impulse entry.
Second trade is when price started retracing after the break of the parallel floor. at that point, we would expect the broken floor to become a ceiling for price to retest if we have a significant retracement such as this. This trade was not taken but the idea is to enter impulsively after the break of the doji 1H candle which signals the leg down to the major floor.
Third trade is the same as the second but the other way around, a long after the bullish break and retest of the parallel ceiling turned to floor. Entered on break of 15m candle after a short retracement to retest the floor with a larger SL. No partials were taken throughout both trades and 10% runners were left at 1:2 TP with SL moved to BE.

LTC Invalidate and see, Elliott wave. Here is just one of my bearish interpretation. Most would still point down. IF the price crosses $92, I would say the proposed impulse down would be invalidated. I wouldn't be sold on ATH coming soon just yet, though. I think that there is a possibility that this is just a W4 until that line is crossed. Furthermore, I am still looking at longs as well, a bearish chart does not make me a bear. If this move is a motive off of the low, Ideally holding $73 would keep this a W4 on the 1hr. 64.90 is where the impulse up invalidates. If you have found this inspiring/helpful, please consider a boost and follow! Also, check out the links in my signature to get to know me better! Cheers!

uni 3s up, 5s downStill looking for this asset to go lower. BUT first want to see a move away from the current price to keep the impulse on the lower degree valid. If it does invalidate the impulse down, would be looking for some sideways style correction. Only reached a bit past the .80 of the proposed wave A. but would still keep a flat as a possibility. If you have found this inspiring/helpful please consider a boost and follow! Also check out the links in my signature to get to know me better! Cheers!


USDJPY PitchforkI entered a long on the 17th and it seems to be working in my favor. I marked the next resistance level I'm watching to add to the position or take profit.

📉✌XAUUSD 1H Long position✌📈FOREXCOM:XAUUSD
OANDA:XAUUSD
💥Pitchfork Setup💥
Hello Traders, First take a look at my previous ideas.
XAUUSD 1H Setup
The optimal entry point for a long position is from now until the price is in the yellow box.
Please share ideas and leave a comment,
let me know what's your idea.
CrazyS✌

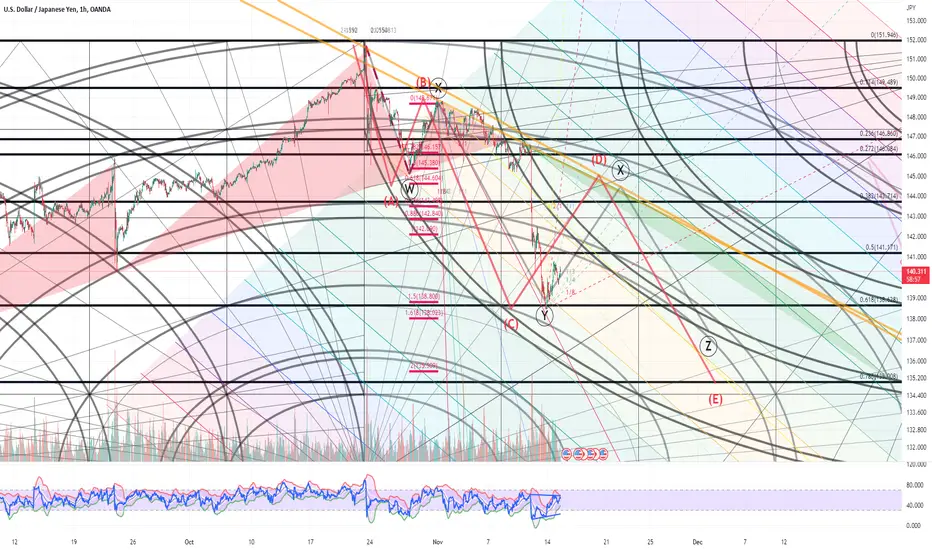
Bearish Speculation: Short from here, or from 17600?
I have presented some ideas where this downtrend is interpreted as Elliott's triple zigzag (WXYXZ) (see also links below).
So let's continue the speculation.
If the Z wave of it is now developing, it would have, by definition, a three-wave zigzag structure (WXY as presented, but ABC also possible) comprising 3-3-3 waves.
No wonder this chart begins to decline from here onward, but if BTC shows at least some strength the next week, an ideal double top setup will be complete (bullish scenario excluded from consideration here).
For H & S's right shoulder (or a symmetrical triangle), if FE 1.786-2.000 is the target zone (FVG agrees with it), and if we confirm a smaller double top at around 17600, it would be another ideal setup for the bearish progressive wave (here an impulse, 12345).
This scenario is nothing more than a speculation, but it is theoretically clean and would support my WXYXZ hypothesis.
I have not mentioned Gann Square, but its presence would be self-explanatory (if you hate it, please ignore it. This idea isn't affected by removing it).
Pitchfork is also for reference (based on the hypothetical downward impulse).
Just so you know, I premised the Z wave as WXY, not ABC- because this could, in my opinion, develop into WXYXZ where the actual bottom is below 12500 (possibly 9500-7500?).

ADA/USD - still in its Falling Wedge PatternHere is a closer look at this ADA/USD 1d chart.
Just like BTC, ADA is still in its massive Falling Wedge Pattern.
Here is a closer look at the Average Directional Index (ADX DI).
Once this world wide Recession has fully bottomed, for those that are prepared, there will be truly amazing opportunities to acquire your crypto of choice at a real bargain price ready to ride the next cycle upwards.

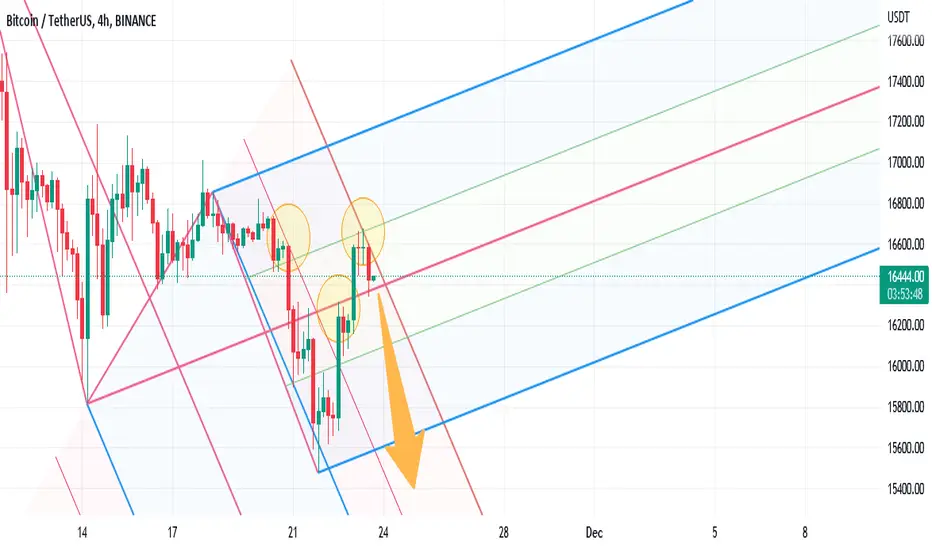
Will Bitcoin move in this pitchfork channel?The pitchfork channel in the above chart is a hypothesis. But the points that have reacted to it reinforce the possibility that Bitcoin will move in it. Bitcoin has already reacted at two top and two bottom points.

XAU/USD Short - 5/15m - NY Open - Nov 18 2022With the long term PF showing a clear bearish bias, we used the short term purple PF for a short entry. After testing a significant ceiling on 4H PF and we broke the floor on the 15m PF , an impulse short was taken with a stop above previous high/ceiling. TP was set at the floor support of both 4H/15m PFs which makes an area of great confluence.
Trade was 1:2, no partials. Fairly quick trade as it only took 20 or so minutes. We closed our position just under TP at 1:1.5 to ensure profit was taken before any big retracement since this is a strong support. Could of let it run to TP to get the full profit and could have also left a small runner with SL at BE so execution needs improvement.

XAU/USD Short - 5/15m - Post NY Open - Nov 17 2022From the 2 long term 4H PFs (one bullish, one bearish), we see that price has broken 2 floors over the London session and retested both of them (first green circle) which is an indication that the market bias is bearish. The next floor is not for some time so we were looking for a retracement to enter short.
The short term purple PF provides us with more details on potential short entries on lower timeframes since the path is not clearly defined with the long term PFs alone. The purple PF shows a clear channel between the two 0.5 parallels. Price did a fake out on the major floor and pushed up without a retest so the idea was to wait for price to hit a significant ceiling before dropping again to retest the floor.
Trade was a 1:2, taking 50% around 1:1 (SL to BE). Good execution, entered on a retest after a fake out on the significant short term PF ceiling. Price fell right back down after testing that parallel where we set our TP. SL was above the previous high.

BITCOIN AT THE BOTTOM OF PITCHFORK WITH WEEKLY DIVERGENCEA lot of negative sentiment on the market right now, and with everyone expecting BTC to drop to 12.000-10.000 area, there is a high probability that BTC creates even temporary bottom. Fear index currently at 23 (extreme fear).
Also BTC is near the cost of production, and historically BTC always bottomed above the value of production.
As you can see BTC price respected this pitchfork throughout the whole bull run. That doesn't mean it would be saved by 2X extension. It could still pierce trough the support, create the capitulation bottom, and then slowly bottom out here.
Nice area to dollar cost average, and to start buying.

XAU/USD Short - 5/15m - NY Open - Nov 16 2022long term PF on 4H shows us the slope is still valid as price keeps respecting the ceiling and floor. Once price hit the ceiling, it started making its way down to the most recent floor (bottom of red parallel channel). We waited for the first dotted parallel to be broken as that one is clearly being respected (same move down as Nov 15 Asian session).
1:1 was the aim but execution was poor. Retail sales data came out positive for USD at 8:30am and we know that 9:30am will have another reaction to this high impact news. Hence at 9:30, price pushed up to our dotted parallel then fell down to our most recent floor which is our TP. Trade was a sell stop after the break of the 5m candle (9:35am)
Trade taken on 5m due to high volatility but Tradingview does not allow for 5m chart publishing.

PTRA - Pitchfork Breakout! 😲These EV's have been getting smashed up so bad but it may finally be time to consider an entry.
I've been tracking quite a few of these for some time and they've been long locked in these pitchfork channels.
This week PTRA will print a whole candle body outside of the pitchfork channel and that is worth noting.
Also worth noting is that most other EV's are still locked in their pitchfork although some of them have had some impulsive days.
But anyhow I won't be buying up here...
I will wait for a pull back and look for good technicals to get in 👍🏻.
TLDR: I am not getting long here I am waiting for a pull back.
Not advice.

TEAMLEASE is a wonderful BUY idea!Stock is at the D point of Alt. AB=CD pattern, which is also the 78.6% fib.level S2 Pivot point and warning line of yellow pitchfork.
wonderful buy....


XRP Weekly LevelsI always find it interesting how technicals line up to fundamentals. A lot of online opinions say the SEC v Ripple case is coming to a close and that the ruling may be in favor of Ripple. If that is the case it would be breaking above the levels marked. We may see some resistance at 0.60125 before breaking higher. I plan to put a market pending Long at 0.783 and let it ride with a SL at 0.60125.
Interesting to see how nicely the Schiff Pitchfork lines up as well.

Corrective wave scenario
This is supplementary/alternative to my previous idea.
Examining the internal waves of my presupposed "impulse," I realized some counts might mismatch Elliott's Law.
Instead, this move may form a corrective wave, e.g., complex correction (WXYXZ, Gray) or Diagonal Triangle (ABCDE, red; could be longer if with a thrust).
The chart would be self-explanatory, but the Triangle annotation is shifted for visibility.
In either scenario, the retracement in the fourth (corrective) wave is deeper than that of the impulse.