ShortI think this fork is still valid, although the price may still deviate, but according to the reaction to the opposite fork, there is a high probability of falling.
Pitchforks

go with the FLOWcummon bby
feel the alt szn
*judge judy meme*
You pee on my leg and tell me it's raining
GRI 2022
Geometric Charting, fibs, log

Doge, Tesla and the Median line The Median Line worked pretty well taking the top both in Dogecoin and in Tesla. This chart update this study:
Dogecoin is testing the Center Line level right now and that resistance need to be cleared for a move higher.

Hidden Fork from 1972!Modified Pitchfork locations adjusted and BOOM! Perfect match for trade. Follow the lines!
Yellow lines are CC levels 0.618 and 0.66

DXY updateThe Median Line per I.II.III: DXY back to test the Center Line =dynamic support zone now. The strong trend looks intact. This is a good way to use the Median Line to track the trend consistency.
Update of:

CENTER LINE : 2 bearish scenarios Both in in BTC and SPY charts we have Median Lines that worth a check:
In BTC prices are now under the 50% upside parallel Median Line and the current move could be a pullback of that level, in that case prices could be headed much lower , the Center Line is under 10K right now.
in SPY prices are above the 50% upside parallel but a move back under the 1/2 of the body of the last green candle ( ~373 ) should be seen as an alert to check in case of more downside there to come.
Knowing these patterns may help you have a geometrical map of where price are moving and where could be directed in the future.
No position just sharing the patterns.

USDCHF ShortSome would look at this and say "Head and Shoulders". I think it lost momentum moving to the upper level and will move down to the zone below. At that point I'll reevaluate.

ShortIt seems that this fork is still valid, if the support is maintained, the probability of falling is high

EURUSD LevelsI added historical levels and zones to the EURUSD charts. We are approaching some important levels that it will likely test.
I also added additional deviations off the median line.
Personally I think it's pretty fascinating how closely the price action matches these deviations.


ShortIt seems that the price has reacted well to the forks, if the support is maintained, the possibility of a fall is high


📈✌EURUSD 1H long position✌📉FX:EURUSD
FOREXCOM:EURUSD
💥If the price trend does not break the bottom of the yellow zone, a long position can have a good chance of winning.
Just don't forget to risk-free your position when it reached the TP1 - TP2
TP1-2-3-4-5-6 are on the chart
The optimum stop-loss is on the chart.
Please share ideas and leave a comment,
let me know what you think.
CrazyS✌

GBPUSD Pitchfork formingI think there's a short run pitchfork forming. I am going to open a position with the SL at 1.2739 and watch over the next week to see if I want to move it up and let it ride.

Uranium ETF Wave ForecastAMEX:URA
URA, the Global X Uranium ETF has completed the first wave of an impulse move, and is in the process of completing a Wave 2 correction.
Wave 2 appears to be a complex correction consisting of two corrective patterns. (Zig-Zag + Triangle)
The triangle is still in the process of completing it's structure.
(I also want to note the possibility that wave 2 has already completed a flat correction and that the triangle shown in this chart could be wave 1 & 2 of the 3rd wave of larger degree.)
Either way, price should begin rising sharply within the next month or two as it completes the triangle correction and begins Wave 3.
Or in the case that Wave 2 is a flat, Wave 3 of 3 could already be on it's way.
I've used a Modified Schiff Pitchfork to form a channel for the rest of this impulse move.
I've kept these projections pretty conservative, the actual move could be much larger.
Wave 3 is a 1.618 extension of Wave 1, and Wave 5 is only slightly larger than Wave 1.
(Wave 5 = .786 of Wave 3, compared to Wave1 being .618 of Wave 3)
Being that Wave 2 is a complex corrective pattern (zig-zag + triangle), I've projected Wave 4 as a flat correction.
(If Wave 3 begins very soon, it would be likely that Wave 2 was actually a flat. If this is the case, expect Wave 4 to be a Zig-Zag)
Disregarding any wave structure, price has formed a giant bull flag.
I'm going to be purchasing some long-dated call options on URA once price breaks out of this bull flag and begins Wave 3.
My conservative targets are Wave 3 = $60 and Wave 5 = $77
Fat_Fat

MOTHERSON is at excellent support!Stock is at the confluence of strong S<>R and the central median of two pitchforks!.Good level to accumulate the stock


EURUSD ReviewJust revisiting some old charts I set up before I had to take a sabbatical. The Pitchfork on EURUSD has held up nicely so far. A possible rejection off the centerline before heading back down.

finally the attractive 3rd wave?crab harmonic pattern:
X=$0.276
AB=0.61 XA
BC=0.38 AB
1.6 BC=$0.047
0.78 XA=$0.056
2 BC=$0.093
0.88 XA=$0.118
2.24 BC=$0.142
2.6 BC=$0.277
1.13 XA=$0.729
3.6 BC=$1.61
1.27 XA=$2.1
4.23 BC=$4.79
1.41 XA=$5.89
1.6 XA=$27.85

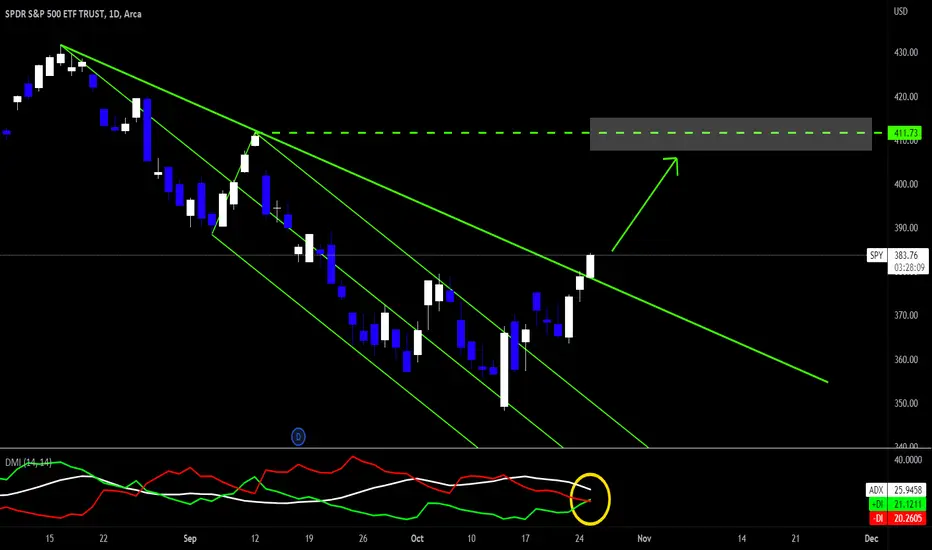
SPY Rally to "C" Pivot LevelAMEX:SPY
SPY broke the fork and the trigger-line.
DMI crossing bullish
C Pivot next.
Target = $412
Fat_Fat
BAJFINANCE is at good support!stock is in W3..........
consolidating on top of the UM of pitchfork....
feel its a good price to buy............
if it trips and closes inside the pitchfork, I am wrong!

📉✌BTC 30Min Position✌📈BINANCE:BTCUSDT
COINBASE:BTCUSD
Hi traders, first look at my previous analysis.
A quick long position can have a good chance of winning.
TP1-2-3 ---> Long position.
TP1-2-3-4-5 ---> Short position.
The optimum stop-loss for each position is on the chart.
Please share ideas and leave a comment,
let me know what you think.
CrazyS✌

Buy & Hold PalantirNYSE:PLTR
*This is a long term investment idea*
It's not a bad idea to start buying (& holding) Palantir down here.
With all the geopolitical tension in the world at the moment, the demand for their services should keep growing for the foreseeable future.
They have a stable stream of revenue from government contracts, along with a growing commercial business that should bolster their revenues.
Hence, their ever growing quarterly revenue numbers. (Screenshot below)
Technically speaking; momentum has been building bullish divergence for quite some time now.
At the moment, price is within the bottom range of the arcs, and has exited the yellow pitchfork without reaching it's median line. (Hagopian Gap)
I'm thinking that price should start climbing soon.
In the long term, I think price will eventually get back to the all time highs at $45.
Over the next few years, I'm thinking that a retracement to the 0.50 or 0.618 Fibonacci levels is likely. ($25 - $30)
I'm adding some PLTR to my retirement account this week.
I also plan to purchase some LEAPS in my trading account in three stages.
Positive Momentum Breakout
Weekly close above "Long-Confirmation A"
Weekly close above "Long-Confirmation B"
Fat_Fat
