GM Weekly Fork-WaveNYSE:GM
GM Weekly Fork-Waves
It looks like GM is about to enter Wave 3 of a larger-degree Wave 3.
This goes against the current market sentiment.
This is valid as long as the July low at $30 holds.
Fat_Fat
Pitchforks

TATASTEEL - Correction still not over!i feel the correction is still not over for the stock.....it might come back to the yellow dotted line, which will be a good level to buy...

Keep it Simple Stupid - SPYAMEX:SPY
This idea is a reminder to myself to keep it simple.
Divergence + Trigger Line Energy Point + Fib Confluence
Right now we're in No Man's land, which is not great considering I dumped my long position on Thursday. #Transparency
If we get another retest of that lower ML-H, that's a great spot to enter long. (Yellow Oval)
I'm hoping to get another shot.
I'll update the idea if I make any moves.
Fat_Fat
SPY 400AMEX:SPY
Near term SPY rally to 400
0.618 Fibonacci + (ML / ML-E / ML-H) Energy Point + Divergence
Fat_Fat

SPX retraced 50% of the post-Corona Bull in 50% of the time- BTDTLDR: THE SPX HAS JUST RETRACED 50% OF THE UPMOVE IN PRICE SINCE MARCH 2020 IN 50% OF THE TIME; THIS PROBABLY WASN'T A BEAR MARKET, BUT A TECHNICAL CORRECTION
The 50% Rule of W.D.Gann states that an asset will usually retrace 50% of its range in 50% of the amount of time that it took to establish the range.
Doctor Alan Andrews described the Action-Reaction system of technical analysis which also aligns with Gann's above theory
As far as i can tell, apart from the Doomer WWIII-Weimar2.0 Narrative , the best arguments as to why the bottom is not in are as follows:
1. Bear Markets last longer than 10 months
2. The Vix needs a bigger spike, >40
3. Fed 'printing'
History rhymes: hence in the first grey box...We see that in 2016-2018 there was a bullish phase (1-2) following which the market retraced 50% (2-3) over around six months and there was no capitulation spike in the vix; there was no QE going on in this period.
Since the corona pandemic, we have had a bullish phase (A-B) and now a 50% retrace of that move (B-C) for over 9 months.
I believe this has been a 50% technical retrace of the parabolic upmove between pivots A and B. I do not believe we are in a Bear Market.
The 2016/18 bull move in spx was circa 60% in 3 years
The post corona bull move in spx was circa 150% in just over 18 months
A retrace of 50% in circa 6 months for the 16/18 move is comparable to this 2022 retrace over circa 9 months. Because this parabolic move up since the Corona drop was so brutal- it needed longer to retrace the move.
BUT MOREOVER SPX HAS JUST DONE THE PERFECT 50% PRICE AND TIME RETRACE
Yes the economy is challenged by the growth versus inflation paradigm... Some things never change... The market is not the economy and the market is forward looking... Yes i do believe great system change is inevitable, but i believe it is fiat currencies rather than equities that will bear the biggest brunt of this- pun intended.
GRI 2022
***NO ADVICE 'EVERGIVEN'*** (you can't Suez me ;-)

ALKYL AMINES looks good at CMP--2949stock appears to have completed the 4th wave correction of primary cycle....
right now in the second wave decline of the 5th wave .......taking support at the 61.8% and upper median of white pitchfork.....

LongIt seems that the price is restrained in the fork . If the support is maintained, the possibility of continuing the upward trend is high

📉✌BTC 2H long Position✌📈BINANCE:BTCUSDT
COINBASE:BTCUSD
Between NOW and the entry area, you can open a long position in two steps.
If the price rises and reaches the risk-free level, you can risk-free the position.
TP1-2-3-4-5 are on the chart.
The optimum stop-loss is below the determined area.
!!! If the bottom of the channel got broken with a strong candle, find a suitable exit position as soon as the price returns to the range of the entry point !!!
Please share ideas and leave a comment,
let me know what's your idea.
CrazyS✌

LongIf the support is maintained, the probability of the upward trend is high ( hagopian with median line )


IWM Observation - Potential Reverse Symmetry Move? AMEX:IWM
This isn't a prediction.
In fact, I think a full retrace is unlikely.
However, I want to leave it as an idea to see how the chart unfolds.


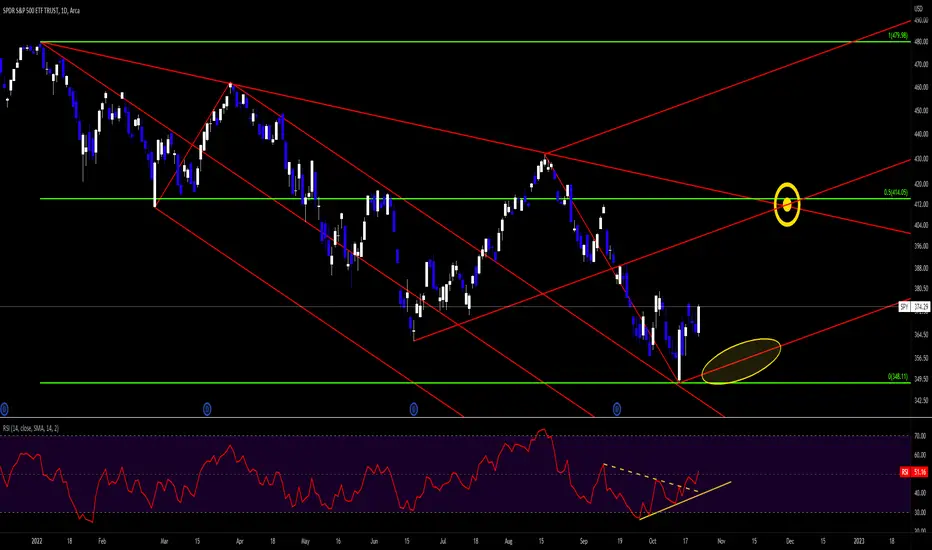
SPY Bear Fork N' FibAMEX:SPY
SPY has perfectly tested & wicked off the 200 SMA and trigger-line of the descending (red-dashed) fork that held price from late March through July.
Upon testing the trigger line, SPY is starting to show some bearish divergence on sub-daily timeframes.
If this trigger-line manages to hold, I'm expecting a move lower to the new (yellow) fork's median line which is conveniently in sync with the U-MLH of the previous fork.
Back in March, my original downside target levels for the SPY we're 350 or 320.
AKA the 50% & 61.8% retracement levels of the Covid low to "everything bubble" high.
I'm expecting that median line test to occur at or near one of these fib levels.
Target 1: 50% Fib - 350 SPY
Target 2: 61.8% Fib - 320 SPY
Let's see what happens.
Fat_Fat

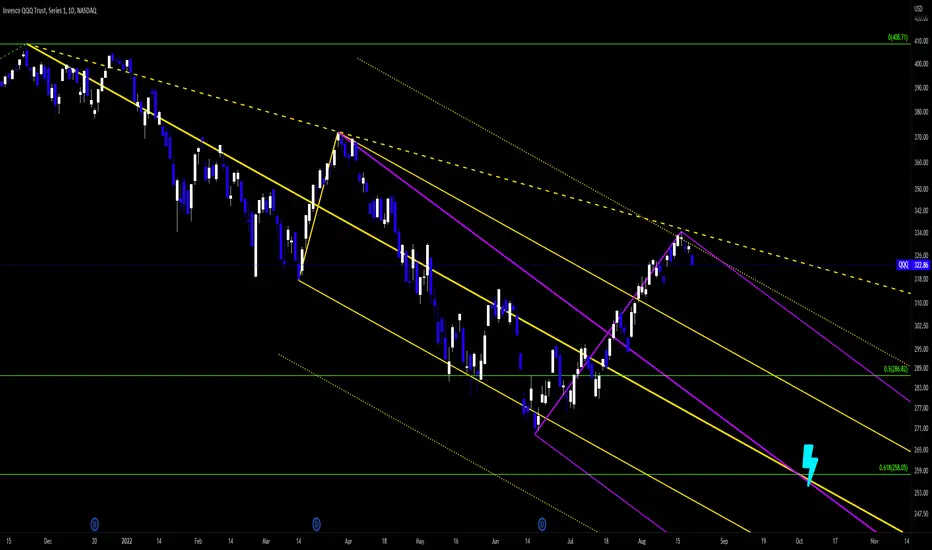
QQQ Fib Energy PointNASDAQ:QQQ
Very simple chart...
QQQ broke up out of the original fork (Yellow).
Price appears to be stalling out at the trigger line (Yellow-Dashed).
In addition, I plotted a warning line, using the 2.0 extension of the fork's median-line parallels to show another potential resistance area. (Yellow-Dotted)
Assuming that the Q's fail to sustain the rally past the trigger line/2.0 warning line; I've added another fork (purple) using the "C" pivot of the yellow fork as my origin point/"A" pivot, and the June low / August high as my "B" & "C" pivot.
I've noticed that the median lines of both forks cross to form what's known as an "Energy Point" right at the 0.618 fib level, aka $258 price level. (Measured from Covid Low to "Everything Bubble" high)
Energy Points pull price towards them like a magnet.
This Energy Point appears to take place between September 27th - October 4th.
I'm expecting the QQQ to fall at/near this energy point by early October.
Fat_Fat
Bullish SPY pitchfork analysisAfter reaching the higher pitchfork line (blue arrow) SPY went back to the same pitchfork line as earlier (red oval)--see related ideas and my notes there. At this point I expect it to go back up again. If that doesn't happen in a short time (1-2 weekly bars) SPY may fall more. If it does, which I expect, the it will likely break through the earlier resistance pitchfork line where the blue arrow is.

SPY: bullish (pitchfork analysis)Both on weekly and monthly chart SPY reached a couple of pitchfork lines (in both cases a bottom one and a middle one) and is likely to bounce back up.

LongIn the previous post, I forgot to show that, as you can see, the price intensified its downward trend due to hitting the median line from the bottom, but now it has not only broken the median line up, but is also supported by it. The position of the forks (Hagopian) shows a powerful upward movement. Personally, I think we may be at the beginning of a long-term uptrend.


NVDA SHORTNASDAQ:NVDA
NVDA running into the U-MLH of this fork, in addition to showing bearish divergence and a Bearish RSI swing rejection on the 30m timeframe.
I'm expecting a drop back to the lows, or potentially further to one of the lower fibs .702 / .786 (Covid Low to Market Peak)
It's a wide target area but I'm hoping to take profit on the next test of the median line in the $140 - $110 range.
Fat_Fat

Bad AppleNASDAQ:AAPL
Apple is running into some overhead resistance via the (green-dashed) trigger-line displayed on the chart.
Most oscillators are clearly turning over here.
To keep this chart simple, I left just this one fork/trigger-line visible.
The fork has two Fib extensions (1.618 & 2.618), which I expect price to navigate through.
However, there are multiple forks at play here. I'll add them as standalone comments.
I'm expecting AAPL to reverse here and continue lower.
At the very least, I believe price will get down to the $150 area. (Target 1)
Although, I also think that price will eventually make it's way down to the $120ish range (Target 2) , which is right at the (red) trendline and also a 50% retrace of the March 2020 low to "Everything Bubble" high.
Fat_Fat

Tenaga. How “low” it could “go”? 11/Oct/22Tenaga. “Monopolized” electricity ..its price probably may only found its “base” at within RM7.250 ( Demand Zone + lower channel of pitchfork ) and RM 6.839 ( POC of volume Profile)..

Bitcoin Cycle Low ForecastINDEX:BTCUSD
Bitcoin Weekly Chart
After the June low, Bitcoin found support riding up the 1.618 ML-E (Median Line Extension) of the Red fork until mid-August.
It briefly found support on the Yellow ML, until breaking below it a few weeks back.
Price has attempted and failed to make it back above the Yellow ML.
We see two consecutive weekly candles getting forced to wick under the Yellow ML.
This tells me that, price will continue heading lower.
Plotting additional median line sets, additional price targets become visible
All targets are energy points aka intersecting Median Lines (ML), Median Line Parallels (ML-H), and Median Line Extensions (ML-E)
I've noted potential price targets with the sky blue ellipse and circle.
The targets vary from 12.6K to 9.8K
I'm expecting the end of this next down move to become the ultimate low for this cycle.
As of right now, I'm thinking the ellipse will be the more likely target, as the circle is only a few months from the forecasted BTC halving in Feb 2024.
Let's see what happens.
Fat_Fat

Tesla down !The market break the support and it is in down trend there is a high probability to the trend continue to last level of pitchfork NASDAQ:TSLA
