Pitchforks

Did bitcoin come close to the endgame ?will bitcoin survive after this range ?
high probability to break the level 18265, if that happened 80% the market will touch level 12475
CME:BTC1!


SPY - Schiff Pitchfork Price ProjectionAMEX:SPY
$SPY 130m timeframe aka, the daily candle divided into 3 sessions (Morning/Lunch/Afternoon)
I applied a Schiff Pitchfork, starting with the (A) High pivot in late March, (B) the low pivot in June, and the (C) high pivot in August.
It embeds price movements quite well, and I believe gives us some hints as to where price is heading in the near term.
You'll see that price dropped from the peak in August and perfectly tested and bounced off the Median Line. (Green Circle)
Next, price managed to climb towards the U-MLH, but failed to reach it. Price topped out at $411. (Yellow Circle)
This was a key signal...
The Hagopian Law states that price failing to reach it's next target line will signal a strong move in the opposite direction.
Yes, this includes Median Lines, Median Line Parallels (MLH), and Warning Lines/Extensions.
(Reference - Watch 1:04:00 - 1:15:00) www.youtube.com
The failure of price to reach the upper parallel here signals that a strong reversal is likely.
This is exactly what happened...
Notice that when price reached the Median Line it both gapped under and retested it. (Orange Circle)
This tells us that the next likely target for price is the L-MLH, which coincides with the 50% Fibonacci retracement level of the Covid low to high. (AKA $350 SPY)
I plotted an additional descending Andrews Fork on the chart to show a potential path towards that L-MLH/50% Fib level.
It is my belief that $SPY will test the lower parallel of this Schiff Pitchfork / $350 price level sometime in October.
Fat_Fat

LongDue to the intersection of the forks, there is still a high probability of the continuation of the upward trend


level 11776 very important for NQ nasdaq break the downtrend so if it break level 11776.00 will go until level 12260.00
if not will make very strong pullback

S&P - Where to nextPossible price action from the recent rally can end within the pitchfork due to the 50sma resistance level (green line in the middle)
If that breaks and holds S&P could make a possible move to the up side to test the 200ema bringing it up to the 3865 price mark where it will need the bulls to bring everything they have to the party to breakout of the downward trend and keep the rally going.
If the S&P500 can't hold at the 200ema it may be quick reversal to the downside and most likely to retest the recent low

DXY Road to Heaven or He!!DXY current trend really remains bullish and prayers of a reversal seem to be just that.


SPX RANGE FOR 2022 is 3000-3800Pitchforks off major pivots
Fib retracement
This will not stop till it hits this range
My final chart for SPX
GRI 2022

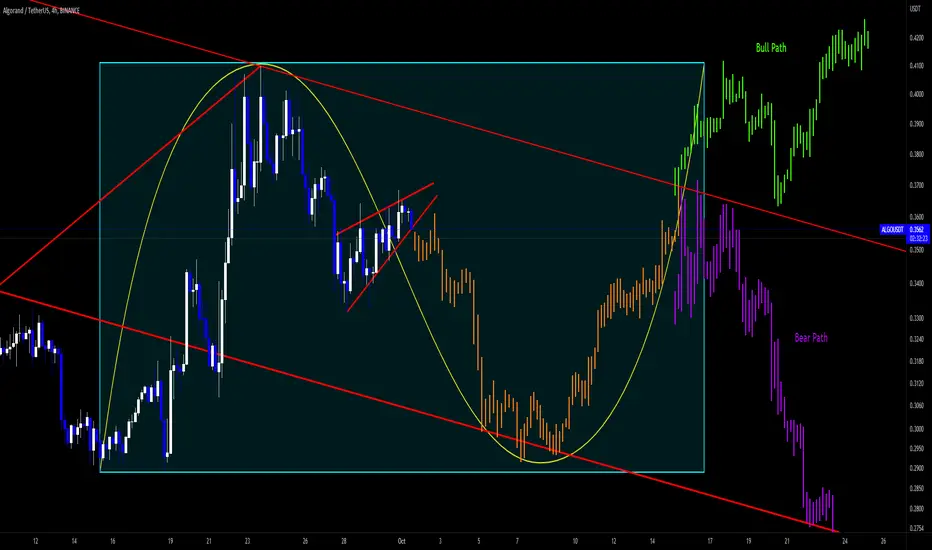
ADAUSDThe price is in a long-term downtrend and has reacted to the fork ranges several times, and the problem is in the upper range. If it can maintain its position and cross the green dynamic line and reach the blue range with a fast acceleration, it can be hoped that it will break out of its downward trend.

Short TeslaNASDAQ:TSLA
Tesla has put in an triple-top while failing to reach the median line of the red ascending fork. (Hagopian Gap noted by yellow circles)
The Hagopian Law states that price should make a strong move away from the Median Line/ MLH / ML Extension after it fails to reach it.
Price has now left the red ascending fork and has also broke under the sliding parallel. (yellow dashed line)
I'm expecting price to continue moving down the descending purple fork towards the support line at the "C" Pivot (Target 1), OR to the trigger line of the ascending fork (Target 2).
Target 1 = ~ $208
Target 2 = Trigger Line Range $170 - $135
* Note the intersection of the trigger line and descending fork's ML at ~ $160
Just speculation, but I'm thinking that the upcoming October 19th earning report may serve as a catalyst for this big move lower.
Let's see what happens.
Fat_Fat


HARTA long term bullish reversal w/ confirmation. 30/Sept/22Harta have long term bullish reversal setup with confirmation entry! Harta’s stock price By breaking wave b (cyan) the subwave of last impulsive leg down which is wave (v)(Red) confirmed a reversal signal for down trend Since August 2020...P/s people asking if you are so good why just don’t “keep yourself?!” R u trying to show off? Selling signals or looking for investors? Not at all. As we know, 1 ways to improve our trading, traders is to write down their “trading journal” instead of “keeping myself “ I write down AND Let “the public” to be “my judge” would be “more motivated “ to correct my mistake..

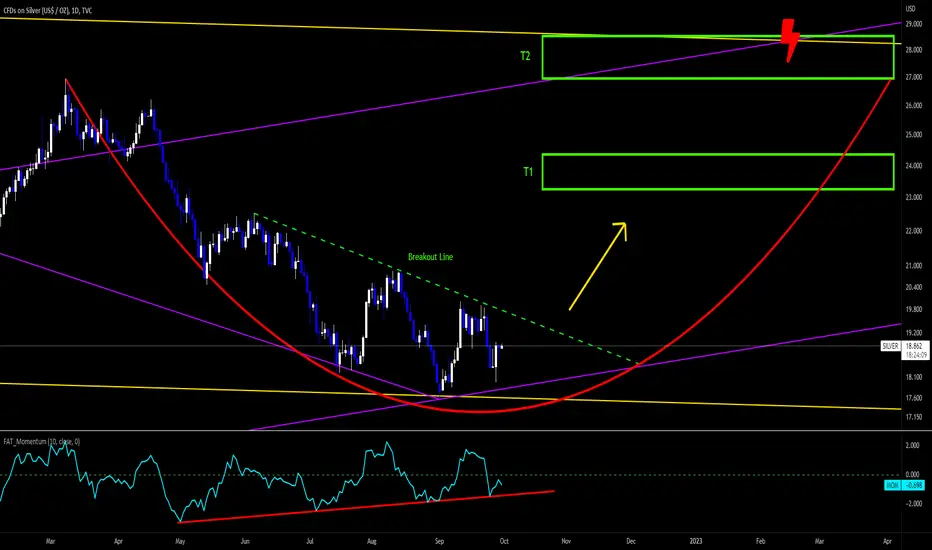
Long Silver Energy PointTVC:SILVER
Silver appears to be putting in a bottom right along the median line and lower parallel of two separate Pitchforks. (Larger Shot of both forks below)
Momentum showing some serious bullish divergence.
Not Shown MACD & RSI - Also showing solid bullish divergence.
Pending a breakout, I would expect that Silver rallies up the arc formation towards the energy point. (Lightning Bolt)
Energy Point = Median Line and/or MLH intersection, this one takes place at approximately $28.50 in late February 2023.
I've set two target areas as potential take profit levels.
T1 = 0.618 Fibonacci Retracement Level = $23.36
T2 = The U-MLH of the purple fork/Energy Point = $27 - $28.50
Let's see what happens.
Fat_Fat
S&P 500 - Deep Analysis and Trade PlanHey traders,
I figured I'd share my ideas for swinging and day trading the SP500 over the next several days / weeks. I'm using the continues SP500 futures chart but this analysis should work on SPX and SPY as well with few (if any) differences.
I'm going to do my best to make this post valuable even when this market structure is rendered broken by price action. My goal is to make this educational and hope to help people learn how to think their way through a trade, from planning to execution.
MARKET STRUCTURE (Daily Chart)
The market has been trapped beneath 4327 for quite some time and have, thus far, respected a high and a low of the range. Recent consolidation in the range during the last leg down has formed a small supply zone which could prevent prices from revising the high in the current structure.
On the bullish side of the coin, a demand zone dating back to the front side of the trend has been propping up prices. Over the last several days this demand zone has been successful in holding up the current price action, forming a reliable support in which to day trade from.
PRICE CAN ONLY DO ONE OF TWO THINGS
No need to overcomplicate the analysis at this stage. We just need to recognize that it can only do one of two things. I can respect support and move up or it can violate it and move down.
So far we have seen consolidation on support and no real burst of aggression from buyers, making one wonder if there are enough buyers to hold off the sellers at this level. It's important not to predict but one could make the argument that fighting for position at this level is worthwhile, whether bullish or bearish.
My thoughts are that, based on this chart and information, it is too early to execute a trade and pick a side. I'm rather conservative in these scenarios and would prefer to see additional confirmation of a side beginning to dominate the other.
IDENTIFYING THE OPPORTUNITY ZONES
A couple of parallel channels set to the recent highs and lows of this consolidation makes for an easy way to identify zones of opportunity and further develop trading plans.
I say "plans" because I am planning for both bearish and bullish movements for a swing trade as well as interactions with these levels for day trading opportunities. It is prudent to react to what the market is doing rather than trying to impose our individual will upon it. If it goes up, we trade up. If it goes down, we trade down. No reason to overcomplicate things.
At this stage we are simply looking for price to show us a sign of some form between the pair of orange lines at the top or bottom with no real preference. In lower time frames this could be useful for day trading and overnight trading setups. We are also looking for price to make it's move to the top or bottom side of the extremes, preferably with rising volume, spiking ATR, or a retest of that support or resistance level without breaking it.
HUNTING FOR A TRIGGER
These are some examples of potential setups and triggers on the hourly chart. Of course this is not an exhaustive list of possibilities but just an idea of some things we might see again at these extremes if the market were to continue to bounce around in this range.
Our plan, should the market stay inside of this range, is simply buy low, sell high or short high and cover low.
IT WILL BREAK OUT....
Eventually. When it does we should be looking at our volume, oscillators, ATR, or whatever your favorite flavor of confirmation is. Personally, I watch the ATR, RSI, and price action. I want to see a retest of old resistance become support or old support become resistance. When that happens, I look for my entry, trigger, and targets.
DIRECTIONAL BIAS - STICK A FORK IN IT
Now I'm ready to pick a side to lean toward. Team Bulls or Team Bears?
In my opinion there is no finer tool in all of technical analysis for establishing directional bias and studying the geometry of the market than the Andrews Pitchfork.
In the above picture we can see that the market has very clearly respected the top and center of the pitchfork. Based upon that, I would expect the market to continue to respect these levels until proven otherwise.
BEARISH TRADE PLAN
Our two parallel channels from the daily chart conveniently bracket the low of a recent swing in the market and intersect with the upper boundary of the pitchfork. If the market is kind to me, I'll get a nice trigger or bearish pattern at or near this area. From there, trade management would be relatively simple. Target the recent low and potentially beyond or exit the trade should the market fail to hold a down trending structure. My first price target would be the recent lows and the second price target would be the centerline of the pitchfork.
My thesis of a bearish move in the market is due to several factors:
1) There is a prevailing down trend prior to this range forming.
2) The market has shown weakness when approaching the upper extreme
3) The economic data continues to be unimpressive and talk of recession is rising
4) The geometry of the pitchfork has been respected and it is pointing down
5) Recent surging volume led to increasing prices, but prices have failed to break higher with any significant follow-through.
In my opinion this shows weakness in the market.
BULLISH TRADE PLAN
Sometimes we just do not get the market or analysis right. Sometimes we do everything right and the market does what it wants anyway. It's important to understand that our analysis does not control the markets and therefore we need a backup plan.
I see two possible scenarios based upon the data we have on this chart.
1) Prices pullback to the bullish opportunity zone and respect / confirm support and proceed upward
2) Prices move up from current levels and break out of this geometry of the market, push through the center of our parallel channels, and test the upper extreme.
In either scenario I would need a very clear trigger and indication of buying pressure. I personally feel as though this would be counter to the dominant trend and has a bit lower probability of success than our bearish theory. We can, however, make money on a bullish move and should be prepared to do so if the market dictates that prices should move up from here.
Surging volume on support recently gives indication that there could be strong buying pressure at the recent lows and that sellers might not have the power to push through the area. Joining these buyers could lead to entry early in a trend reversal, if even in the short or intermediate term.
CONCLUSION
Hopefully you enjoyed this read and my take on the current SP500 chart. I also hope that you find value in this post.
Please remember that this is not financial or trading advice but rather an attempt at sharing my thought process with the community.
Good luck with your trading!

trading rangeIf the support level is maintained, the probability of exiting the trading range is high, although with Friday's news, the price may return to the previous range.

Topglov. JP Morgan Tp of 0.45 May “achievable” 29/Sept/22.Topglove vs Karex ? Apple vs orange? 29/Sept/22.. Topglove as world largest gloves producer . Some “compare” it with world largest condom stock. Karex. As both are the “biggest player” of “rubber”products..One should have the “same fate” of the others. Just 1 question. Does human need “standard SOP/ protocol “ during sex activities.. Or “condom” or “gloves” is a “ must/need” = Can robots now “replace” “hand on” human’s arm in next 20 years?...Gloves or Hi -Tech which is “niche market”? = easy to copy but hard to sustain market ( only sustainable by big player) ? + “Branding”= Does Everyone think about soft drink = Coca Cola , Gloves = Topglov...AND last but least why Coca Cola is “more expensive “ than most “soft drinks”? Why can’t Topglove?

GBPJPY. @168. Which? Uk/Japan which lead to “doom”? 29/Sep/22GBPJPY’s 168 or gold’s 1680? I have been studying #WD Gann trading methodology for >15 years from his early astrology trading to later GANN Square.. BUT “both” are very “subjective” even his later Work of Gann Square more “practical” than astronomy method. Back to my “origin” maybe I should study more about Chinese’s Ancient Wisdoms where I found Chinese metaphysic/ 5 elements yin/yang harmony trading are more “practical” even as simple 168 numbers “stored” “prosperous energy”...p/s..From net : It is a little known fact that W. D. Gann went to India and studied Indian Sidereal Astrology. In his notebooks we find sketches of astrological symbols on his charts; and in his memoirs, he discusses his journey to India. In fact, the famous Gann wheel was first used by tea merchants in seventeenth century India..

Blackberry Fibo levelsFibo levels:
AB=0.61 XA
BC=0.61 AB=$6.65
0.78 XA=$63
1.6 BC=$70
0.88 XA=$94
2 BC=$120
2.24 BC=$169
1.13 XA=$250
2.6 BC=$288
1.41 XA=$763
3.6 BC=$1189
1.6 XA=$1752

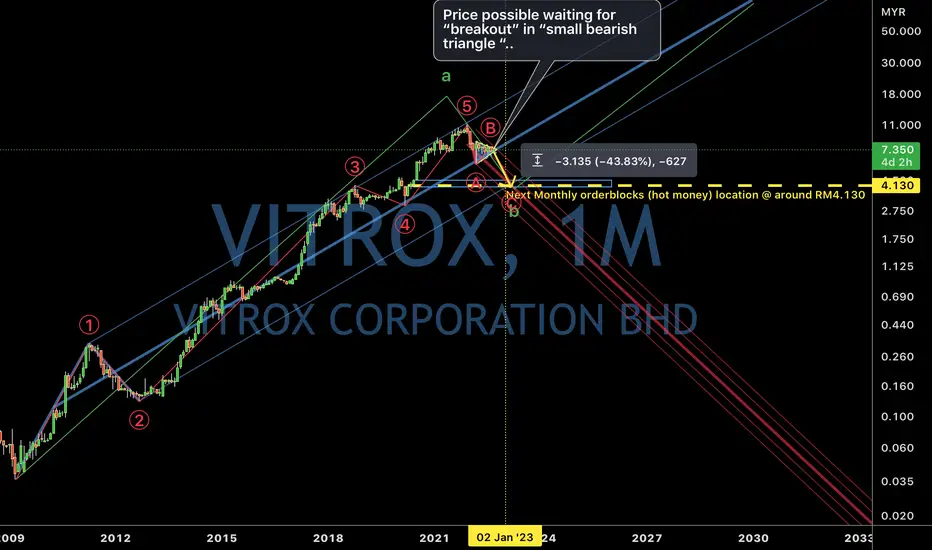
Vitrox. Elliott wave analysis. 26/Sept/22Vitrox. Malaysia 2nd largest tech stock by market capital after Inari. Its current Price seem like forming a “bearish triangle “ waiting to break to the down side.