3 spot potential support1- The trendline from 2015 and 2020 lows (Blue dashed in the chart) is offering a good support zone to check.
2- The SMA 50 support zone.
3- This is also the test zone of the 50% upper inside of the red Median Line per 1.2.3.
Update of
Pitchforks

SPY Forks Bear Market Rally Top 430-435AMEX:SPY
SPY Forks
Price finally broke out of the major descending fork that has held price since April.
Trigger line + minor fork showing a potential top around 430-435 in mid-August.
Confluence with the 200MA and .618 fib.
Let's see what happens.

Quick BTC 15min Short Position 💣⌚️BINANCE:BTCUSDT
COINBASE:BTCUSD
A quick position for short term traders
If the bullish candles remain weak. We can enter a short trade from this moment until the pullback of the price.
The optimal stop-loss is above 22887
TP 22217
If you are satisfied with the analysis, please follow us and share a with others.
CrazyS.

BABA - AccumulationChart request for @RocketFuel20,
BABA has a chart where a pitchfork is useful and can see how the trend accelerated to the downside into SC Selling Climax - falling through the lower warning lines.
It also hit the 1:1 fib at the low.
Since then BABA looks corrective but it may go on rallies once it gets above AR resistance.
Bullish divergence coming in on RSI.
Not advice.

DXY TEST LOG Test of the Center Line for DXY.
We been tracking this pattern since:
Potential trend exhaustion on watch.

Bitcoin dynamic levels IIIThis is only to update this
and this
Support zone on watch here - orange arrow.

US Oil Daily 🛢️💥TVC:USOIL
It seemed that if the oil price were stabilized above 101$ and did not respond negatively to the downtrend line, the price would rise to 118$ and the specified range.
The optimal stop for the Long position is below 100$.
Our previous analysis worked correctly.
If you are satisfied with the analysis, please follow us and share a with others.
CrazyS.

Doge moving northIn case of a strong move up we will check the 0.985 price zone (Red dotted horizontal trendline in the chart) . That should be a strong Resistance zone.
0.10 psychological level of course.
This chart is an update due to the recent nice move up. Update of:
Again: NO price predictions here but maybe U can use the levels in this chart to track the future price fluctuations.
Hope you enjoy!

EURAUD possibly SHORT opportunityHigh possibility to reach "Median Line" after breakout of constellation
#BEARISH FX:EURAUD

4H BTC LongBINANCE:BTCUSDT
This is a pretty simple set-up.
Pitchforks pointing to $23,000+ level.
BTC crossed above the median line, Ichimoku Cloud - Buy Signal, MACD/RSI/DMI positive.
The MACD/RSI/DMI, all have room to run on 6H & larger timeframes.
I'm targeting the upper MLH just above $23,000.
Entry = $21,200
Stop-Loss = $20,900
Take Profit = $23,200

Evaluating the price action of ETH Overview of reading the price of ETH and how it can help you make a more informed trading decision.

A fall knocking at the doorBTC is testing the low of the Schiff Pitchfork as of right now and if it succeeds in not breaking below the line, it will go up to at least the first green dotted line.

Is AAPL gonna miss and find a bottom?Will APPL be able to overcome this candle syndrome?
In case it misses its earnings, this is how I see it finding a bottom. I think Apple is being used to "manipulate" the market and keep the indices up.
Otherwise, enjoy the continuation of this rally during the 2nd semester! :)

ADA/USD - 1 day chart analysisHere is a closer look at this ADA/USD 1 day chart:
ADA is in a Ichimoku P Wave (the 2 converging Blue Trend-lines on Chart) on this daily timeframe. This P Wave is potentially Bearish because it is an inverted P. Note that the bottom trend-line of the P Wave is near the 38.20% ($0.430) Fib Retracement level.
The Ichimoku Cloud Conversion Line (Tenkan Sen) is indicating that the Mid-Point of the Short-Term Momentum is upwards at the moment. Note that the Conversion Line (Tenkan Sen) is still under the Base Line (Kijun Sen)
The Ichimoku Cloud Base Line (Kijun Sen) is indication that the Mid-Point of the Mid-Term Momentum is sideways at the moment.
The Ichimoku Cloud Lagging Span (Chikou Span) is indication that Momentum is downwards at the moment. Note that the Lagging Span (Chikou Span) is still under the past price.
Note that ADA is still in the Bearish Zone of the Ichimoku Cloud.
ADA is still below its Bollinger Bands Middle Band Basis 20 Period SMA for the 1 day timeframe. Note that the Upper and Lower Bands are Pinching inwards at the moment.
At the moment of typing this, ADA has dropped below its Least Squares Moving Average (LSMA). A daily candle close below the LSMA would be considered a Sell Signal for this indicator on this 1 day timeframe.
ADA is still well below its Longterm Upwards Pitchfork Pattern Median Line and is also below its Lower Yellow Pitchfork Resistance Line.
Looking at the entire ADA Chart we can see that the Volume Profile Visible Range Point of Control (VPVR POC) is at $0.041 and we can see the previous huge Volume Cluster from $0.096 to $0.033. This represents the area where the most volume was traded.
Looking at the Average Directional Index (ADX DI) we can see that the Trend Strength is dropping with the ADX (Orange Line) at 13.988 still below its 9 Period EMA (Black Line) which is at 15.181. Negative Momentum has dropped with the -DI (Red Line) at 19.976 and Positive Momentum has also dropped with the +DI (Green Line) at 17.218.
Looking at the Relative Strength Index (RSI) we can see that momentum is downwards at the moment. Note that the RSI (Purple Line) is below its 9 Period EMA (Orange Line) which is a sign of negative momentum strength. Note that the RSI still has plenty of room to drop before entering the Oversold Zone on this 1 day timeframe.
If ADA breaks below its P Wave and its 38.20% ($0.431) Fib Retracement level then we may see an eventual drop to its 50% ($0.233) Fib Retracement Level.
For the upside, we need ADA to stay above its LSMA and to eventually get back ABOVE and CLOSE a daily candle ABOVE its BB Middle Band with a successful re-test as support on this 1 day timeframe.
Looking at this ADA 1 day chart really puts things in perspective, as you can see, ADA spent from March 2018 to March 2019 in the BEARISH ZONE of the Ichimoku Cloud which was then followed by about a year or so of a few rises and falls until March 2020 when ADA rose from $0.017 to an eventual new ATH of $3.143 in Sept 2021. Once this world wide recession and financial/crypto bear market is over be it in a year, 2, 5 or 10 years, eventually the Market Makers will decided that the Path of Least Resistance to Profit is…… upwards! So you have to position yourself ready so you can take advantage of the next parabolic rise up, not just in crypto but also stocks, commodities and indices.
This is all my opinion so please do your own research because its you money.
I hope this is helpful with your trading and hodl-ing.

VET/USD - weekly chart updateLooking at the VET/USD 1 week chart we can see that VET is in a massive Falling Wedge Pattern. A Falling Wedge Pattern is potentially a Bullish Reversal Pattern. Note that the APEX of the Falling Wedge Pattern is located around the end of October 2023. A weekly candle CLOSE BELOW the Lower Converging Trend-line can easily invalidate this pattern as we saw with the previous weekly Rising Wedge Pattern that got invalidated.
Here is a closer look at this VET/USD weekly chart:
At the moment of typing this, VET is still way below its 50MA, 100MA and 200MA. For the downside, be on the lookout for if/when the 50MA crosses UNDER the 100MA on this 1 week timeframe. For the upside, be on the lookout for if/when VET crosses back above its 200MA and successfully re-test it as support.
VET is also still way below its Least Squares Moving Average (LSMA) for this 1 week timeframe. For the upside, be on the lookout for if/when VET crosses back ABOVE and COLSES a weekly candle ABOVE its LSMA creating a BUY Signal for this indicator on this 1 week timeframe, also look out for any successfully re-test as support.
VET is still way below its Bollinger Bands Middle Band Basis 20 Period SMA for this 1 week timeframe. Note that both the Middle and Lower Bands are pointing downwards and the Upper Band is sideways at the moment. For the mid to longterm, VET needs to cross back ABOVE and CLOSE ABOVE its BB Middle Band Basis.
Looking at VETs longterm Modified Schiff Pitchfork Pattern, we can see that VET is still way below its Pitchfork Median Line and has also found resistance from its Lower Green Resistance Line.
Looking at the Trend-Based Fib Extension tool, we can see what levels VET has above and below it as potential Support and Resistance. Note that the 1 ($0.01845) Trend-Based Fib Extension Level is located roughly where the 78.60% ($0.1811) Fib Retracement Level is located.
Looking at the Fib Retracement we can see that VET has the 78.60% ($0.01811) and 100% ($0.0857) Fib retracement Levels as potential support.
I have added to areas of Support which i believe are of great interest as highlighted by the Horizontal Black Lines with Blue Shading. We can clearly see that VET has found strong Support from its first Support Area. The longer VET stays and keeps re-testing this area with lower highs, the more the support volume will be chipped away and VET will potentially drop further to its next support cluster.
The Volume Profile Visible Range Point of Control (VPVR POC) is located at $0.004946 and you can see the increased volume cluster located from around $0.00857 to $0.00287. If VET drops to that level, we can expect a huge buying opportunity to cause a spike up.
As you can see on this weekly chart, Traded Volume has been low since around Jun 2021 compared to what VET was getting from July 2018 to May 2021.
Looking at the Average Directional Index (ADX DI) we can see that the Trend Strength is increasing with the ADX (Orange Line) rising to 17.129 and above its 9 Period EMA (Black Line) at 15.182. Note that Negative Momentum has dropped with the -DI (Red Line)at 28.041. Positive Momentum has also dropped with the +DI (Green Line) to 16.636.
Looking at the Moving Average Convergence Divergence (MACD) we can see that the MACD Line (Blue Line) is still in the Negative Zone under the 0.0 Base Line and has been in the Negative Zone since the week of the 13th Dec 2021. Note that the MACD Line (Blue Line) is slight curving upwards so be on the lookout if the MACD Line (Blue Line) crosses back above the Signal Line (Orange Line) creating a Buy Signal on this 1 week timeframe for this indicator.
Looking At the Stochastic Indicator (STOCH) we can see that the %K (Blue Line) is still under its %D (Orange Line) and both lines are deep in the Oversold Zone and has been for the last 10 weeks. What is interesting is that VET has been in the Oversold zone a few times on this weekly timeframe and on 3 previous occasions VET has spent about 15-16 Weeks in this Oversold Zone before rising above 20. Could be one to watch.
I still believe that there is a huge possibility that BTC will hit $12K especially with inflation and the recession we are in, if that happens then we can expect VET to at least WICK DOWN to its 2nd Support Area which is located by its 100% ($0.0857) Fib Retracement Level and its 1.414 ($0.096) Trend-Based Fib Extension Level.
I would not get excited on tis weekly chart unless VET closes and successfully re-test as support its LSMA. For the Longterm, wee need VET to break back above and CLOSE a weekly candle ABOVE its Bollinger Bands Middle Band Basis and 200MA.
Once this world recession is over and the Governments, The FED, The Bank of England ect ect have completely cleaned up from inflation and whatever else, then the Market Makers will eventually decide that the Path of Least Resistance to Profit is upwards. So once this recession and financial/crypto bear market is over, be it in a year, 2, or even 5 to 10 years. You need to position yourself to be able to buy back in on your crypto of choice and take full advantage of the next parabolic wave up.
This is all just my opinion so please do your own research as its your money.
I have tried to cram quite a lot in this post as this will probably be my last longterm VET/USD weekly chart post for a while unless something major happens so I hope this is helpful with your trading and hodl-ing.

Follow the eye - detailsIn the chart there are 2 Median Lines, 1 Fan (Dr . Alan H. Andrews style) a trendline - and... a smiling dog 'cause it's Fun!
Now the Median Line per 1.2.3. been shared for the first time here
The Upper Parallel Median line test is where the Blu arrow is and it shows a dynamic resistance level that worked pretty well.
Here is another update of the same pattern:
Right now prices are close to the 50% lower inside Parallel Median Line, first small green arrow in the chart. The 2 green arrows show 2 potentially relevant support zones.
The second Median Line is the one per 1'.2.3. The prices tested the Center Line of this pattern (orange arrow). The second test been where the blu arrow is, and it's the 50% upside parallel of this Median Line (resistance).
This Median line been shared for the first time here:
and then here:
but the most important been this one
Considered the efficacy of these 2 Median Lines in the past we may have high probability to see these patterns working as good dynamic levels to check even in the future.
The dynamic trendline offered extremely relevant Res. zone that been tested multiple times and may worth a check in the future. The first time we pointed out the potential efficacy of that trendline been here:
The Fan using the Dr Alan H. Andrews settings could be used as dynamic support and resistance to check and the crosses of the fan with the trendlines generated form the Median Lines are called "energy points" and could be checked as price magnet levels as well as resistance or support and trend chaange detectors.
Maybe U can use the levels in this chart to track the future price fluctuations.
Hope you enjoy!
(Too much hurry from me yesterday, have to say sorry to Nico the moderator.)

BTC Bounce : Range $25K to $29K retracing to low $12KUtilising the humble pitchfork, the way price zoom / gaps on CME through median line plus other factors.. Low Aug/Sept...
Lets see what happens. Looking to fade the bounce.. DCA when at $20K and below..

Follow the eye @elonmusk @BillyM2kPrices going up and down: it's called "price fluctuation" and use to be driven by financial speculation. Prices and rates change as supply or demand changes. If something is in demand and supply begins to shrink, prices will rise. If supply increases beyond current demand, prices will fall. If supply is relatively stable, prices can fluctuate higher and lower as demand increases or decreases.
In the chart there are 2 Median Lines and 1 Fan - Dr. Alan H. Andrwes style - and... a smiling dog!
Maybe U can use the levels in this chart to track the future price fluctuations.
Enjoy!
This chart Update of
and

Algorand - Getting kind of cheapGotta say this is tempting. So is proof of stake possible to compete with PoW? Economically I understand this just makes the existing holders constantly wealthier. Also there are pre-sales, etc. So, kind of a scam.
On the other hand, the tech is pretty cool and transaction fees super-low. So this seems pretty competitive.
Drew like 3 pitchforks on this chart, IMO if Algo breaks out from here it could be a big winner, otherwise I'm looking at the 20 cent range.
Feel free to correct me or enlighten me on any of this.

bch to 40
... or 0
- retail investorError
Gosh, that's a very brief description. Could you please tell your audience a little bit more about what you're publishing.

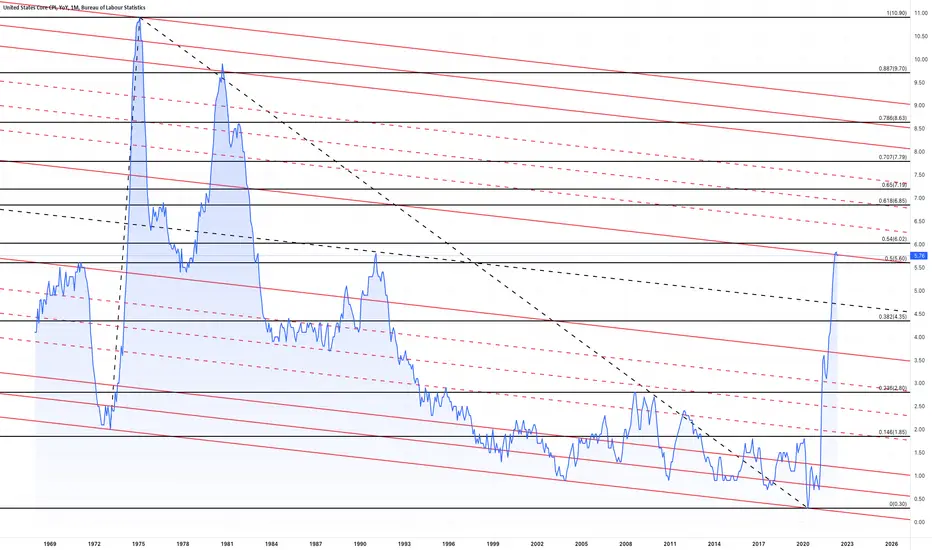
USCCPI * US CORE CPI consumer price indexUS CORE CPI consumer price index ::: Consumer price indices measure the average price change of all goods and services that are bought by households for consumption purposes. The Harmonised Indices of Consumer Prices are calculated monthly.
$btc #btc bitcoin price analysis and target bitcoin price prediction. Elliott wave analysis with pitchfork combination.
1. bitcoin buy zone as long as we hold 14k
2. below 14k most like we going for 10K
3. target for 5th wave +100K
4. if we are still in the correction of WXY then the Blue line which price should follow - target 150K

