The Red Median Line for a potential "first target" zone to checkMay 12 analysis: "the Red Median Line for a potential "first target" zone to check in case of test of the Center Line."
Right now prices are testing testing the Center Line of the red downsloping Median Line. This is also a pretty relevant static support zone to check.
In case of a move under the ~ 20K support zone then please check this pattern
Pitchforks


WTI....Its Complicated! But! Hello Dear Traders.
These are Complicated Trend lines ....
But watch for Price action around each trend,
If Price Above a line Consider it as The near support u have,
and The line above is Your Next resistance.
U will have some price action Between them,
Take your Trades wisely.
wish u good luck
<3

BTC/USD - Weekly Chart Falling Wedge Pattern and a P WaveBTC is in a massive Falling Wedge Pattern. A Falling Wedge Pattern is potentially a Bullish Reversal Pattern. Note that the APEX of the Falling Wedge Pattern is around March/April 2024.
BTC is in a Negative Ichimoku P Wave Pattern. BTC has been in 2 Previous P Waves from the all time high and both P Waves ended with further drops to the downside.
BTC is also in a massive Ichimoku Y Wave Pattern. This gives us a new All Time High potential target for BTC if it does eventually rise and especially if its stays above the Lower Descending Trend-line of the Falling Wedge Pattern.
BTC is still deep in the Bearish Zone of the Ichimoku Cloud on this 1 Week timeframe. Note that we have already had a Kumo (Cloud) Twist into a RED Bearish Cloud on this 1 Week timeframe.
BTC is still below its 200MA. A successful WEEKLY CLOSE ABOVE the 200MA and successful re-test as support is crucial for any longterm uptrend to become viable. Note that BTC has closed 3 weekly candles below its 200MA.
BTC is still below its Least Squares Moving Average (LSMA) on this 1 Week timeframe.
BTC is still way below its Bollinger Bands Middle Band Basis 20 Period SMA. Note that both the Lower Band and Middle Band are pointing downwards and the Upper Band is pointing upwards but we may see the Upper Band curve and start moving downwards.
At the moment of typing this, BTC has found some resistance from its 78.60% Trend-Based Fib Extension Level.
At the moment BTC has found some support from its Descending Pitchfork Median Line.
The Black Horizontal Trend-line at around $17,588 is a crucial level to watch.
Looking at the Average Directional Index (ADX DI) we can see that The Trend Strength is Strong with the ADX (Orange Line) at 30.19 still above its 9 Period EMA (Black Line) at 24.70. Negative Momentum is slightly downwards with the -DI (Red Line) at 38.57 and Positive Momentum is also sideways within a range with the +DI (Green Line) at 12.18.
From my opinion, if you are waiting to go long with BTC/USD for the Mid to Longterm, i would air on the side of caution at the moment because i still believe that £12K is a huge possibility especially with inflation increasing to help pay back the trillions of $ and billions £ printed during the covid pandemic to prop up the stock market.
Mid to Longterm, we need to see a successful weekly close ABOVE the 78.60% Trend-Based Fib Extension level, the P Wave as well as the 200MA with a successful strong re-test as support on this 1 week timeframe. A successful close ABOVE the LSMA and successful re-test as support will also be a good sign of potential renewed Mid to Long-term upwards momentum. As usual, BTC needs to get back ABOVE and CLOSE a weekly candle ABOVE its BB Middle Band Basis. Until we see all of the above, then Mid to Longterm wise, it’s sideways within a range at best or downwards at worst.
Again this is all just my opinion so please do your own research as its your money.
I hope this is helpful with your Trading and Hodl-ing.

Corn: Pitch forks at playContinuous Corn – Weekly: Up trending vs Down trending Pitchforks – Continued from 6/2/22…
Up until two weeks ago it appeared that cash corn was going to follow the green bars up with the up trending pitchfork. The July/Sep inverse was a big challenge and the move lower just killed the chance for the continuous chart to maintain upward momentum. Currently the Sep corn leading the continuous chart and is looking for support against the median line in the 6.00 to 6.08 area. If we can catch a bounce look for resistance against the lower level blue line up into the upper level red line. Retracements in the 7.00 to 7.50 area will match up against the pitchfork resistance zones.
Below the median line offers support around the 5.45 area

RUSSIAN MOEX INDEX DOWN 5.7%Russian Moex and the Median Line.
The Median Line tells that there could be good probability that prices will reach the Center Line.

Long BTC 30m ideaCME:MBTN2022
Nice Modified Schiff set up with bullish divergence on 30m BTC futures.
Bullish Divergence + Bullish RSI Swing Rejection
Long BTC to the median line / Volume POC, approximately $21,175

SPY bullish (pitchfork analysis)SPY reached the middle (red) of the pitchfork line which is a likely point of bounce (and it already bounced off a bit from the line). On the higher end SPY reached the same width of the pitchfork channel (a little over). The red circles show the top and the bottom.

more slide is coming till the starting of the Worldcup?crab harmonic pattern:
X=$0.382
A=$0.0002
AB=0.61 XA
BC=0.38 AB
0.78 BC=$0.015
0.88 BC=$0.018
1.13 BC=$0.027
1.6 BC=$0.064
0.78 XA=$0.077
2 BC=$0.125
0.88 XA=$0.163
2.24 BC=$0.19
2.6 BC=$0.36
1.13 XA=$1
3.6 BC=$2.1
1.27 XA=$2.92
4.23 BC=$6.2
1.41 XA=$8.2
1.6 XA=$38.92

BTC, ETH, CEL, DOGE, SOL, ICP I want to see BTC Start the new week candle slightly above or around $22,300.
What I am looking for going into this Sunday's candle for BTC and what I want to see in these other coins for places to enter. I also looked at some other things regarding these coins. Probably not that useful for the things that have already happen for people that do not use my indicators to trade, but as always to those that do it is pretty straight forward and simple.

GMTUSDTPERP/BINANECThis is not sure for 80 % and do your search before you enter in this position and you can do with your money whatever you want to do dont forget to follow me. Go with 0X leverage and the stop loss is less than 2% so if this trade loss we will nit less so much but if this trade going right we will take so much


BTC Comprehensive UpdateYes, this is a 20 minute video. But I speak quickly. This Idea is meant to be watched as a video. If you do not watch the video and only read below, you will not get much from this idea or may get the wrong idea.
Overall I have been short (Not in market) since the reversal in the stock market on April 5th and 6th. I go over all this in the video and I talk fast. So there is a lot of information to see.
I don't want to put investment strategy short, because I don't really want to say that where the price currently is, is a good spot to short. It seems odd to too heavily before any non crypto markets are open, but after they closed for the weekend. Considering the market was pretty obviously bear on Thursday and Friday.
Possible targets if we drop below 28k and have some bad price action are then to around 26.9k and most likely between 22.35k and 23.3k.
For me to feel bullish on BTC I would have to see several things. It is too complicated to explain without showing the chart, but I mention it in the video.
It is worth the watch. I reference the most important things that I look at to determine bitcoin price movement.
Based on the Schiff pitchfork, It looks like the lack of movement in BTC is actually distribution and that we have failed to hold the key channel (Jun 1st). We also had a hard rejection of the top of the current channel on Jun 6th.
If you have any questions feel free to leave them below.

SPY Scenarios - Red Pill / Blue PillAMEX:SPY
Spy Bull / Bear Scenarios
Red Pill = SPY continues dropping to the lower bound of the green fork. (Approximately the 345-350 level)
Blue Pill = SPY reverses higher to the median line of the white fork, with the potential to rally to the upper bounds of the white and/or green fork.
Lightning Bolt = Potential relief rally peak?
Let me know which scenario you think is more likely in the comments.

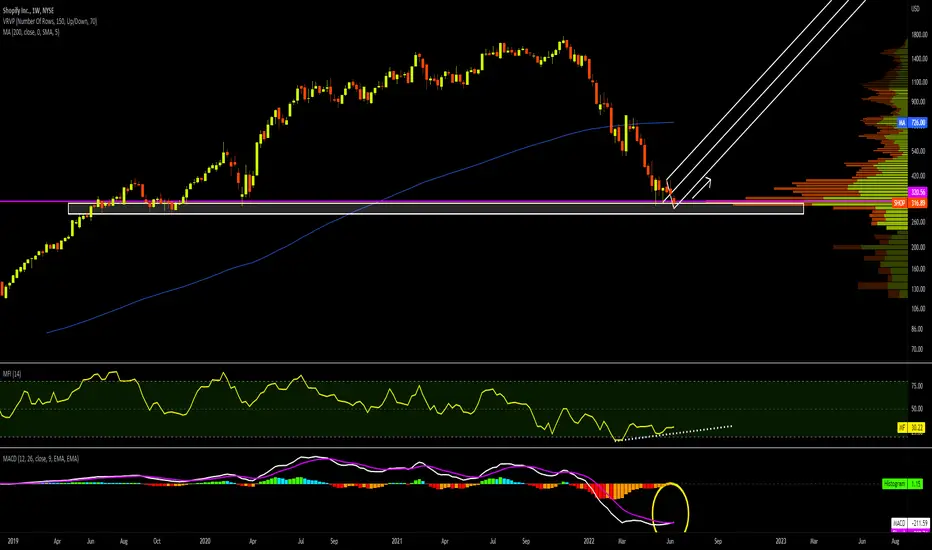
Long ShopifyNYSE:SHOP
Shopify dumped to a major support level.
Weekly MACD crossing up, Weekly MFI showing bullish divergence.
10/1 stock split coming on June 29th.
See AMZN prior to June 6th split. (27% rally)
I'm anticipating SHOP rallies here. (Perhaps to low $400s or $470)
I'm going long tomorrow on the market open.
I hope to hold the position until price exits the fork.
I'll be watching for this on daily and lower timeframes.