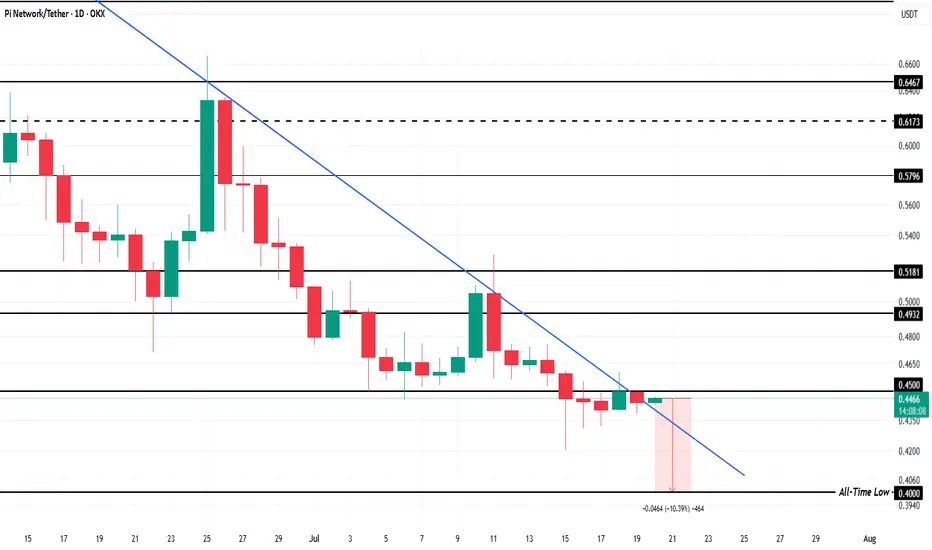
Pi Coin is Now 10% From an All-Time Low; Any Chance of Recovery?OKX:PIUSDT current price of $0.44 is holding just below the resistance of $0.45, a critical level for the altcoin. However, with the ongoing downtrend, this resistance is proving difficult to breach. The altcoin has faced continuous declines for the past two months, and without significant support, it remains susceptible to further drops.
OKX:PIUSDT is only 10% away from reaching its all-time low of $0.40. Given the current market conditions and Pi Coin's negative correlation with Bitcoin, the chances of the altcoin falling to this level are growing.
However, if investors increase buying pressure, OKX:PIUSDT may experience a rebound . A successful breach of $0.45 as support could lead to a recovery, pushing the price to $0.49. If this happens, the current downtrend could be invalidated, providing a potential window of opportunity for OKX:PIUSDT to reverse its fortunes.
PIUSDT
PI breakout from wedge and Trendline !!🚨 PI Breakout Update 🚨
Hey traders, hope you're all doing great!
Looks like PI just broke out of a strong trendline, and things are getting interesting.
We’ve seen solid support holding for a while, and now bulls are starting to wake up.
This move could be the start of something big if momentum continues.
Still early, but signs are pointing towards a possible bullish leg up.
Watch for a clean retest of the trendline — that could be your confirmation.
Volume is building nicely, and price action is starting to shift.
If you're tracking PI like I am, this is one to keep an eye on.
🔔 Follow for more updates and let's catch this move together!
Piusdt making double bottom ??Hello traders, I hope you're all doing well!
Currently, we're seeing an interesting setup on PI that could lead to a potential bullish move. Let's break it down:
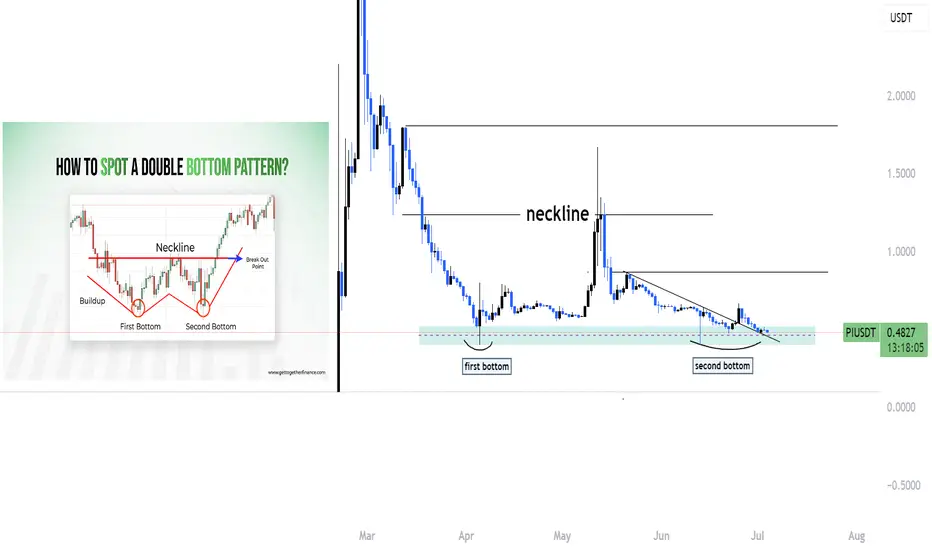
🔹 Double Bottom Formation
PI appears to be forming a double bottom on the higher time frame — a classic bullish reversal pattern. This indicates that the market has tested a key support level twice and failed to break lower, which often suggests that selling pressure is weakening.
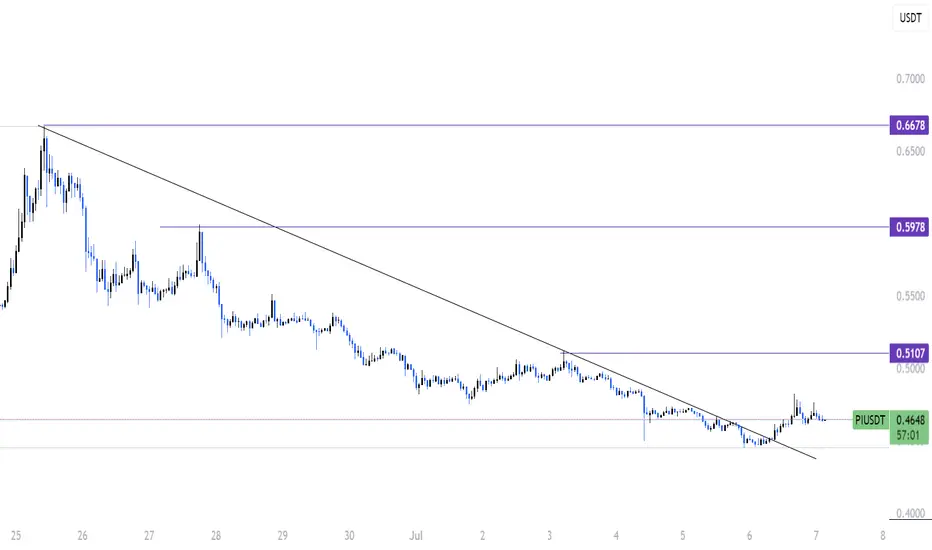
🔹 Trendline Breakout
In addition to the double bottom, we’ve also broken out of a descending trendline that has been acting as dynamic resistance for some time. A clean breakout with volume often signals a shift in market structure from bearish to bullish.
🔹 Strong Support Zone & Liquidity
We are still holding above a strong support zone, where previous demand has stepped in. This area has likely accumulated a lot of liquidity, with stop-losses from retail traders sitting just below. If price holds this level, it may trap sellers and trigger a short squeeze, pushing the price higher.
🔹 Possible Upside Move
As long as we remain above this support and confirmation continues, there is a high probability of an upward continuation. This could be the start of a bullish leg, especially if we see a break of recent highs with strength.
📈 Conclusion
This confluence of technical signals — double bottom, trendline breakout, and liquidity resting below support — gives us a strong reason to watch this setup closely.
👉 Like and follow if you’re seeing the same structure or planning to trade this move. Let’s ride it together!
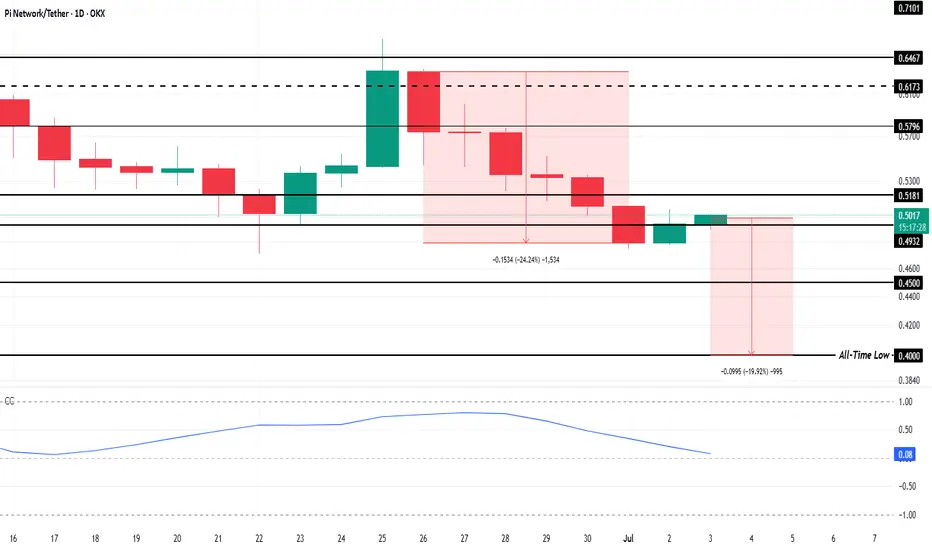
Pi Coin Closes In On All-Time Low; Bitcoin ResponsiblePi Coin’s price is currently hovering around $0.499, which is approximately 20% above its all-time low of $0.400. However, the overall market environment suggests further decline may be imminent. With continued bearish sentiment and decreasing confidence in Pi Coin , the altcoin could struggle to maintain its current levels.
Furthermore, the correlation between the Pi Coin and Bitcoin has steadily decreased. Currently, it is just 0.07, a stark contrast to the positive relationship the two coins once shared.
A low or negative correlation means that Pi Coin is moving independently of Bitcoin. This is concerning for investors who have relied on Bitcoin’s momentum to drive altcoins like Pi forward.
If Pi Coin loses the support level of $0.493, it may drop further, potentially testing the $0.450 mark. A sustained decline below this support would make Pi Coin vulnerable to hitting its all-time low again. The ongoing outflows and negative market sentiment only add pressure to Pi Coin’s price, keeping it on a downward trajectory.
However, should the altcoin experience a shift in momentum, Pi Coin could find demand from investors looking to capitalize on a potential recovery. If the coin breaches $0.518 and flips into support, it could open the door for a price rebound. A reversal would allow Pi Coin to regain investor confidence and potentially invalidate the current bearish outlook.
Pi scalp risky but lets GO!!!!Hello traders, hope you're doing well!
NASDAQ:PI is showing strong bullish signs.
It's currently moving within a falling wedge pattern.
A breakout and pump could be coming soon.
If you profit from this, don’t forget to like and follow!

PI's situation+ Target PredictionThe price has broken the ascending wedge, and this could push it toward the middle of the channel, potentially happening very quickly.
Best regards CobraVanguard.💚

PIUSDT falling wedge breakout 🚨 Hello Traders!
PIUSDT has successfully broken out of a falling wedge — a strong bullish pattern.
This breakout may indicate the start of an upward move.
Watch for a retest of the breakout zone for potential entries.
Volume confirmation will add confidence to the setup.
Stay alert and always apply proper risk management. 📊

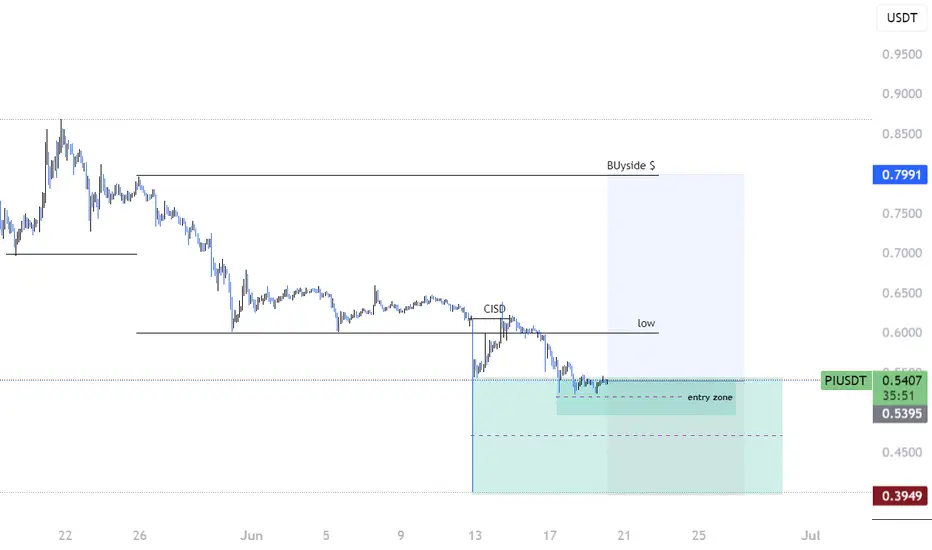
Pi long !! proper risk management Hello traders, keeping a close eye on NASDAQ:PI — forming a solid pattern.
Strong wick indicates a potential buy zone in this area.
We do have some untapped downside liquidity below.
However, with CRT in play, a bullish move is likely.
We’ve already completed CISD confirmation on the 3H timeframe.
Looks like a good opportunity to position for the upside.
PI breakout !!Trendline Break:
Price has broken above a descending trendline — often a bullish signal.
A small retest is visible, indicating confirmation of the breakout.
Equal Highs (Liquidity Pool):
Labelled “$$ same highs” — this suggests buy-side liquidity is resting above that level.
Price often targets these highs to grab liquidity before a reversal or continuation.
BSL (Buy-Side Liquidity):
Two BSL levels marked; price may aim for these as upside targets.
FVG (Fair Value Gap):
The green shaded zone above represents an imbalance (FVG), usually a magnet for price.
Price may fill this area, targeting between 0.95 – 1.10 USDT.
📈 Expected Move (Bullish Bias):
Short-term: Move above the “$$ same highs” to run liquidity.
Mid-term: Push towards first BSL (~0.75 USDT).
Long-term: Potential fill of the FVG zone around 1.00 USDT.
⚠️ Watch for:
“same highs” area (could be a stop hunt).

PI bullish Breakout!! BUY BUYHello traders i hope you are doing as we can see Market done breakout from falling wedge as well as we are having liquidity and FVG which is not metigated yet so i am expecting market back to FVG
buy buy!!

Pi usdtI gave a update on pi be4 but the levels I was expecting a possible bullish but the zone didn't hold but we are still on a uptrend on piusdt so I will advise you buy more pi cause the 1w and 1day is on a uptrend waiting for 4h to change direction on the support zone den boom to the up side but pi to 10$ soon

Pi just making Strong trendline liquidity targeting 0.96-0.99Hello traders PI is technically bearish but having strong trendline luqiidity as you can see on chart clean targeting 0.96-0.99
always enter after risk management

PI in coming Weeks ...Finally, this pattern was broken and had a positive impact, leading to significant growth. Now, with a slight price correction, higher price levels can be reached.
Stay Awesome , CobraVanguard

PIUSDT Daily Technical AnalysisPIUSDT Daily Technical Analysis
Pi Network Coin Indicators Are POSITIVE.
The price has broken above the 21-day moving average and successfully held above it. Currently, Pi Network appears to be targeting the $0.905 resistance level. After a wave of profit-taking, its recovery has increased the likelihood of continued positive price action. Resistance levels will be monitored closely. Indicators have turned positive from lower levels and are now pointing upward.
Resistance Levels: 0.900 – 0.963 – 0.999
Support Levels: 0.830 – 0.810 – 0.787
Positive news from the Pi Network team could support further upward price movement. Accumulating Pi Network Coin at these price levels for long-term investment might be considered potentially profitable. However, the decision is entirely yours. This is not financial advice. In the long run, Pi Network Coin may test the $3 levels again — or it might remain at a lower price range.
NOT FINANCIAL ADVICE
The information, commentary, and suggestions provided here do not constitute investment advice. Investment advisory services are offered only through a formal agreement with authorized institutions such as brokerage firms, portfolio management companies, or non-deposit banks.
The content on this page reflects personal opinions only. These views may not align with your financial situation or your risk and return preferences. Therefore, investment decisions should not be made solely based on the information provided here.
If you’d like to stay updated on our technical analyses — whether positive or risky — please follow and like us. We’d really appreciate your support!

Bearish Pressure Builds on PIUSDT – Here’s the Trade Plan📌 Idea
PIUSDT is showing weakness after testing the recent resistance at 0.85944. Price is now trading below the VWMA, indicating fading bullish momentum and potential for further downside.
The setup favors a short entry as price fails to reclaim above the resistance zone, forming lower highs and showing signs of rejection.
🔽 Trade Setup
• Entry: 0.80799
• Stop Loss: 0.90983 (above resistance zone and wick high)
• Take Profit 1 (TP1): 0.66507 (first support zone)
• Take Profit 2 (TP2): 0.58008 (previous demand area)
⚙️ R:R Breakdown
• TP1 R:R ≈ 1.92
• TP2 R:R ≈ 3.31
This gives a good reward potential relative to the defined risk.
🔍 Technical Highlights
• Recent Resistance Level at 0.85944 rejected multiple times
• VWMA is trending above price – bearish bias confirmed
• Support Zone near 0.66507 acting as TP1
• TP2 marks a significant previous low near 0.58008
🧠 Idea Summary
I'm watching for further rejection under 0.85944 and signs of weakness to ride this short toward the support zones. This trade remains valid as long as 0.90983 holds as resistance. A break above this level invalidates the setup.

PIUSDT Daily Technical AnalysisPIUSDT Daily Technical Analysis
Pi Network Coin indicators are POSITIVE.
It has broken above the 21-day moving average and managed to stay above it.
The announcement that the Pi Network team will make about its ecosystem on May 14th could significantly benefit the project and increase activity around the cryptocurrency.
Resistance: 0.79028 - 0.90433 - 1.05080
Support: 0.68164 - 0.57126 - 0.55010
New and positive news from the Pi Network team could support a price increase.
At these levels, accumulating Pi Network Coin for long-term investment could be considered potentially profitable. The decision is yours. This is not investment advice.
In the long run, there is a possibility that Pi Network Coin could retest the $3 levels.
For users who use the Pi app and hold locked Pi Network Coins, if there is no urgent need, they may consider re-locking their coins for another 2 weeks. They can continue this strategy by monitoring the price every two weeks.
In the long term, the probability of the price reaching much better levels remains high.
THIS IS NOT INVESTMENT ADVICE.
The information, comments, and suggestions here do not fall under investment advisory services. Investment advisory services are provided under an agreement between clients and authorized institutions such as brokerage firms, portfolio management companies, and non-deposit banks.
The content of this page reflects only personal opinions.
These views may not be suitable for your financial situation or your risk and return preferences. Therefore, investment decisions should not be made based solely on the information and content on this page.
We’d appreciate it if you could follow and like us so you don’t miss our analyses with positive or risky technical indicators.
Pi usdtPi usdt have been a nice crypto pair after having a good support and a change of structure from de daily time frame, and then we have a break and retest on the zone am expecting more bullish on pi usdt

If you're stuck, watch (full analysis)Hello friends
Given the high growth of this token, now that it has made a good correction, it makes sense to buy in stages and with capital management and move with it to the specified goals.
*Trade safely with us*

PI Testing Red Resistance – Breakout Potential!🚀 NASDAQ:PI Testing Red Resistance – Breakout Potential! 📈
NASDAQ:PI is testing the red resistance zone again. If the price breaks through, the first target could be the green line level! 📊
Let’s watch this breakout unfold! 💼💸

PI UPDATEHello friends
According to the triangle pattern that the price has formed, you can see that we had a decline and after that the price has managed to create a small ascending channel that indicates the inflow of money and we can expect the price to grow to the ceiling of the channel within the channel itself and in case of failure in the lower ranges, other buying steps have been identified.
*Trade safely with us*

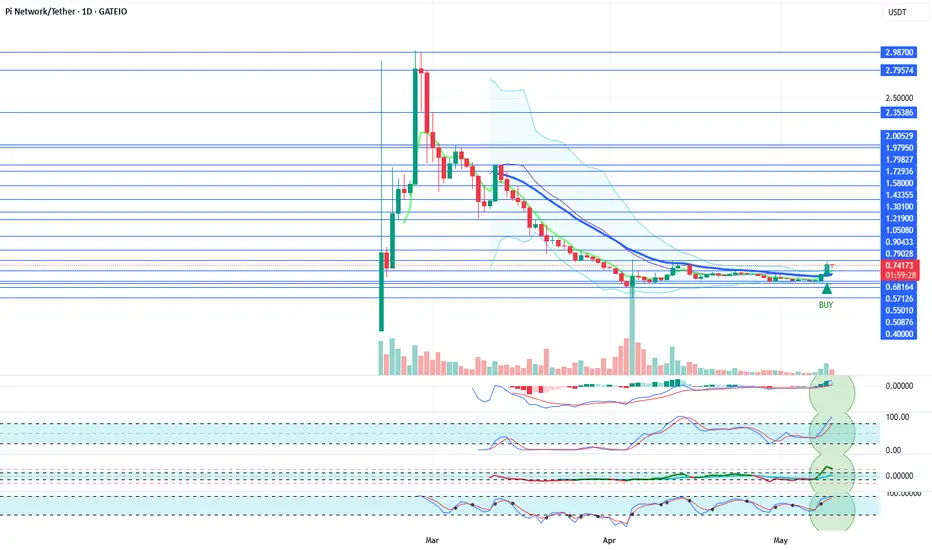
PIUSDT Daily Technical AnalysisPIUSDT Daily Technical Analysis
Pi Network Coin indicators are POSITIVE.
On April 14th, Pi Network Coin faced a strong sell-off after failing to break above the 21-day moving average (0.75121), dropping down to the support level at 0.59073 before attempting to recover. If this support holds, it may test the 21-day moving average (now at 0.71713) again. If it can rise above this level, it will also break through the 0.69100 resistance at the same time. Overall, we can say that Pi Network Coin has halted its downtrend and increased the probability of a new upward move. Positive news from the Pi Network team could support a price increase. At these price levels, accumulating Pi Network Coin for long-term investment might be a reasonable decision. The final decision is yours. In the medium term, there's also a possibility that Pi Network Coin could retest the $3 level.
For users of the Pi app who have locked coins, if there's no urgent need, they can choose to relock their coins for another 2-week period instead of selling. They can then track the price every two weeks and decide to relock again if appropriate. The long-term potential for the price to reach much higher levels still remains strong.
THIS IS NOT INVESTMENT ADVICE.
The information, comments, and recommendations here do not constitute investment advice. Investment advisory services are provided within the framework of an agreement to be signed between the investor and brokerage firms, portfolio management companies, or non-deposit-taking banks. The content shared here reflects only personal opinions. These views may not be suitable for your financial situation, risk, and return preferences. Therefore, no investment decisions should be made solely based on this content.
If you'd like to avoid missing out on our technical analyses with positive or risky indicators, please follow and like us — we'd appreciate your support!

PI/USDT:SIGNALHello friends
Given the price growth, you can see that we had a stop and a triangle pattern was formed, which is a continuation pattern of the trend.
Now, given the complex market conditions, our suggestion to you is to buy in stages and be sure to observe risk and capital management.
I have also specified goals for you.
*Trade safely with us*

80% DropIs an 80% Drop Ahead for Pi Network (PIUSDT)? 📉
🔹 Key Supports: 0.50, 0.10, and 0.01 USD
🔹 Key Resistances: 0.60, 0.70, and 1.00 USD
✅ PIUSDT is in a downtrend, and after breaking below 0.60 USD, it has dipped under the 0.50 USD support zone. If this trend continues, a decline toward 0.10 USD (approximately 80% drop) is possible.
📉 If sellers maintain control, breaking 0.50 USD could accelerate the downtrend.
📈 However, reclaiming 0.60 USD may lead to a corrective move toward 0.70 USD and potentially 1.00 USD.
🔍 Conclusion: The trend remains bearish, and a confirmed breakdown of 0.50 USD increases the likelihood of a drop to 0.10 USD.
