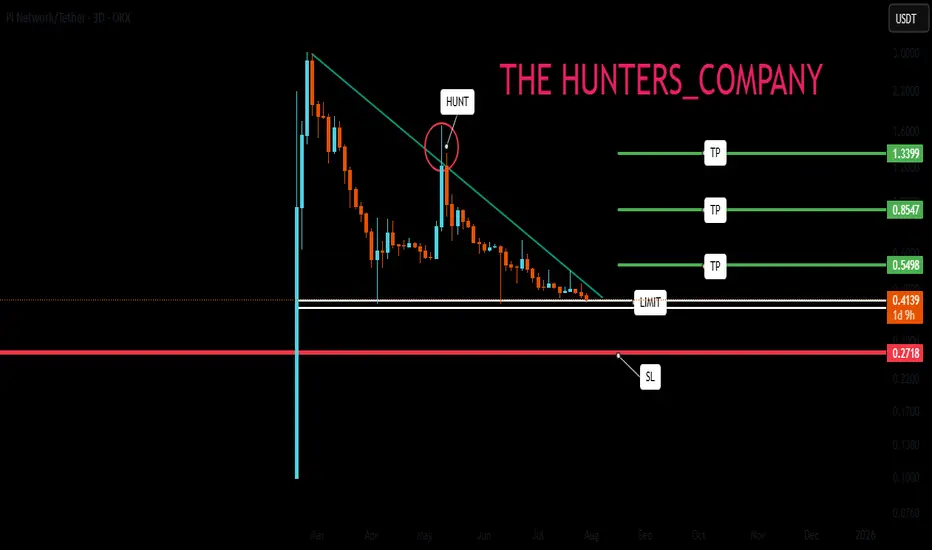
PI NETWORK : Will it finally be pumped?Hello friends🙌
👀According to the decline we had, you can see that the price has reached an important area and has formed a floor in this area. Considering the classic ego that is forming on support, you can enter the trade by breaking the resistance, of course, by managing risk and capital and moving with it to the specified goals.
🔥Follow us for more signals🔥
*Trade safely with us*
Piusdtlong
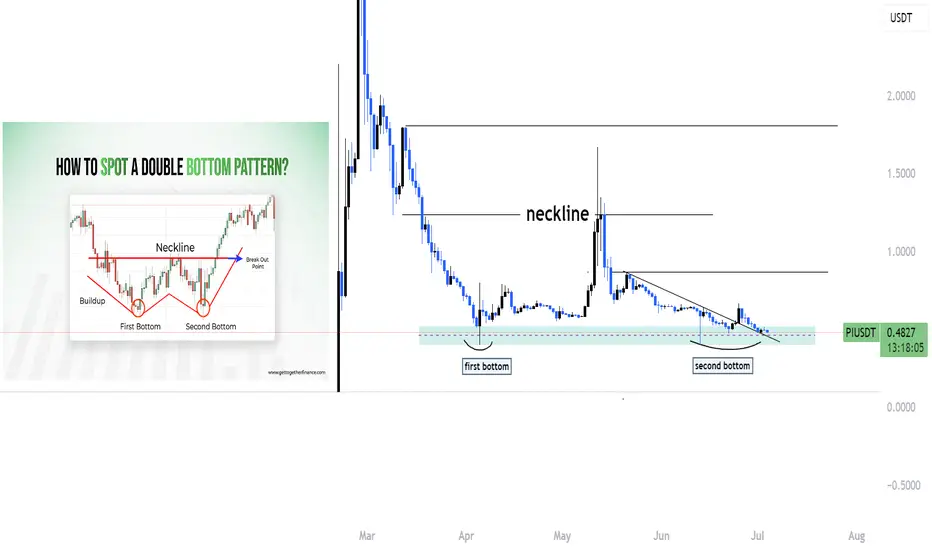
Piusdt making double bottom ??Hello traders, I hope you're all doing well!
Currently, we're seeing an interesting setup on PI that could lead to a potential bullish move. Let's break it down:
🔹 Double Bottom Formation
PI appears to be forming a double bottom on the higher time frame — a classic bullish reversal pattern. This indicates that the market has tested a key support level twice and failed to break lower, which often suggests that selling pressure is weakening.
🔹 Trendline Breakout
In addition to the double bottom, we’ve also broken out of a descending trendline that has been acting as dynamic resistance for some time. A clean breakout with volume often signals a shift in market structure from bearish to bullish.
🔹 Strong Support Zone & Liquidity
We are still holding above a strong support zone, where previous demand has stepped in. This area has likely accumulated a lot of liquidity, with stop-losses from retail traders sitting just below. If price holds this level, it may trap sellers and trigger a short squeeze, pushing the price higher.
🔹 Possible Upside Move
As long as we remain above this support and confirmation continues, there is a high probability of an upward continuation. This could be the start of a bullish leg, especially if we see a break of recent highs with strength.
📈 Conclusion
This confluence of technical signals — double bottom, trendline breakout, and liquidity resting below support — gives us a strong reason to watch this setup closely.
👉 Like and follow if you’re seeing the same structure or planning to trade this move. Let’s ride it together!
Pi scalp risky but lets GO!!!!Hello traders, hope you're doing well!
NASDAQ:PI is showing strong bullish signs.
It's currently moving within a falling wedge pattern.
A breakout and pump could be coming soon.
If you profit from this, don’t forget to like and follow!

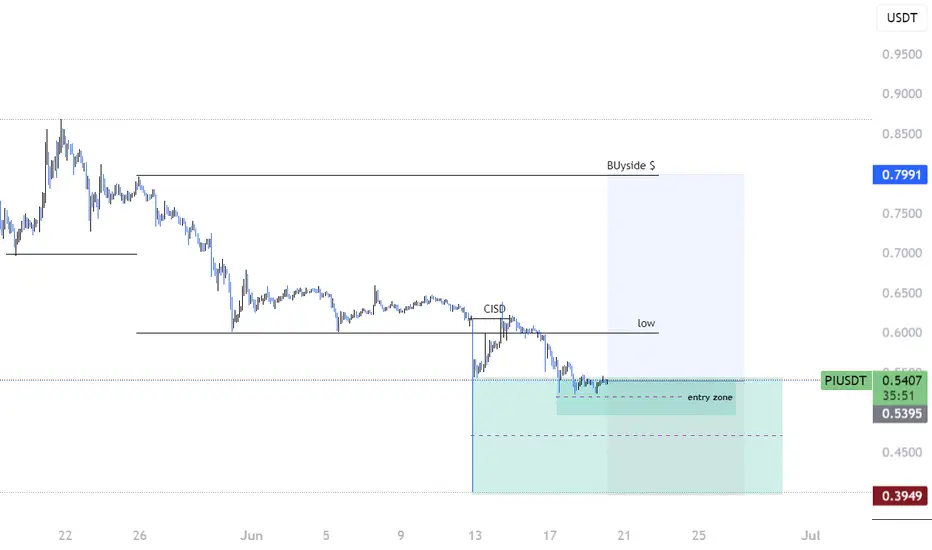
Pi long !! proper risk management Hello traders, keeping a close eye on NASDAQ:PI — forming a solid pattern.
Strong wick indicates a potential buy zone in this area.
We do have some untapped downside liquidity below.
However, with CRT in play, a bullish move is likely.
We’ve already completed CISD confirmation on the 3H timeframe.
Looks like a good opportunity to position for the upside.
PI breakout !!Trendline Break:
Price has broken above a descending trendline — often a bullish signal.
A small retest is visible, indicating confirmation of the breakout.
Equal Highs (Liquidity Pool):
Labelled “$$ same highs” — this suggests buy-side liquidity is resting above that level.
Price often targets these highs to grab liquidity before a reversal or continuation.
BSL (Buy-Side Liquidity):
Two BSL levels marked; price may aim for these as upside targets.
FVG (Fair Value Gap):
The green shaded zone above represents an imbalance (FVG), usually a magnet for price.
Price may fill this area, targeting between 0.95 – 1.10 USDT.
📈 Expected Move (Bullish Bias):
Short-term: Move above the “$$ same highs” to run liquidity.
Mid-term: Push towards first BSL (~0.75 USDT).
Long-term: Potential fill of the FVG zone around 1.00 USDT.
⚠️ Watch for:
“same highs” area (could be a stop hunt).

PI bullish Breakout!! BUY BUYHello traders i hope you are doing as we can see Market done breakout from falling wedge as well as we are having liquidity and FVG which is not metigated yet so i am expecting market back to FVG
buy buy!!

If you're stuck, watch (full analysis)Hello friends
Given the high growth of this token, now that it has made a good correction, it makes sense to buy in stages and with capital management and move with it to the specified goals.
*Trade safely with us*

PI UPDATEHello friends
According to the triangle pattern that the price has formed, you can see that we had a decline and after that the price has managed to create a small ascending channel that indicates the inflow of money and we can expect the price to grow to the ceiling of the channel within the channel itself and in case of failure in the lower ranges, other buying steps have been identified.
*Trade safely with us*

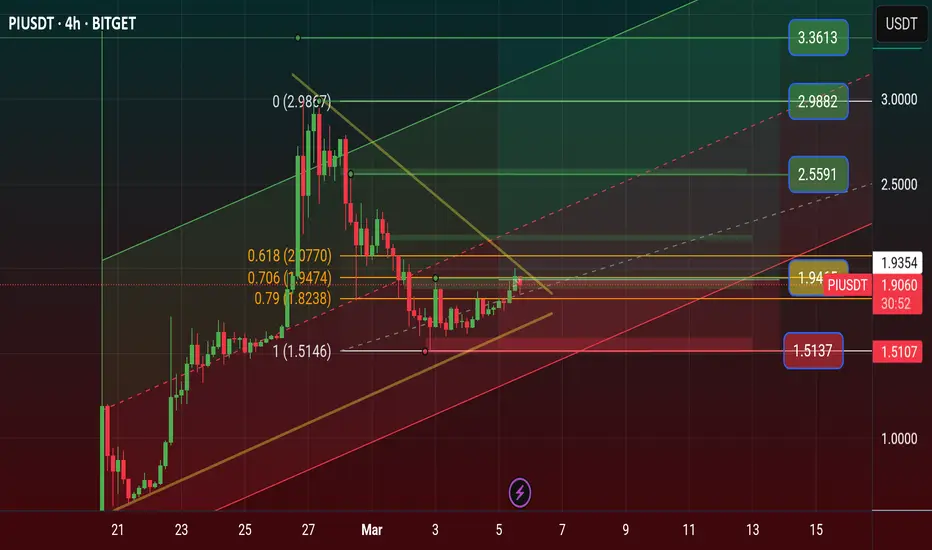
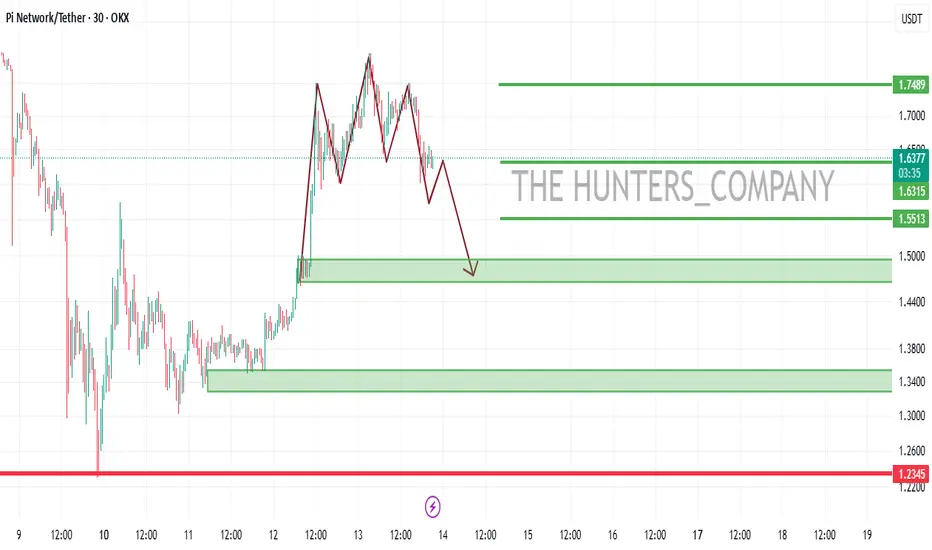
PI/USDT:SIGNALHello friends
Given the price growth, you can see that we had a stop and a triangle pattern was formed, which is a continuation pattern of the trend.
Now, given the complex market conditions, our suggestion to you is to buy in stages and be sure to observe risk and capital management.
I have also specified goals for you.
*Trade safely with us*

Just In: $PI Dips 6% Losing The $1 Pivot- Is There Still Hope?The price of the crypto currency NASDAQ:PI saw s noteworthy dip today, down by 6% approaching All time Low (ATL). With massive selling pressure, NASDAQ:PI has lose the $1 pivot to the bears.
However, with the appearance of a falling wedge, it clearly hints at an impending bullish reversal on the horizon with a speculated 350% surge albeit the crypto is having its own fair share of the marker's volatility.
With the RSI at 31 further hinting at a trend reversal, a breakout might be lurking around the corners.
Pi Price Live Data
The live Pi price today is $0.678989 USD with a 24-hour trading volume of $213,832,968 USD. Pi is down 5.03% in the last 24 hours. The current CoinMarketCap ranking is #26, with a live market cap of $4,612,460,558 USD. It has a circulating supply of 6,793,134,138 PI coins and a max. supply of 100,000,000,000 PI coins.

PI...Hello friends
Given the good growth we had, we now have the opportunity to buy in the pullback...
You can buy in steps within the limits we have specified for you with capital management...
*Trade safely with us*
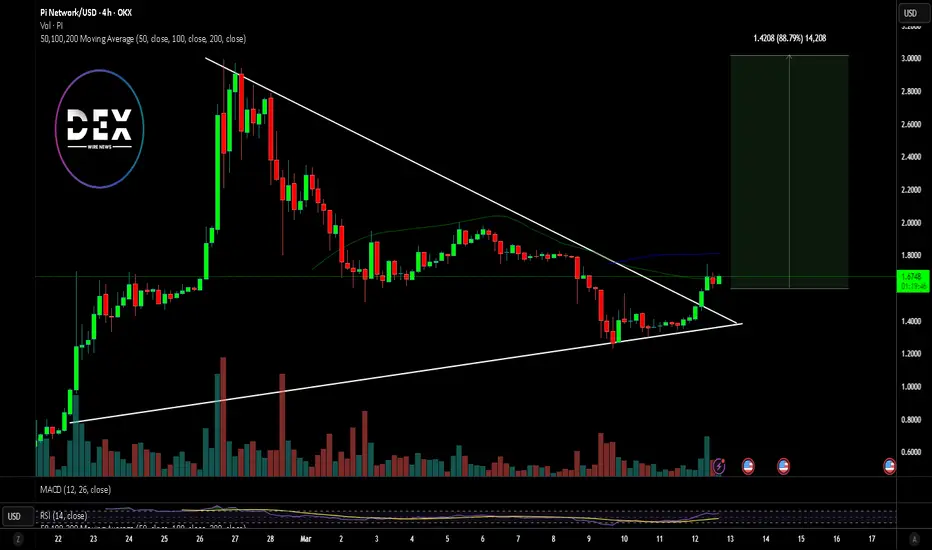
$PI Set for Massive Breakout Amidst Bullish Symmetrical TriangleThe long-awaited launch of NASDAQ:PI has ignited excitement in the crypto space. After six years of mining, Pi Coin finally hit the open market last month, and its price action suggests a potential major breakout. With a bullish symmetrical triangle pattern forming and key technical indicators aligning in its favor, NASDAQ:PI is gaining traction among investors and traders alike.
Technical Analysis
Pi Coin is currently trading at $1.66, having surged 22.75% in the last 24 hours. Its 24-hour trading volume stands at an impressive $811,256,445, indicating strong market interest.
Symmetrical Triangle Formation
A symmetrical triangle is often considered a continuation pattern, signaling a potential breakout in the direction of the prior trend. NASDAQ:PI recently broke out of this bullish formation, setting the stage for further upside movement.
The Relative Strength Index (RSI) sits at 62, suggesting increasing buying pressure. An RSI above 70 typically signals overbought conditions, but with room for growth, NASDAQ:PI is positioned for an extended bullish campaign. If buying pressure intensifies, NASDAQ:PI could soon breach the key psychological resistance at $2, with the next pivot point set at $3.
Market Capitalization and Trading Volume
NASDAQ:PI boasts a live market cap of $11.91 billion, with a circulating supply of 7.15 billion coins. Such a high ranking underscores the coin’s growing adoption and market confidence.
Conclusion: What’s Next for Pi Coin?
With strong technical indicators and a solid fundamental foundation, NASDAQ:PI appears well-positioned for continued growth. If the buying momentum sustains, breaking the $2 resistance could open the door for a push towards $3. Meanwhile, its unique approach to mining and real-world adoption potential make it an intriguing project for long-term investors.
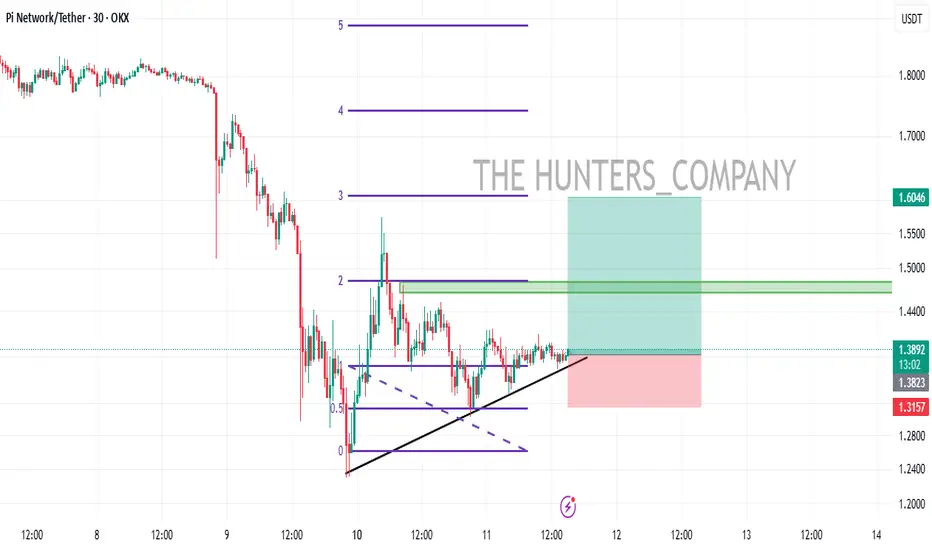
PI/USDT (UPDATE)Hello friends
Given the price drop, now with the formation of a triangle and the price compression, we will probably have a good pump, so we have determined the entry point and price targets for you to enter with risk and capital management.
*Trade safely with us*
$PIUSDT Price Road to $11 Price Prediction 2025 Pi Network News: Can Pi Coin Price Hit $11? Key Levels Revealed, Pi Already Get place 11 of the Market.
Pi Network has gained 6.8% in the past 24 hours, outperforming major cryptocurrencies like Bitcoin (+7.5%), Ethereum (+8.9%), XRP (+11.1%), BNB (+9.8%), and Solana (+7.8%). But that’s not the real surprise.
Since its mainnet launch, PI's price has skyrocketed by an incredible 1,775.77%, while the overall crypto market has dropped by 11% in the same period. That’s a staggering contrast - and a sign that something big is happening.
With PI breaking key resistance levels and speculation about a major exchange listing growing, investors are wondering: How much higher can PI go? Could we see a breakout past $2? Let’s dive in.
💗 Why Is PI’s Price Rising?
Since February 20, PI has gained an incredible 1,775.75%, with a 7.5% jump in just the last 24 hours. This steady rise shows that Pi Network is moving independently of the broader market, maintaining strong momentum.
Key Reasons Behind PI’s Price Rally
Several factors are driving PI’s price increase:
Mainnet Migration Deadline Approaching
Pi Network is reaching its final deadline for users to migrate their holdings. According to a recent blog post from the team, March 17 is the last day to complete the migration. This deadline may be increasing buying pressure as investors prepare for the next phase.
🧡 Potential Binance Listing
Speculation around a Binance listing is another major factor. In a recent Binance community poll, over two-thirds of participants supported listing PI. If Binance or other major exchanges list it, the price could see a significant boost.
US Election Impact on Crypto
Donald Trump’s return to office is bringing a more crypto-friendly stance from the US government, which could benefit projects like Pi Network.
💝 Can PI Break $2.2?
Experts believe that if PI moves past the $2.2 resistance level with strong volume, it could rally toward $11. However, if it fails to break through, selling pressure could push it down to $1.5 Stoploss price area
To maintain its bullish trend, PI needs to hold support above $1.7. The price is currently just 1.11% below the key $2.2 level, making the next few days crucial in determining its next move.
🩷 Never Miss a Beat in the Crypto World!
Stay ahead with breaking news, expert analysis, and real-time updates on the latest trends in Bitcoin, altcoins, DeFi, NFTs, and more.
Pi Network has defied market trends and harsh criticism before, and if history is any guide, this rally might just be getting started.
🩵 Why Is Pi Coin’s Price Rising?
Pi Coin’s price is rising due to increasing exchange interest, migration deadlines, and strong community support, pushing demand higher.
💜 Nano History Will Pi Coin Reach $11?
If Pi breaks the $2 resistance with strong volume, experts predict a rally toward $11. Failure could lead to a drop below $1.5
💛 Is Binance Listing Pi Coin?
Binance has not officially listed Pi yet, but a recent community poll shows strong support, increasing the chances of a future listing.