$QQQ new uptrend$QQQ & $NASDAQ new uptrends to watch.
we are right at 50% fibonacci retracement from Covid low to Nov 2021 high.
This uptrend is now our guide. 9.30.22 low of 10,572 NASDAQ now a pivot point.
Pivot

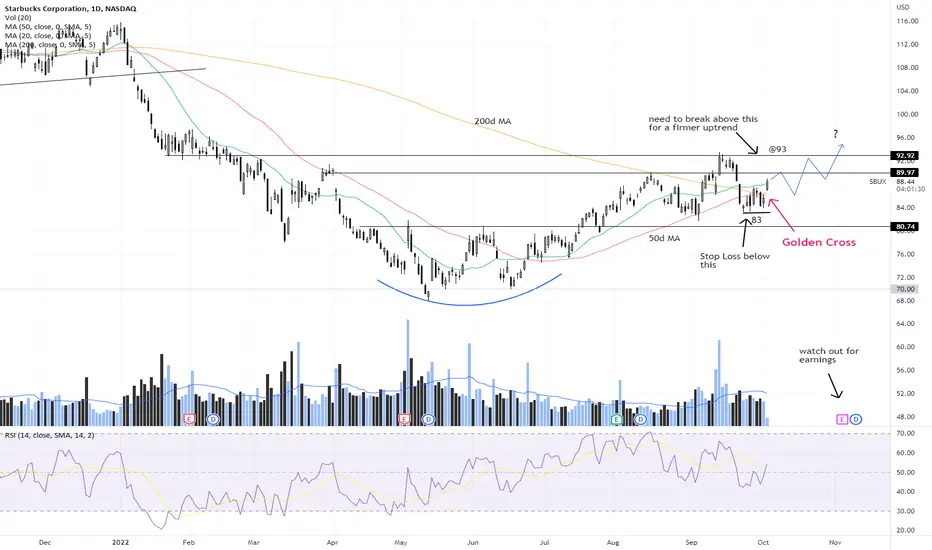
SBUX - Golden CrossSBUX just had a golden cross! (50day MA crossing above 200day MA). Could still be volatile as the 200day MA will take some time to flatten out and turn up. Stop loss should be about $1 below the recent pivot low of $83
Watch out for earnings nearer end of this month. Could be prudent to take some profits before earnings announcements.
Disclaimer: Just my 2 cents and not a trade advice. Kindly do your own due diligence and trade according to your own risk tolerance and don't forget that money management is important! Take care and Good Luck!
Nice support level with EURCHF on the 30m chartLooks like theres a nice support here which should see a reaction if tested soon. I will set a limit order if we see a nice pullback to this level. Let see what happens.
Happy Trading!

DXY ready for a pivot?In this video I explain why the chances are very present why we can expect a reversal in DXY and BTC. No financial advice, just my perspective on the markets!

True Market Leaders: #1 $FSLR👉Name is holding great through the market sell off
👉The RS line up is showing outstanding relative strength
👉Volume indicator we see a bunch of green and blue (bullish) bars highlighted and not much red and purple (bearish).
👉 Stage 2 indicator is showing early turn and key MAs are starting to point up
Not at a buy point yet but definitely a great candidate to watch!

Double bottom 6h The NQ momentum looks to be slowing to the down side. I don't have a crystal ball so take it with a grain of salt. With the Money flow being really low on the 6h chart, the macd making a cross to the upside, I'm calling a long here or a lil lower after today's session to see where it lands. Small size maybe even micro. Stop is pretty obvious with prior low. If prior low breaks we go lower. If it holds we are bouncing. Double bottom here could be a bigger bounce. I know a lot of bears will try to claw me to pieces but it's oversold. Sure it can go lower so I'm looking for confirmation on the long before I take it. Would like to see some big 30min bull bars and some fast action to the upside to confirm it. Just watching to see what it does. If the low breaks I'm joining the bears to ride it as low as it wants to go. Thanks for reading just an idea. Let's see what happens. Happy trading and good luck.

long term analyze for eurusdhello guys
as you see on chart, eurusd break down two important weakly and monthly pivot and price should touch next pivot that is zone between 0.90-0.82 and if you believe after breakdown price could move as much as range before so its proof that eurusd touch that area again, on the other hands, this pair stays on bearish channel so there is high possibility move downward.
thank you for your attention.
please write for me your opinion!

📉✌BTC Weekly & Daily Analysis✌📈BINANCE:BTCUSDT
COINBASE:BTCUSD
Hi traders, first look at my previous analysis and positions.
According to the volume profile indicator, the price is targeting lower levels in a bearish structure.
Price is anticipated to retest the $19,831 level now that it has been broken.
On a daily basis, it's anticipated that the price would drop down to the level of 19000 and not stay beyond that mark.
The $17,617 price level is the last significant support; it will be where Bitcoin's future lies.📉📈
Please share ideas and leave a comment,
let me know what you think.
CrazyS✌

Is SPX overbought?The key point of this analysis is the strong pivot level on $SPX around the price range of 4100-4150. This area has acted as support and resistance several times this year, which is confirmed by being the area with highest volume on a volume histogram for 50 days, and a volume histogram for 200 days.
Bearish Signals :
Since prices are coming from beneath, this pivot level is likely to act as a resistance level, preventing the S&P from rallying further up.
The 20-14 period regression channel indicator still gives a bearish signal for trend, and the S&P is trading below its SMA 300 (the thick red line)
My RMA indicator shows that there were two days when the stock was oversold recently
According to CBOE, on September 9th the SPX put/call ratio was 1.36, which means there's more puts than calls
Bullish Signals :
From a trend channel perspective, $SPX is currently following a descending broadening wedge pattern, which is generally seen as a bullish signal
There was recently strong momentum, with two gaps, so a breakout could happen out of the trend channel, which would be very bullish.
Overall, it seems more likely to me that this is a bull trap than a bear trap, which will move into a resistance level then reverse down, so I will continue shorting at the current price, but if the price continues to rally to above around 4170, then I will reverse my position into a long, as a breakout could easily pop towards the upside given the strong short term momentum.


AUDCAD Target Price 0.896AUDCAD currency pair is moving as expected. Expect AUDCAD price to increase.

D O G E These are levels that I'll be keeping an eye on when dealing with $DOGE, and I'll revise as price action progresses.
I adapt to the change in money flow.
I can honestly see this crypto going down to $0.01 or less. The rally this P.A. experienced looks parabolic to me, I'm not surprised by the heavy bearish pressure but it's not looking good right now in my opinion.
Since Bitcoin is the needle when it comes to crypto I wouldn't pay that much attention to anything other than BTC. However, I'm publishing this idea to see exactly how it plays out as price action forms.
Any questions feel free to ask! 🙂


Goal: 3342.2 Units (EURZAR)EURZAR Target Price 17.731. Pin Bar tail protrudes through a previous pivot point at price 17.327.

GBPNOK Bull Market (September 14th 2022) Wait for a close above 11.6900 in considering a long position. Candlestick must close above 11.6900 in order to consider a long position.
Market conditions currently look good for a potential move upwards. Higher low formed at time mark 19:00 on 1H Time Frame.

Pivot Point Entry Idea For Future Trades Enter at Pivot Point, 50% Retracement. Enter any value between 38% and 50% Retracement.


Entry Price 18.36680 Target Price 18.46900 (EURTRY)Expect price to increase 1322.0 units for currency market EURTRY.


GBPUSD Weekly Analysis (12th to 16th Sep. 2022)From the weekly pivot, if price continue to move up, I'll place a short position at R1 (1.1691). I'll only consider a buy if price drops to S1 (1.1448). Placing a buy will be confirmed based on the daily pivot during the week. Good luck 🤞🏾.
