13 important things to know before trading PayPalHi folks, Yurii Domaranskyi here. Let's take a look at the chart.
1. levels are working great here
2. globally uptrend, locally downtrend
3. the level was confirmed with 2 false breakdowns
4. distant test
5. approaching with paranormal bars
6. from top to the bottom -27.84%
7. no accumulation near the level so far, approaching with paranormal bars
8. no rollback
9. closed in more than 1 ATR distance
10. level of a pullback + paranormal bar
from that point was made move to the other side of the range
11. has enough room for a move 1 to 5.1
12. no model ascending lows
13. report on November 13
Potential risk/reward ratio = 1 to 5.1 meaning that I'm risking a 100$ with a possibility to make 510$
Please, support our work with ❤️
Pivot

EURUSD could target 1.16000 as a consolidation move! There is no doubt that EURUSD is trending lower, however it is completely in an oversold territory as the 4H RSI is indicating bullish divergence. Therefore this pair can be said to be in a consolidation phase. For this trade criteria to be met, the trendline needs to breached, after which the weekly pivots should be evaluated and a long trade can be placed depending on the RR. This might occur this week or next week. The initial target for this pair would be 1.16000 area (present of another descending trendline). However shall this target HIT, we can expect this pair to resume its downtrend towards the monthly psychological support of 1.15000.
Shall there be any updates regarding trade entry, i will post them in this thread.

Crude Palm Oil (FCPO)-Simple Wave CountToday is 11 October 2021. It's not even half of the month yet but price of FCPO has reached Monthly R2 (Traditional Pivot). That indicates the price is already overstretched. I believed the price should retrace. Furthermore, The bearish divergence does support the wave count that price already topped for wave 3 base on Elliott Wave count. Further confirmation is needed i.e. must break down the trendline and successfully retest it and continue the short-term downtrend.
FCPO is in a very bullish mode so I don't expect the price to retrace way below the Monthly R1 at 4785. Moreover, there is Weekly Pivot at 4811 to act as the first strong support that might be the catalyst for buyers to jump in the rally again.
The target for wave v is base on 1:1 ratio with wave i. It could go higher or lower than that.

USDCHF Might aim for S1 Monthly PIVOT shall the Trendline break!USDCHF might aim for S1 monthly support shall the ascending trendline break. For this criteria to meet, we need to see the daily candle pierce both the trendline and D EMA in the process. After this what is required is to assess the RR for this trade, if feasible we can enter a SHORT to target the S1 monthly pivot. The S1 Monthly pivot is also present in the same area with another ascending trendline. Due to this, i strongly feel that the price might go down until those level.
Shall there be any updates i will update the entry criteria below in this thread

AUDUSD might aim towards 0.700 support shall the trendline breakThe path of least resistance towards 0.7000 psychological support is open for AUDUSD to test, provided that the trendline breaks. Shall the trendline break, the daily candle also needs to pierce and close below S1 monthly support. Once this happens the price will likely target S2 support that lies just below 0.70000 support.
Shall the criteria take place, it would be good to exit the trade at 0.7000 psychological support rather than S2 support. Await updates in the comment section

TRICKY USDJPY SHORT MIGHT BE A TRAP! TRADE WITH CONFIRMATION!
Take a look at the above image of USDJPY daily TF chart. Its clearly visible that there many hurdles that USDJPY needs to clear before aiming low. In this case, the main chart that shows USDJPY 4H, shows that once the trendline breaks it will likely aim low. Due to this many traders might get trapped should they SHORT USDJPY once this trendline breaks. As a probable consequence, the price might likely start to reverse against their trade and head back up.
A CONSERVATIVE AND PATIENT approach would be to look at the bigger picture and scan for any hurdles that might cause the price to limit its downmove. in this case, scanning the daily chart (have a look at the attached image up). On this chart there lies a Monthly pivot and just below it lies the daily EMA. these two factors have been proven to be a strong support. To trade this setup with confirmation would be to wait for the DAILY candle to pierce and close below D EMA and Monthly pivot. Once this happens a short trade can be taken on 4H charts depending on the weekly pivots. The target which would likely be tested would the area near 110.000 region.
Shall there be any updates, i will post the entry requirements below

Retracement to 1.16500 required before SHORT entry! Target: 1.15EURUSD is currently in downtrend! However 1.15000 acts as a strong monthly support. So based on the monthly pivot points its best to wait for slight retracement to 1.165000 area for better risk to reward ratio. Monthly EMA was also pierced and candle closed below it, this further eliminates the hurdle of monthly support and opens the path to 1.15000 area.
i shall update the trade criteria once and if the price retarces for a better 1:1 RR.

EURUSD might fall towards swing low if rejection occurs at 1.165This week might provide a slight correction from last's week aggressive down move in EURUSD. As the downmove happened last week, the monthly EMA was pierced and M candle closed below it. This indicates the path towards 1.1500 is well and truly open to be tested.
Here we currently look at the 4H chart for this pair. a possible head and shoulders developing on 1H TF might result in a slight retracement towards 1.16500 level and 4H EMA. Shall the retracement be completed, it is advisable to look for rejection of the 4H EMA which can be confirmed by the TRENDLINE break. Shall the rejection take place, we can expect the price to target the swing low on 4H charts. However it also depends on where the weekly pivot points are present.
Shall all the criteria meet, i will update the trade details here

Possible pivot breakPossible pivot break with two inside days. I like the low volume in the last days. only break will be a valid signal.

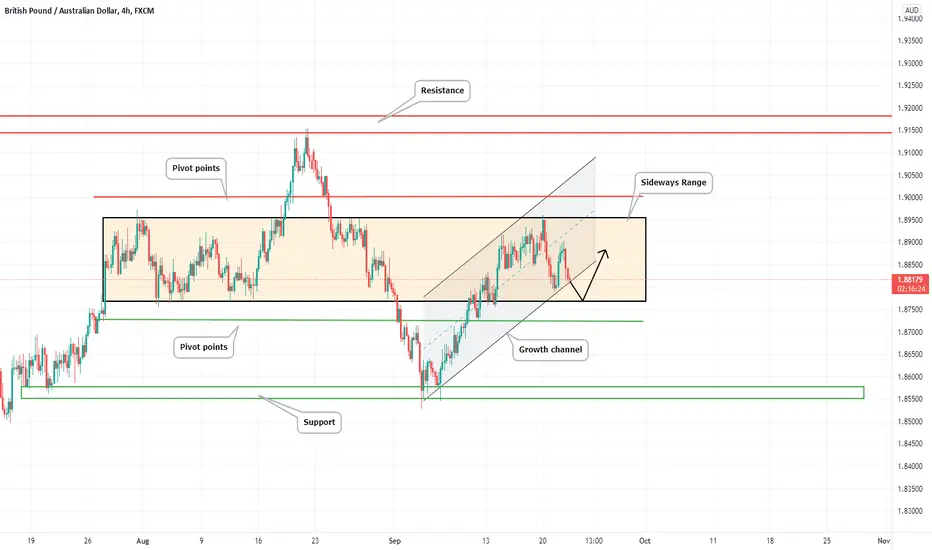
GBPAUD 📉Decline to pivot points⚡As of today, ltrym has been trading sideways since July 27th. During this time, clear boundaries and control points of support were formed. Further price movement - when the sideways range is broken, I expect a descent to the pivot point and back into the range - a false exit. We are also now at the lower boundary of the local ascending channel. If we break it, then we go down to the border of the range and push off from it. The second idea has more chances of implementation, since the sideline is quite old, which means its boundaries are quite strong.
Have a nice trade!
BTCUSD - H1 - LEVELS TO WATCH : 43'230 AND 41'900Looking at the intraday H1 time frames, there are two levels to look at very carefully , which are :
UPSIDE : 43'230
DOWNSIDE : 41'913
Indeed, a breakout confirmed of one of those levels will show the direction for the upcoming trading hours.
Good luck
Ironman8848

Is another ALTSEASON happening?The Altcoin index forms a triangle inside an uptrend channel and two scenarios can be predicted for it:
1. Break the triangle up when AltSeason starts which I hope will happen. Of course, for this to happen, it has to go through a weekly pivot resistance.
2. Failure from the bottom that we should see a deep correction in Altcoins. The failure line is accompanied by a break of the uptrend channel and has the support of Komu cloud and weekly pivot and an MA200D, so I do not expect a quick price correction.
Which do you think is more likely?

ETH DAILY CHART WITH PP AND SUPPORT AND RESISTANCES!Hey everyone, here is a daily ETH chart with pivot points and support and resistances to look out for!
Be safe and make good trading decisions!
much love
nick

EURUSD MIGHT TARGET 1.1800 THIS WEEK IF TRENDLINE & EMA BREAKSDepending on the new weekly pivot points, shall the trendline break the price will likely target 1.1800 region. Shall this happen, then it would likely be just a consolidation move before the downtrend resumes again.
Shall the criteria meet, i will put the details of entry in the comment section.

GBPUSD Let's Go On Yes After a Long Time I'm back And my First Analysis is going To Be on GBP God this currency Is Like an unControlable Hourse
Let me Tell You a trick Which I Always Use in Hard Times and that's Using UK100 and USDCHF so the secret revealed and now I think you KNow how to use it but AlWAYS pay attention to News and consider Differences Between Stock And Currencies (for example in this case UK100 started upward trend sooner than GBP) Which I definitely Will Talk about it

EURUSD 4hr LONGEURUSD bears are looking tired. They've stalled at the outer pivot support level of 61. They've failed to make a new low and the bulls look to be entering the market.

PLTR could see a big move !!!PLTR setting up for an interesting move. 22.68 is a big pivot point if it breaks this we can see a run back up to 27.

ETH, The decision is upon usHe had a wonderful couple of days in crypto world. If you look up to the 2Daily chart you see nothing but green and we are nearing danger-zone where pivot is seriously possible. Upon breaking through and retesting, this will obviously be a bullish sign which would need extra time and energy to double check some alts charts in relation to ETH, BTC.D and BTC/ETH. Upon rejection we are looking 2 highlighted areas for possible local pivots, but I lean towards retesting the lows (2k area). We will see how it develops.
My bias is to the downside, and upon getting that scenario, we will have to be extremely patient to find new entry points for macro way up, which is ahead of us (in possibly not so short term future).
FYI: 21 and 35 EMA in red and blue, 200 EMA yellow.
Have a nice day folks.

BTC bitcoin weekly pivot setuppossible to play this is rejection. or loss of the H3 level. target is purple line or L3. stop loss at the H4

SBIN - Triangle BreakoutSBIN Buy above high
Triangle Breakout coupled with volume
Pivot Breakout Coupled with volume
RSI Brokeout
Target between 5% to 8%

a simple bearish trend based trade ideai believe downward momentum will continue on this pair, possibly for quite some time as the trend is relatively new. i used the pivot levels, and the previous low to determine my take profit 1 and 2, as i split my lot sizes in half to have two entries. i entend to close one of the lots at tp1 and move the other to entry at the same time. Tell me what you think!

GBPJPY Pivot July 18thPrice is still making its way down back to bottom of daily pennant / trend line. Where S1 and S2 is marked.
Marked are possible pivot and small trend line areas of possible support and resistance.

GBPJPY PivotPossible Pivot areas marked using pivot traditional indicator (15 min for intraday pivot levels).
4H has buying pressure and currently forming a W. If pattern holds looking for 152.600.
If price continues down looking for strong rejection from one of the support levels near the bottom of the daily pennant.
