Pivot

BTCUSD 28K region targetPrice is reproducing the same pattern as previous week following the ATH.
If it completes the pattern, it could lead to 28K which will form a new Lower Low and definitively confirm the bearish trend and bull run end.

BTC bitcoin. Help for hodlers moonboys & doomboysIts called a range. If you wanna trade a breakout move you have to wait it out or find a way to profit off a range.
These are camarilla pivots. your range is clearly show and your targets.
How to use this info? If you want to long or short a range reversal at H/L3 target the 3 on other side and beyond. stoploss at the H/L4 just above or below your entry on rejection or loss of the 3.
If you wanna play a range break with a confirmation. wait for H/L4 to be broke on preferably a 3hour or more unless volume is nice. target is H/L 5-6 with your stoploss at the H/L3 on the side you took your trade in.
Good luck. Nothing confirmed until this step first taken. Enjoy.

2021.01 GOLD longterm viewGold LT view. Target 2800. Support 1811. Possible ways of correction to Fibo levels.

eth weekly and maybe daily correction pivot scalp shortcamarilla + cpr + magnet mean reversion to pivot. best entry is next H3. target is next Pivot/L3. waiting for the weekly close might also be wise

EUR ZAR (possible long entry - possible to be a VERY big trade)This is another easy and straight forward setup. This appears to be an Elliot wave 5 wave fractal pattern. It seems to me that we are probably in wave 4, though I do not think wave is finished yet. Wave 4 likes to finish near the top of wave 1. We should be in the ABC/complex correction of the minor waves. We are in a small uptrend that is actually a bear flag in the overall bigger picture. However, it seems we still have upside potential. I will be looking for price to breakout of the counter trend line, probably near the current support level, then ride the counter trend line down to the false break zone near the very bottom trend line. We have stronger support here, the top of wave 1, and an expected place for the bottom of wave 4 to rest. From here it is a long way up to the conservative take profit just before the top of wave 3. If wave 5 is not truncated we can expected a much much bigger move past wave 3 and off of the screen shot. Massive pips can be made off of this trade.

Very detailed direction forecastI put together this very detailed forecast based off chart pattern picked up on. I numbered my steps in detailing the chart to create a legitimate visualization for all to understand.
1. We see continuous rejection at 127.000 with an eventual high volume pivot.
2. We see continuous support at 126.000 keeping the trend within the straight channel between support and resistance.
3. Off the support pivot we see a break through 127.000 to be rejected at 127.500 creating new top resistance.
4. Off top resistant rejection we see a strong sell off that flew through 126.000 support with continuation. This sentiments true sell off loading up from 127.500 rejection.
5. I am watching for a market open pullback to create first weekly resistance. I sentiment this due to how far the RSI breached oversold. For continuation RSI will trade in and out of oversold zone.
6. First support retest is at 125.000 with a safe sell entry point below as long a breach and close out occurs on 1 hr.
7. A break and close out below 124.500 will create massive seller volume for a second sell entry to retest next major supports at 123.000 and 122.500. If momentum is strong enough a final retest will occur at 121.500.
Attached is my previous sell that had TP at 126.000 which smashed through hence my heavy sentiment for this trade. Any strong supports pivots at my first major supports may aim to channel resistance.
Please observe carefully following my steps and comment with any thoughts and ideas. Thank you.

GBP/JPY Signal - GBP Markit Construction PMI - 7 Jan 2021GBPJPY is trending to the upside this week prior to the GBP Markit Construction PMI, and we anticipate continued upside into this event. The data shows business conditions in the UK construction sector. Technically the pair is at the 50 moving average and above the 139.94 support level and we anticipate upside into the 141.210 level.

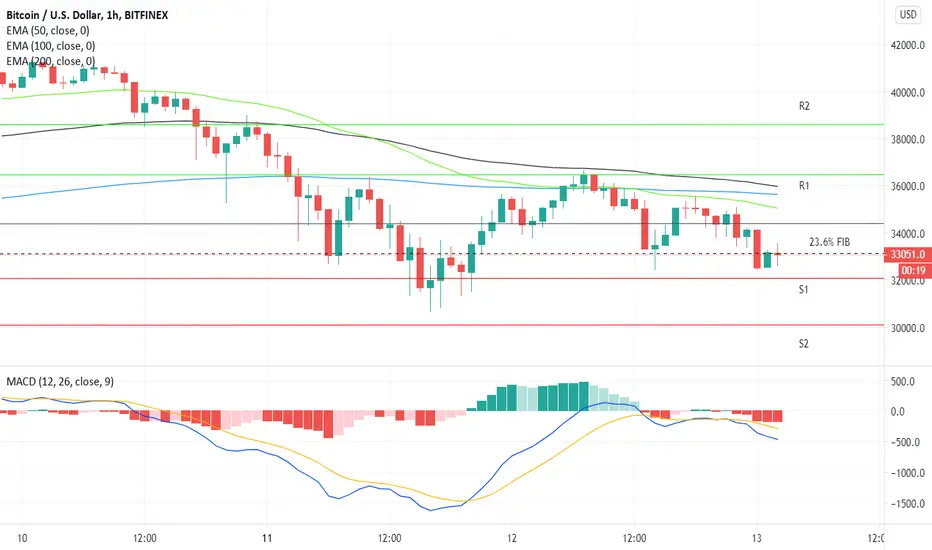
Bitcoin Daily Tech Analysis – January 13th, 2021It’s a bearish start to the day for Bitcoin, with the slide from last week’s all-time high $41,969 spooking investors.
Support and Resistance Levels
A move back through the 23.6% FIB of $33,008 and a move through the pivot level at $34,402 would support a run at the first major resistance level at $36,377.
Support from the broader market is going to be needed, however, for Bitcoin to breakout from $35,500 levels.
A break through the first major resistance level would bring the resistance at $40,000 into play.
The second major resistance level sits at $38,631.
Failure to move through the 23.6% FIB of $33,008 and the $34,402 pivot would leave the first major support level at $32,148 in play.
Barring a crypto meltdown, Bitcoin should avoid sub-$30,000 levels. The second major support level at $30,173 should limit the downside.
EMAs and MACD
Looking at the 50 EMA, a pullback from the 100 EMA and 200 EMA supports further downside ahead. The 100 EMA is also closing in on the 200 EMA this morning.
The MACD is also signaling a bearish trend ahead, with a widening of the bearish histograms supporting this morning's pullback.

NZDUSD Running nicely in profitOur NZDUSD Short is running nicely in profit! As covid cases in Australia increase the pacific currencies have taken a hit today.

Are there worms in the Apple? #stocksApple has been a great holding in the portfolio from 109 but has had some selling in recent days near range highs. For now I will remain long and will use 123 as my pivot area. As long as we hold above 123 I will be looking for continuation of the trend to the upside. Below 123 we could see a bigger reversal down into the range. Apple will obviously be closely tied to the SPY and QQQ which are having bad days but are above pivot support. For all, trends still point higher but as we approach key levels it is important to remain vigilant.

Sell and look for next buy entry (SWING)While the pair is finding rejection DXY found major support from bottom. I sentiment a short sell off to pivot off main supports I mapped out. Sell could be a short scalp with pivot off first support.
One could be safe and only enter a buy at the next support pivot. My overall sentiment is a push to 1.25000 high as it did in Jan 2018 as I have been preaching. At these levels we are psychological. Many traders are confused many COVID sentiment which is why it is important to have psychological level knowledge to your trading.
Study chart and wait for safe entry. Please comment with thoughts and ideas. Thank you.

Technical buy off supportThe pair is finding support at a previous pivot. MACD and signal have made a cross with RSI gradually exiting oversold zone. Volume for both currencies are high with CAD having slight edge.
TP as shown as chart. A MACD divergence may lead to support breach and SL to retest lower support.
Please comment with thoughts and ideas. Thank you.


fib pivot line macd can make money first i specify which direction the trend is going Ascending or descending Then looking for moving average for signal then looking for secret divergence and .....


EDUCATION: Pivot LevelsHello, dear subscribers!
Today we are going to talk about one of the most useful indicators in cryptotrading - pivot levels(points). We have already considered the lagging and leading indicators and decided that the second one is the most valuable.
Definition
Pivot levels is the leading indicator which define the potential pivot levels for the next trading period (in our example - month). The formulas for the levels calculation you can see on the picture. It is known that when the price is up of the central pivot - the market is in the uptrend, if the opposite - in the downtrend.
How to trade with pivot levels
It is great to use pivot level with some lagging indicator to confirm the entry points. This indicator can give the information about levels when the price can bounce off or reverse. You can see the points with small red arrows where the price bounced off pivot levels and went down after it - this points can be used for the short position. The green arrows demonstrate the potential price growth points. But there are also a lot of breakpoints (blue circles), to avoid the trade execution next to these point you need to use some confirmation with lagging indicator.
Summary
1)Define the trend direction
2)Open short if downtrend, long - if uptrend
3)Define the entry points next to pivots
4)Find the confirmation with some lagging indicator to avoid the pivot break points
5)Execute the trade, set the sloploss level
Good luck!

DDOG, Closed above 50MANASDAQ:DDOG closed above the 50MA and next pivot is 118.13. It has a good setup to give an approximate 16% profit.

How to use yearly pivotsYearly pivots are among my top favourite tools.
Nearly all the major reversals or rallies stop or turn at yearly pivots.
You can also use them as targets when you see price is heading or is close to yearly pivot. It will surely hit it.
You can observe it for yourself on this EURUSD chart.
When price is above yearly pivot target R1 if below target S1. Watch also Yearly Midpivots (they are also very important).
It is good to use long term moving averages along with yearly pivots to detect the long term trends.
To apply yearly pivots use - choose "pivot points standard" then choose yearly classic, set period to 2 last years, unclick R3 S3 as price rarely makes it those (unless it is a super volatile pair).
For mt4 you can download free indicator "yearly pivots".
Good Luck!

