#Oil buying opportunityHello dear traders and friends, I hope you are all having a great week. Let's take a look at Crude Oil prices, where it appears that the price has formed a support level around $80 to $82 after a 14% bearish move since the top formed in late September.
In the 4-hour timeframe, we can observe that the price has already shifted its bearish market structure to the upside by forming a new high. What's particularly noteworthy is that this high was formed from a higher low, indicating that sellers were unable to push prices any lower despite the prevailing bearish trend.
In the daily timeframe, things become even more interesting as the price has formed a significant bullish engulfing candle that has covered the last four daily candles. This suggests a high potential for upward movement. Additionally, in the 1-hour timeframe, we can see that the price is near a static support area, as indicated on the chart, and coincides with the daily central pivot area. This further supports the possibility of this area acting as a price low.
Apart from the technical aspects, we are also aware of the ongoing tensions in the Middle East between Israel and Hamas. The potential escalation of conflict and involvement of other countries can have a positive impact on oil prices.
Please also take a look at my other posted ideas which I'm sure you are going to like it and share your thoughts and feedback with me. Thank you.
Pivot

CHFJPY: Another profit?Hello traders,
Market were expecting a behavior change from BOJ, so Yen experienced a bullish correction in it's long-term declining route. Seemingly, markets were wrong! We have made profit by longing JPY but enough is enough! Let long against Japanese money again.

EXR to ~$124.84EXR is likely on it's way into the $120s if it passes the neighboring low. You already would have been able to get into the trade 3x and now have 6 lots left risk free for a run to the final d-target.
Smashing through $124.84 would indicate more weakness ahead for the REIT.

BTCUSD: Buy it after a confirmed break over 28500$Hello Traders,
Loot at the latest candles! Stronger bullish days and weaker corrections. There is a bullish momentum in the market! But some strong resistances are n the way! bearish channel and strong resistance do matter!
A break over 28500 is a long chance, alternatively, a break below the trendline is a short chance!

GBPUSD: Let's make some shorter term profit!Hello traders,
While we are longing GBP, A shorter term short is available!
1st scenario: Breaking the trend line will provide us a short option!
2nd scenario: breaking over 1.2280 will provide us a long option!
Have fun and trade safe.

NZDUSD Both scenarios explained.Hello traders,
Before opening a long order make sure 0.6050 is broken up, in lower timeframes.
Cluster of 4 things including but not limited to monthly pivot, middle of bearish channel, trendline and strong support could be a perfect entry point!
Alternatively, a short option is available around 0.6101.

EURJPY: Now and then!Hello traders,
You can enter now or wait for a broken trend line. We we'll enter at both levels with lower volume.
Money management is essential!

EIHOTEL - INVEST & HOLD FOR 2 MONTHSEntry Level : 222
SL : 202
Targets : 242,256,273+
52wk High : 274.95
52wk Low : 150.35
Mkt Cap : 139.49 B
Disclaimer - All information on this page is for educational purposes only,
we are not SEBI Registered, Please consult a SEBI registered financial advisor for your financial matters before investing And taking any decision. We are not responsible for any profit/loss you made.
Request your support and engagement by liking and commenting & follow to provide encouragement
HAPPY TRADING 👍

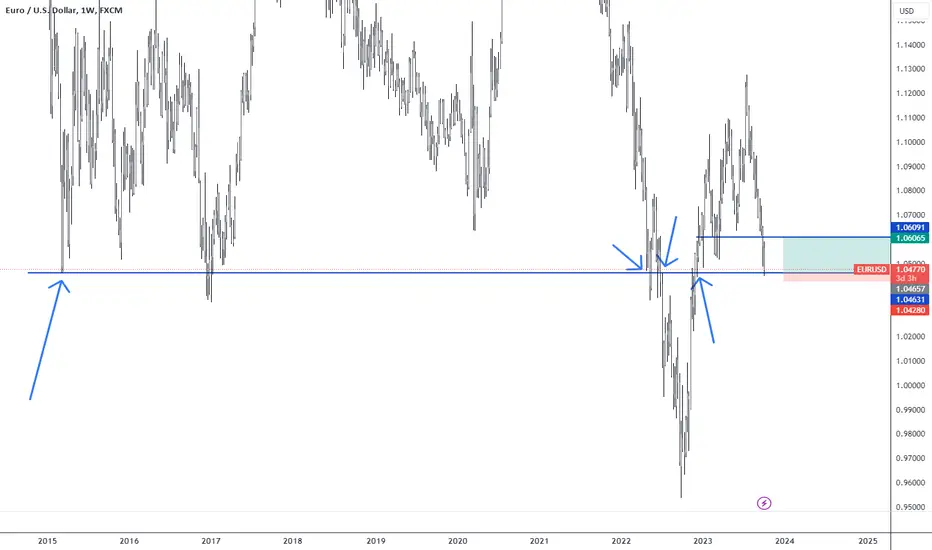
I think is done fallingPair just hit and important pivot point. I don't see great price action yet but I'm taking the trade. I opened a long at the blue line 1.04631 but still a good entry now. My SL is very tight and it triggers if a daily candles closes under it.
Btcusdt ,,, Break the trend line My hypothetical trend line and triangle are broken, the future is nothing but a repeat of the past, I expect Bitcoin to grow up to 35 and 40

CHFJPY: When was the last time we short against JPY?
Hello traders,
There is one entry and 2 TPs for this pair.
Levels calculated order_block, regarding support and resistances, channel and pivot points.

EURUSD: 125 pips is waiting for us!Hello dear traders,
Our last EURUSD was profitable, almost the same opportunity here!
Enter after a confirmed breakout below 1.0480
Close 20% of profits around 1.0420
close all between 1.0370 and 1.0350
Levels calculated order_block, regarding support and resistances, channel and pivot points.

GOLD will keep falling!!anticipating a rise into the supply zone or around 1858.34 level before selling down, i am expecting GOLD to hit the target 1828.19 or or goes dip below 1805.34 demand zone

Short-term Buy | GBPUSD Pin rejection on demand zoneGBPUSD hits demand with pin rejection after taking liquidity at 1.21917 i am expecting a short-term buy considering the daily engulfing candle below
to a target 1.22350 zone

CADJPY: The Alternative scenario!Hello traders,
This is our alternative scenario that might be activated in near future.
There are 2 entries and 1 TP for this pair.
Levels calculated order_block, regarding support and resistances, channel and pivot points.

NZDUSD: Can we make profit again?
Hello traders,
There is one entry and three TPs for this pair.
Levels calculated order_block, regarding support and resistances, channel and pivot points.
WAIT FOR UPDATES!

GBPCHF: No short over 1.1050 (would have updates)Hello traders,
We don't long before breaks of trendline and we don't short over 1.1050
Wait for setups after the break! In this post, updates would be included.
Levels calculated order_block, regarding support and resistances, channel and pivot points.

AUDCAD will fall!Hello traders,
Our previous AUDCAD analysis has been expired!
We are going to open opposite direction trade by opening this one.
There is 1 entry and 2 TPs for this pair.
Levels calculated order_block, regarding support and resistances, channel and pivot points.

BANK NIFTY INTRADAY FOR 22/09/2023BUY ABOVE - 44850
SL - 44730
TARGETS - 45070,45240,45470
SELL BELOW - 44600
SL - 44740
TARGETS - 44420,44250,44100
NO TRADE ZONE - 45280 to 45470
Previous Day High - 45710
Previous Day Low - 46280
I am sharing BANK NIFTY levels this levels acts as important support & resistance for intraday. if you want to trade with this levels wait for 15 min Candle closing above that levels. You can trade with breakout and reversal both.
In this channel, I share my expertise in trading strategies, technical analysis, and market trends to help you make informed decisions in your trading ventures.
Stay tuned for daily updates, in-depth market analyses, and real-time trading scenarios to witness firsthand how we transform from Zero to Hero in the trading world. My Only aim is to empower you with the knowledge and skills necessary to navigate the complexities of the financial markets successfully.
Based on price action major support & resistance's are here, the red lines acts as resistances, the green lines acts as supports. If the price breaks the support/resistance, it will move to the next support/resistance line. White lines indicates previous day high & low, high acts as a resistance & low acts as a support for next day.
Trendlines are also significant to price action. If the price is above/below the trendlines, can expect an UP/DOWN with aggressive move.
Please NOTE: this levels are for intraday trading only.
Disclaimer - All information on this page is for educational purposes only,
we are not SEBI Registered, Please consult a SEBI registered financial advisor for your financial matters before investing And taking any decision. We are not responsible for any profit/loss you made.
Request your support and engagement by liking and commenting & follow to provide encouragement
HAPPY TRADING 👍

NZDUSD: KIWI is oversold and will riseHello traders,
Long-term bearish channel bottom line is a sign of oversold
The bearish trend-line is broken
There is one entry and three TPs for this pair.
New Zealand GDP announcement could effect the markets bias.
Levels calculated order_block, regarding support and resistances, channel and pivot points.

AUDUSD: Aussie is risingHello traders,
I'm really sorry for the delay! please accept my apologize.
There is one entry and 2 TPs for AUDUSD.
We'll see a continuation.
Levels calculated order_block, regarding support and resistances, channel and pivot points.

USDJPY: Could be the latest bullish move.Hello traders,
This might be the Elliot 5th wave! It's just a guess! If you are a Wave trader would you please share your idea with us?
You can also find bearish divergences, but I think regarding the RtoR this the trade \does worth the risk.

CADJPY: Oil is moving the pair.Hello traders,
There is one entry and 2 TPs for this pair.
There is also an alternative short scenario which will be publish if it's goin to be valid.
Levels calculated order_block, regarding support and resistances, channel and pivot points.
