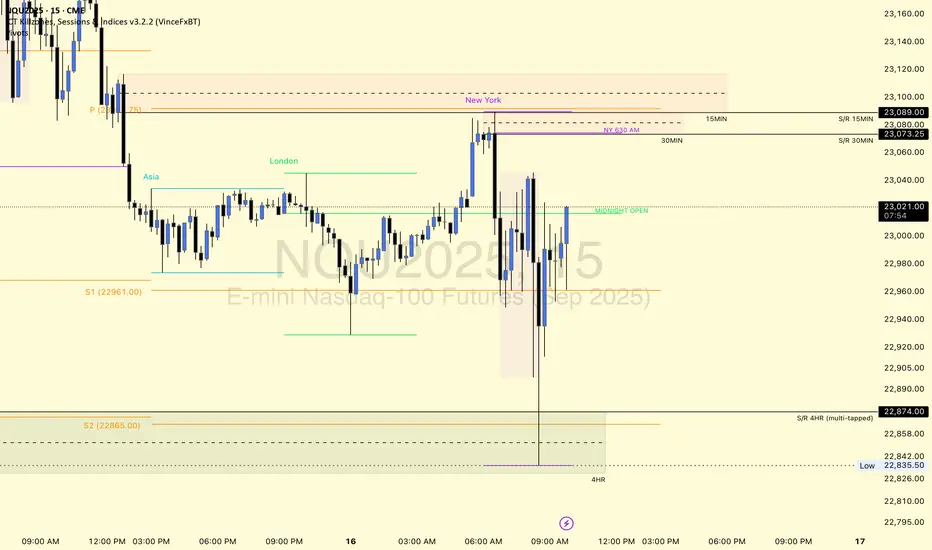
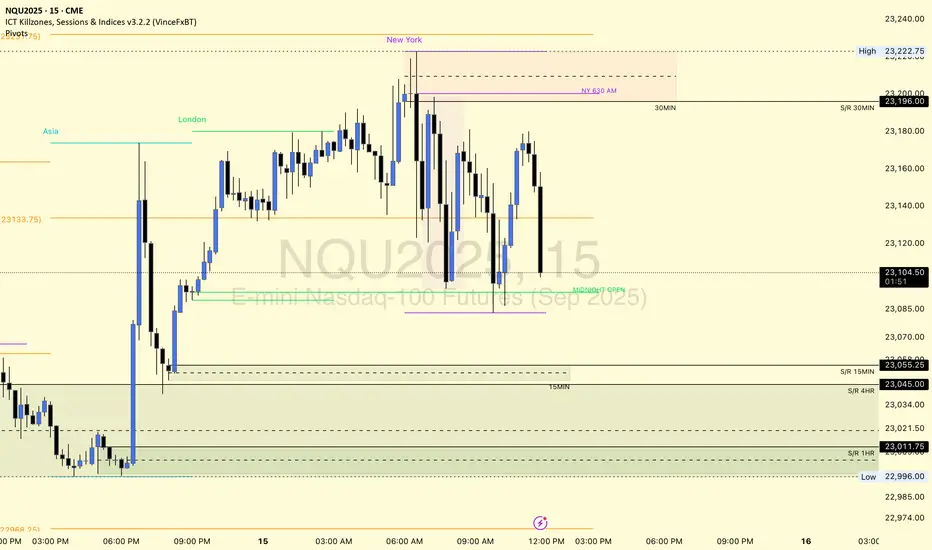
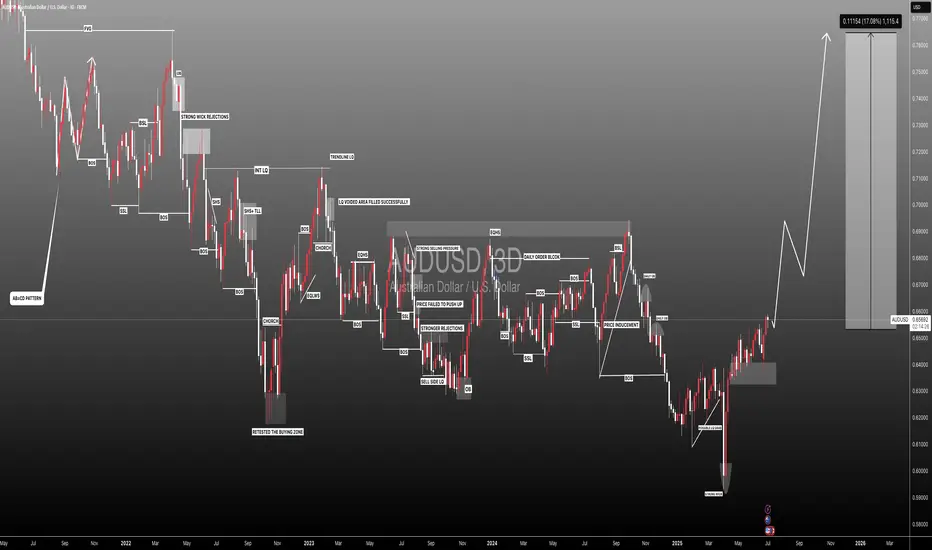
$NQ Supply and Demand Zones 7/16/25This is for SEED_ALEXDRAYM_SHORTINTEREST2:NQ chart specifically.
Posting for the YouTube fam and to hold myself accountable.
We broke through many demand zones after failing to break newer highs and the 2 news releases.
Pivot Points
Nifty Analysis EOD – July 16, 2025 – Wednesday🟢 Nifty Analysis EOD – July 16, 2025 – Wednesday 🔴
"Bounce Back with Caution: Bulls Show Up, But Still Not in Full Control"
Nifty started the day on a flat note, but the opening candle turned out to be the day’s high, and from there, it quickly lost 91 points, marking the day’s low at 25,121 within the first hour. The early pressure gave a bearish opening tone, but bulls gradually stepped in.
Around 11:45 AM, Nifty broke above the VWAP–Day Low range, crossed the CPR zone, and then pushed toward PDH. It did make one attempt to break PDH, but failed, resulting in a slow drift downward toward VWAP and CPR into the close. The day ended at 25,212.05, nearly at CPR — a zone of indecision.
📉 The structure shows sharp reversal from the lows, but also clear hesitation near resistance zones. The session was volatile, forming a typical pre-expiry pattern with mixed sentiment. Bulls must take charge tomorrow by crossing the 25,250–25,260 zone to regain strength.
🕯 5 Min Time Frame Chart with Intraday Levels
🕯 Daily Time Frame Chart with Intraday Levels
🕯 Daily Candle Breakdown
Open: 25,196.60
High: 25,255.30
Low: 25,121.05
Close: 25,212.05
Change: +16.25 (+0.06%)
📊 Candle Structure Breakdown
Real Body: 15.45 points → small green body
Upper Wick: 43.25 points
Lower Wick: 75.55 points → significant downside recovery
🔍 Interpretation
Market opened flat, dropped quickly to test 25,120 zone
Strong buying emerged after initial fall
Buyers lifted the index above CPR, but failed to hold breakout above PDH
Candle closes with long lower wick → buyers defended dip, but lacked closing dominance
🕯 Candle TypeSpinning Top with Long Lower Wick — often a neutral to mildly bullish candle, suggesting buying interest at lower levels, but with uncertain momentum.
📌 Key Insight
Bulls clearly defended the 25,120–25,125 support zone
Momentum will only resume above 25,250–25,260, leading to targets around 25,300–25,315
Failure to hold 25,120 could reopen downside toward 25,000–25,050
🛡 5 Min Intraday Chart
⚔️ Gladiator Strategy Update
ATR: 180.99
IB Range: 91.20 → Medium IB
Market Structure: 🟡 Balanced
Trades Triggered
11:34 AM – Long Trade → ✅ Target Achieved, Trailed SL Hit (R:R 1:2.42)
📌 Support & Resistance Zones
Resistance Levels
25,168
25,180 ~ 25,212
25,260
25,295 ~ 25,315
Support Levels
25,125
25,080 ~ 25,060
25,000 ~ 24,980
24,965
💭 Final Thoughts
“Structure is forming — but conviction is lacking. Let expiry day bring clarity. Above 25,260 we fly, below 25,120 we fall.”
✏️ Disclaimer
This is just my personal viewpoint. Always consult your financial advisor before taking any action.

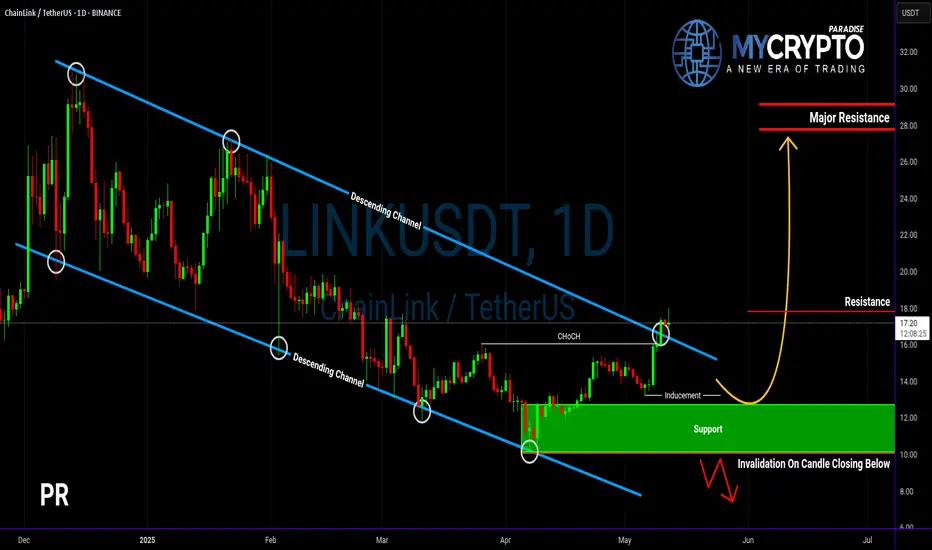
Will LINKUSDT Explode Soon — or Collapse Into a Trap?Yello Paradisers, are you prepared for the next big LINK move? The breakout you’ve been waiting for just happened — but before you jump in, let’s break down what’s really going on behind the chart.
💎LINKUSDT has officially broken out of its descending channel — a significant structural shift that immediately increases the probability of a bullish continuation. On top of that, we’ve seen a bullish CHoCH (Change of Character), a powerful sign that demand is stepping in. These are early but critical signs that bulls may be regaining control.
💎However, experienced traders know not to act on the first sign of strength alone. We now need to see how price behaves on the pullback. If LINK pulls back and takes out the inducement (removing weak hands), we’ll be looking for a bullish internal CHoCH (I-CHoCH) on the 1H timeframe. If that forms, the probability of a solid bounce from the support zone becomes extremely high — giving us the confirmation we need to position for upside.
💎On the other hand, if price breaks down and closes a candle below the support zone, this entire bullish setup becomes invalid. In that case, it would be wise to remain patient and wait for better, more reliable price action to develop before making any move. This is exactly where most traders lose by forcing trades instead of waiting for clear signals.
🎖A big liquidation event, which will first take both longs and shorts and fully get rid of all inexperienced traders before the real move happens, is very close to happening again. so make sure you are playing it safe Paradisers. It will be a huge money-maker for some and a total disaster again for the majority.
MyCryptoParadise
iFeel the success🌴
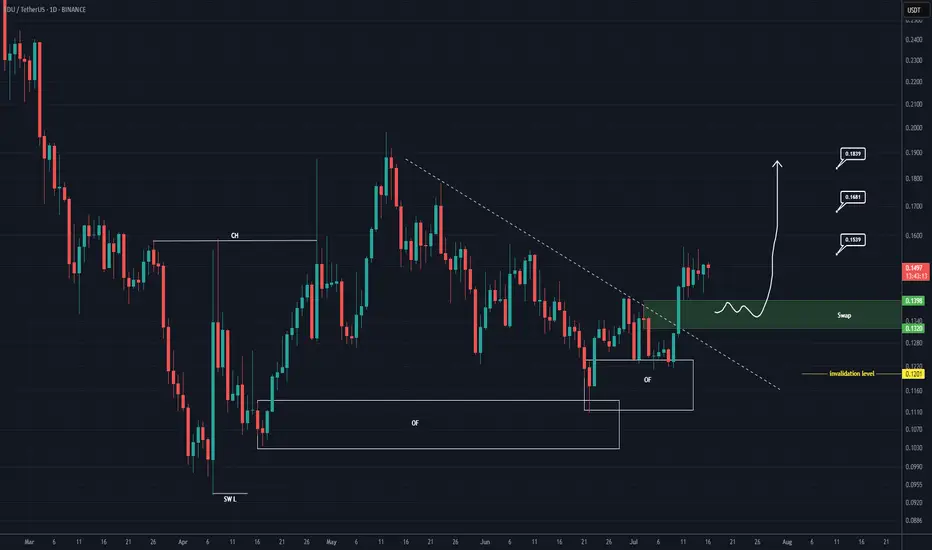
EDU Buy/Long Setup (1D)After forming a swing low, the price has created a bullish Change of Character (CH), and it has flowed well from the origin order blocks.
The trigger line has been broken, and the price has formed a SWAP zone.
Given the bullish signs on the chart, we can consider entering a buy position within the SWAP zone.
The targets are marked on the chart.
A daily candle closing below the invalidation level will invalidate this analysis.
For risk management, please don't forget stop loss and capital management
When we reach the first target, save some profit and then change the stop to entry
Comment if you have any questions
Thank You
US30 – Bearish Outlook Below 44,500 as CPI Looms US30 – Bearish Outlook Below 44,500 as CPI Looms
US30 rallied and successfully reached our resistance target, as expected in the previous analysis.
However, with today’s CPI release, the market is likely to see increased volatility. As long as the index trades below 44,500–44,570, the bias remains bearish, with downside targets at 44,210 and 43,960.
• If CPI prints below 2.6%, we may see a bullish breakout toward 45,100
• Above or equal to 2.6% supports continuation of the bearish move
However, we expect a 2.7% reading, driven by tariff-related price increases, which would support the bearish scenario.

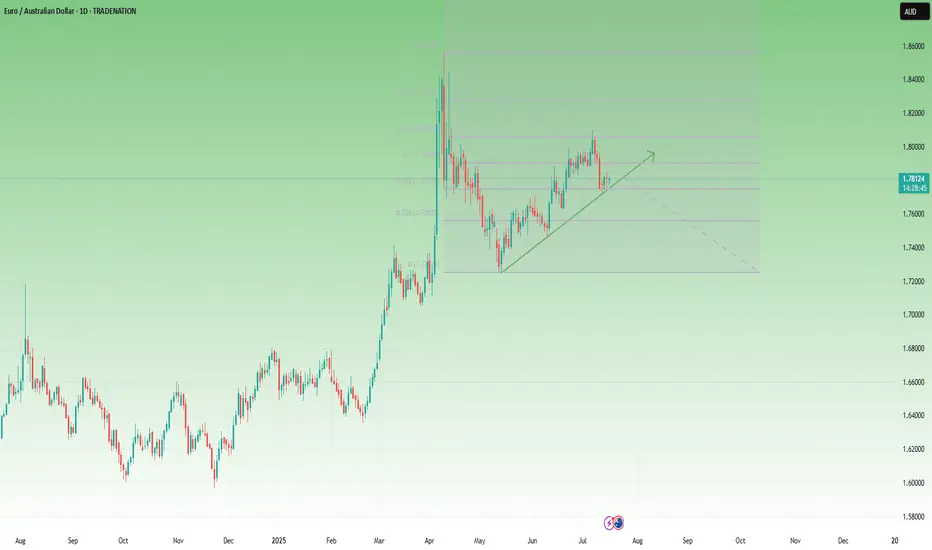
EURAUD Flag Forming Below 1.80 – Time to Sell the Rally?📈 The Big Picture
In mid-February, EURAUD exploded to the upside, gaining over 2000 pips in just two weeks. After peaking near 1.85, the pair corrected sharply, returning to more balanced levels around 1.72.
🕰️ What’s happened since?
The market has resumed its climb and just recently made a new local high at 1.81. On the surface, it looks like bulls are still in control – but a closer look reveals warning signs.
🔍 Key structure observations:
• The current rally appears to be a measured move, topping out near the 61.8% Fibonacci retracement of the previous drop
• Price structure is overlapping, suggesting weak momentum
• A large flag pattern is developing – typically bearish in this context
• The pair still trades above the ascending trendline, but a breakdown is looming
📍 Current price: 1.7805
🎯 Swing Trade Plan
From a swing trading perspective, I’m looking to sell rallies near the 1.80 zone, with:
• Negation: if the price breaks clearly above the recent high
• Target: the recent low around 1.7250 – where the last correction ended
________________________________________
📌 Conclusion:
EURAUD may have exhausted its bullish energy. The technical picture suggests we are in the late stage of the rally, with bearish patterns stacking up. Unless bulls manage a clean breakout above 1.80, this looks like a great place to position for a medium-term reversal. 🚀
Disclosure: I am part of TradeNation's Influencer program and receive a monthly fee for using their TradingView charts in my analyses and educational articles.
$NQ Supply and Demand Zones 7/15/25This for sharing my S/D zones for SEED_ALEXDRAYM_SHORTINTEREST2:NQ specifically.
Nifty Analysis EOD – July 15, 2025 – Tuesday🟢 Nifty Analysis EOD – July 15, 2025 – Tuesday 🔴
"Buyers Step Back with Conviction, Reclaim Lost Ground"
Nifty began the session with a flat-to-positive tone, and the first 5-minute candle confidently added 60 points, pushing the index toward 25,150 – aligning with the Previous Day High (PDH). However, the level couldn't hold on the first attempt and Nifty slipped back to the day's open. After a brief consolidation, bulls made a strong comeback.
The second push broke through the PDH, Day High, and the resistance zone of 25,180–25,212, and extended the move up to mark the day’s high at 25,245.20. Post that, the index hovered above the breakout zone and closed solidly at 25,195.80, showing strength and follow-through.
📈 The day’s structure was clean and directional — a healthy bounce and hold above critical levels, reinforcing the idea that buyers are regaining control after last week’s consolidation and weakness.
🕯 5 Min Time Frame Chart with Intraday Levels
🕯 Daily Time Frame Chart with Intraday Levels
🕯 Daily Candle Breakdown
Open: 25,089.50
High: 25,245.20
Low: 25,088.45
Close: 25,195.80
Change: +113.50 (+0.45%)
📊 Candle Structure Breakdown
Real Body: 106.30 points – strong green bullish body
Upper Wick: 49.40 points – profit-taking or resistance at highs
Lower Wick: 1.05 points – negligible dip from open
🔍 Interpretation
Opened flat and quickly built momentum.
Temporary pullback in first 15 minutes was bought into strongly.
Closed with a clean green body, showing clear intraday bullish intent.
Holding above the 25,180–25,212 zone is a big win for bulls.
🕯 Candle Type
Bullish Marubozu-like (strong green body with minimal lower wick) — shows conviction and potential start of a new upswing post recent chop.
📌 Key Insight
25,080–25,100 is now a key base and must be protected.
If Nifty can break and hold above 25,240–25,250, a move toward 25,295–25,315 looks likely.
Failure to hold above 25,180 would be first sign of hesitation.
🛡 5 Min Intraday Chart
⚔️ Gladiator Strategy Update
ATR: 186.18
IB Range: 67.35 → Medium IB
Market Structure: 🟢 Balanced
Trades Triggered
10:30 AM – Long Trade → ✅ Target Achieved, Trailed SL (R:R 1:2.48)
📌 Support & Resistance Zones
Resistance Levels
25,168
25,180 ~ 25,212
25,260
25,295 ~ 25,315
Support Levels
25,125
25,080 ~ 25,060
25,000 ~ 24,980
24,965
💭 Final Thoughts
"Trend is nothing without follow-through — today buyers showed up, but tomorrow they must push past 25,250 to prove it wasn't just a bounce."
✏️ Disclaimer
This is just my personal viewpoint. Always consult your financial advisor before taking any action.

buy jg from pivotgood RR buy from pivot
pre NY open
this is my trading strategy, trade on pivots point

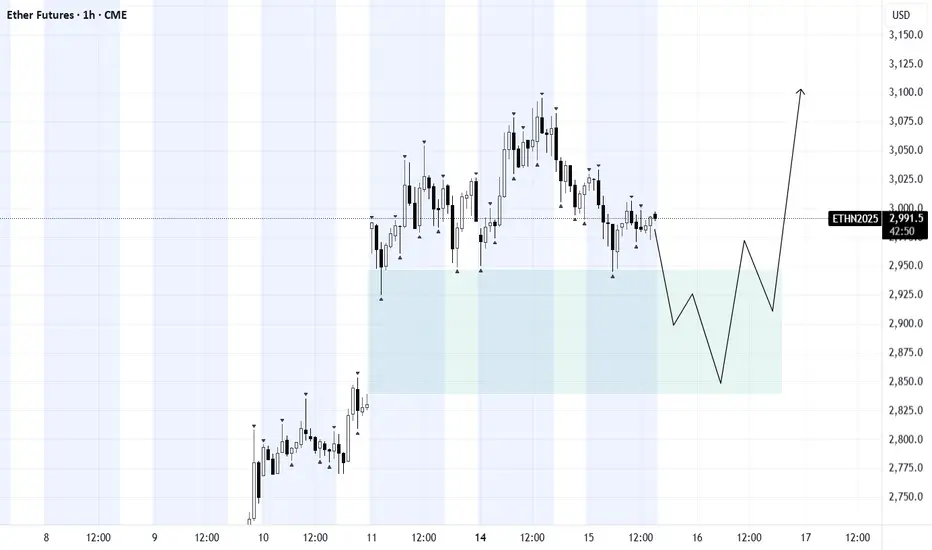
ETH/USDTETH is showing a similar structure to BTC, with a visible gap in play. A partial or full fill of the gap, followed by a bullish structure break on lower timeframes, would be a strong signal of buyer strength.
Waiting for confirmation before acting.
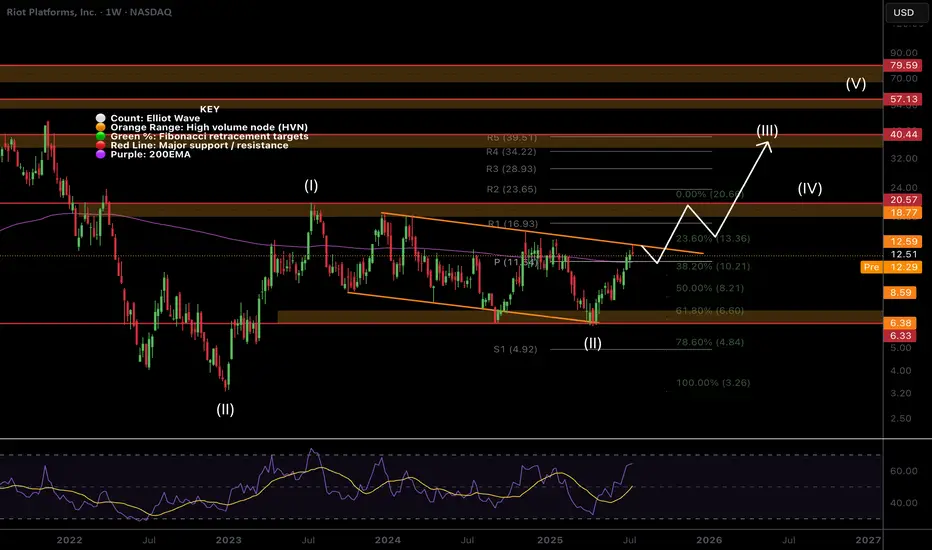
$RIOT Hit The Target Whats Next?NASDAQ:RIOT hit the descending orange resistance were I took partial take profits on my trade this week and it was immediately rejected as expected.
Price is now above the weekly pivot so that is the next support. This level also matches the weekly 200EMA.
Wave (II) hit the 'alt-coin' golden pocket of 0.618-0.786 Fibonacci retracement at the High Volume Node (HVN) support and descending support line which kicked off wave (III).
A breakout above the descending resistance line bring up the the next target of the HVN and previous swing high at $18-20 and $40 following a breakout above that.
Safe trading
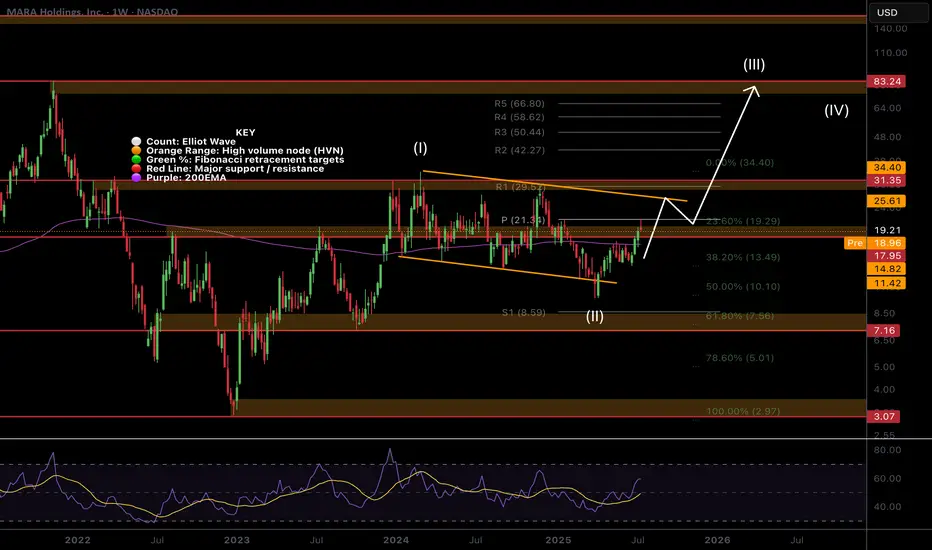
$MARA Hits the Weekly PivotNASDAQ:MARA path has been grinding higher clearing the High Volume Node (HVN) resistance where it is sat as support.
The weekly pivot rejected price perfectly so far but if the count is correct and Bitcoin doesn't dump I expect this continue strongly towards the descending orange line resistance as my partial take profit target.
Once that line is broken i am looking at terminal bull market targets of $80 but will of course take profit at key areas along the way.
Wave 2 swung below the descending support and recovered at 0.5 Fibonacci retracement potentially kicking off wave 3.
Safe trading
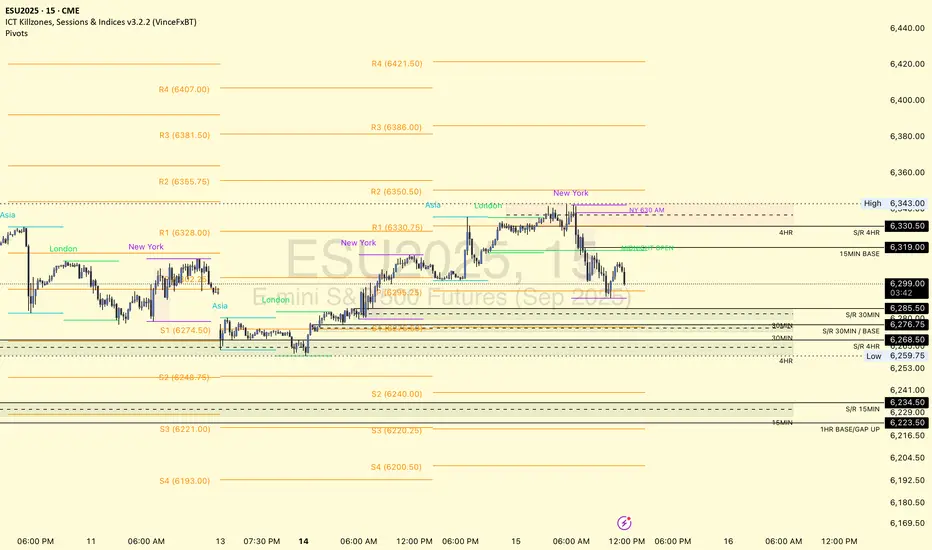
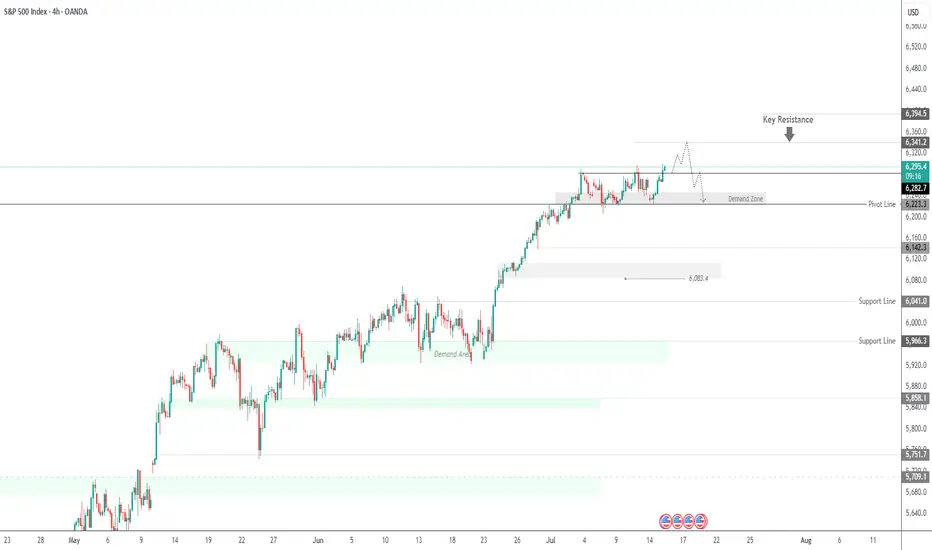
SPX500 Outlook – CPI Data in Focus, Key Pivot at 6282SPX500 – Market Outlook
U.S. futures are climbing as Nvidia plans to resume chip sales to China, fueling positive momentum across tech and growth sectors.
However, investor caution remains ahead of key events:
Major banks ( NYSE:JPM , NYSE:WFC Wells Fargo, NYSE:C Citigroup) will report earnings, offering insights into the financial sector.
All eyes are on the June CPI report, expected at 2.6%. A higher reading could reinforce bearish pressure, while a softer print would support continued bullish momentum.
Technical Outlook:
SPX500 has bounced from the demand zone and is now trading above the pivot at 6282, which keeps the bullish trend in play.
As long as the price holds above this level, we expect continuation toward 6341, and if broken, extended upside toward 6394.
To shift bearish, price must break and close below 6223, which would open the path toward 6142.
Pivot: 6282
Resistance: 6341 – 6394
Support: 6225 – 6191 – 6142
Event Watch : CPI data release today – anything above 2.6% may trigger downside; below 2.6% could support further upside.
Previous idea:
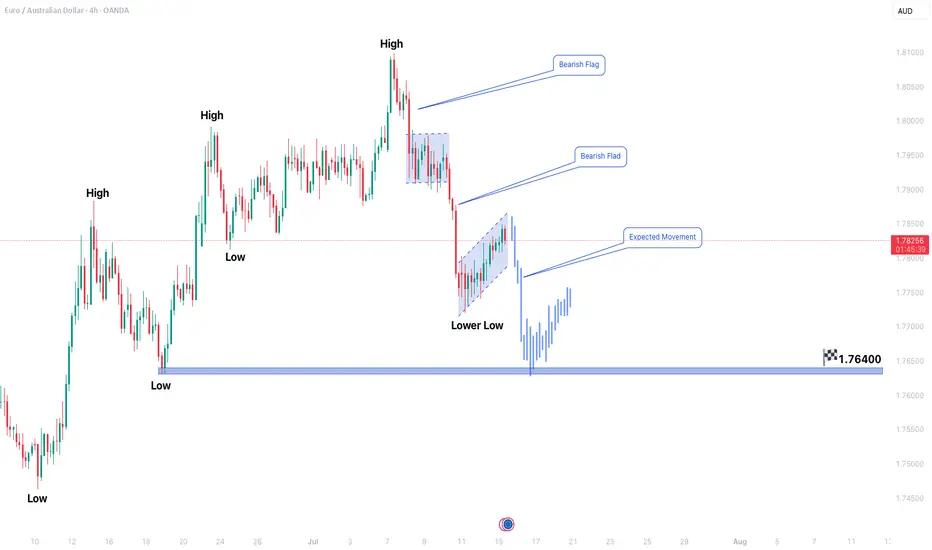
EURAUD FORMING BEARISH FLAG PATTERN IN 4H TIME FRAMEEURAUD Bearish Flag Pattern Suggests Further Downside Ahead
The EURAUD pair is currently exhibiting a bearish flag pattern on the 4-hour chart, indicating a potential continuation of the downtrend. Price action remains confined within a secondary corrective phase, but the primary bearish trend is expected to resume soon. Traders should watch for another bearish flag formation in the upcoming sessions, reinforcing the likelihood of further declines.
Key Observations:
1. Bearish Trend Structure: The pair has been moving in a clear downtrend, with lower highs and lower lows confirming seller dominance.
2. Secondary Trend Phase: The current consolidation represents a temporary pause before the next leg down.
3. Bearish Flag Formation: The flag pattern suggests a continuation signal, with a potential downside target near 1.76400.
Trading Strategy:
- Entry: Consider short positions only after a confirmed breakdown below the flag’s support with strong bearish momentum.
- Target: The measured move projection points toward 1.76400, but partial profits can be taken along the way.
- Stop Loss: A conservative stop should be placed above the recent swing high to limit risk in case of a false breakout.
Risk Management:
- Maintain a disciplined risk-reward ratio (at least 1:2).
- Avoid aggressive entries; wait for clear confirmation (e.g., a strong bearish candle closing below support).
Conclusion:
EURAUD remains bearish, and the formation of another bearish flag reinforces the possibility of further downside. Traders should remain patient for a confirmed breakdown before entering short positions while adhering to strict risk management rules.
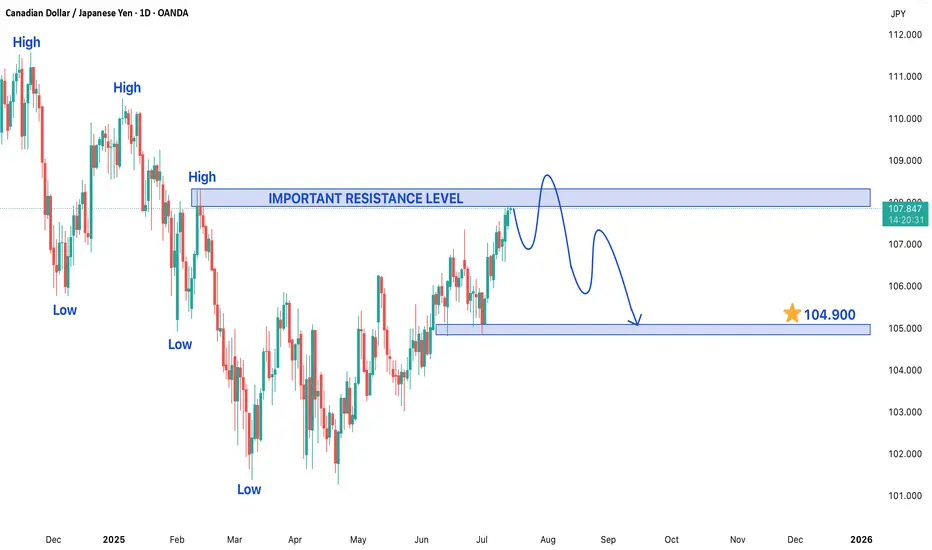
CADJPY TRADING IN A BEARISH TREND STRUCTUREThe CAD/JPY currency pair is currently exhibiting a bearish trend structure, indicating a prevailing downward momentum in its price action. At present, the pair is trading within a secondary trend near a significant resistance level, which is a critical point that could determine its next directional move. Traders and investors are closely monitoring this level as a breakout or rejection here could set the tone for future price movements.
On the lower side, if the bearish momentum continues, the price may decline toward the target of 104.900. This level could act as a key support zone, where buyers might step in to halt further losses. A break below this support could intensify selling pressure, potentially pushing the pair toward lower levels. Conversely, if the price finds stability near this support, a short-term rebound could occur, providing traders with potential buying opportunities in a corrective phase.
On the higher side, if the pair manages to overcome the current resistance, it may attempt to test the next key resistance level at 108.300. A successful breakout above this level could signal a shift in market sentiment, possibly leading to a trend reversal or a stronger corrective rally. However, given the prevailing bearish structure, any upward movement may face strong selling pressure near resistance zones, limiting upside potential.
Traders should remain cautious and watch for confirmation signals before entering positions. Key indicators such as moving averages, RSI, and MACD can provide additional insights into momentum and potential reversals. Risk management strategies, including stop-loss orders, should be employed to mitigate downside risks in case the market moves against expectations. Overall, the CAD/JPY pair remains in a bearish phase, and its next major move will depend on how it reacts to the critical resistance and support levels mentioned.
WTI Crude Oil Reverses Lower Near $70 ResistanceA bearish engulfing candle has formed on the daily WTI crude oil chart, with its high perfectly respecting the 38.2% Fibonacci retracement just beneath the $70 handle. Given that the bounce from the June low has been relatively weak compared to the sharp decline from $78, I’m now on alert for a potential break beneath the $64 support level.
That said, the 200-day SMA and EMA currently sit between $65.21 and $65.31, which could offer near-term support. Should oil prices attempt to grind higher within the 1-hour bullish channel, bears may look to fade rallies into the weekly pivot (67.59) or the $68.00 handle, positioning for a potential rollover. A clean break below the 200-day averages would shift focus firmly back to $64, near the June low.
Matt Simpson, Market Analyst at City Index and Forex.com

CL down sub $60 before moving up above $73Expected support or reversal zone based on last swing high for CL is at $60. This matches with 0.786 fib level of last move up, suggesting a standard SBS structure forming. Expecting a move up to at least $73 (fib 0.236), possibly also well beyond this.
Based on time fib of last swing high I expect the bottom to occur before July 20th.

#AUDUSD: +1100 Pips Possible Swing Bullish Move! AUDUSD a strong sign of bullish behaviour has appeared alongside bullish momentum. As we have NFP tomorrow, we expect market to remain volatile; what we think now is to have market settled down before we can have any confirmation. We recommend to remain extra cautious tomorrow, once market get settled we can then enter with accurate risk management.
Like, comment and Share for more!
Team Setupsfx_
#ETHUSDT: Currently On The Way Towards Filling The FVG?ETCUSDT is currently experiencing a significant correction as the price approaches a pivotal juncture where a substantial bullish price reversal is anticipated, potentially propelling it to new all-time highs or even surpassing them. It is imperative to exercise meticulous risk management and conduct your own thorough analysis before engaging in any cryptocurrency trading or investment activities.
Should the price indeed undergo a major correction, it is likely to decline to our second designated area, where it is anticipated to fill the liquidity gap and subsequently reverse course, continuing its trajectory towards our established targets.
Please consider this analysis as a secondary influence only, or even solely for educational purposes. It is crucial to conduct your own independent analysis and risk management prior to engaging in any cryptocurrency trading or investment endeavours, as they inherently carry substantial financial risks.
We extend our best wishes and encourage you to trade safely and responsibly.
Should you wish to demonstrate your support, you are welcome to express your appreciation through likes, comments, or sharing this information.
Thank you for your consideration.
Have a pleasant weekend.
Team Setupsfx_

#EURNZD: Wait For Price Breakthrough,Swing Buy With ConfirmationEURNZD is trading at a critical level where the price has previously rejected multiple times. If the price breaks through this region, we could see a swing move and touch the previous higher high. The main question is to wait for a proper breakthrough. When the price does that, we can enter with confirmation. Remember, patience is key!
Good luck and trade safely. Do your own due diligence.
Team Setupsfx_

8 Year XRP / US OIL Range Break out?Not to get ahead of myself, but... The 8 year range XRP has been in is about to give, too.
The fibonaccis on that point to (at current oil prices):
- $110 (also in range of a number I'd called for)
- $165 (also in range of a number I'd called for)
- $1035 (w/ full global adoption and swift - not out of the question, but I hadn't been able to substantiate this high with my current model. But I am over solving in the model and have a lot of conservative assumptions, basic math could support it - but alot of unknowns getting there.)
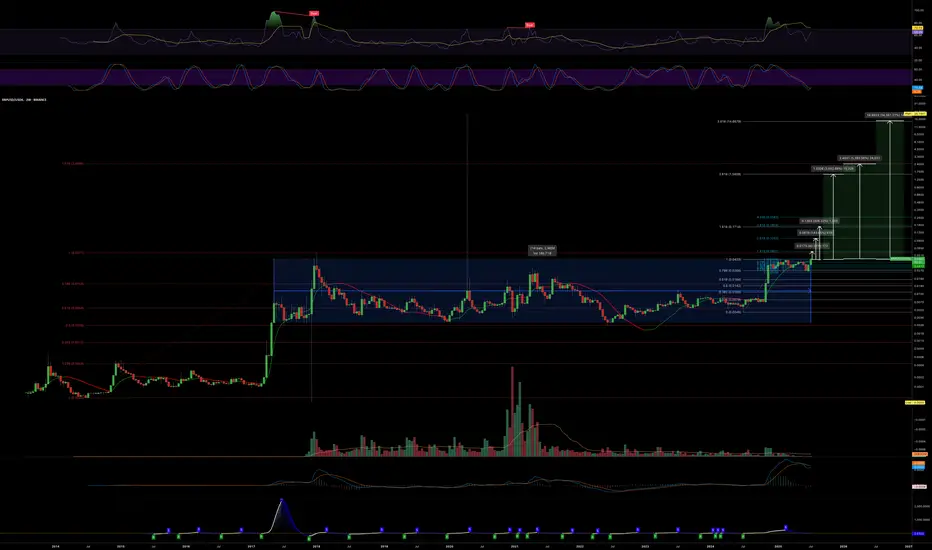
$XRP / $USOIL is breaking out of the 7.5 month range. It's time.CRYPTOCAP:XRP / TVC:USOIL is breaking out of the 7.5 month range. It's time.
Fibonacci says it's a 4x from here, $12 at current oil prices, within the $8-12 range I'd been calling for.
Other potential pivots (at current oil prices).
- $4.2
- $7.2
If Oil goes up and the chart structure holds - that effectively would be compounding in USD terms.
