Nifty Analysis EOD – July 14, 2025 – Monday🟢 Nifty Analysis EOD – July 14, 2025 – Monday 🔴
"Broken Support, Fought Resistance – Tug of War in Play"
Nifty began the day with a classic Open = High (OH) setup, instantly rejecting any bullish intent. The crucial support zone of 25,080–25,060 was taken out early, and the market went on to mark the day's low at 25,001.95, a level that quickly turned into a decisive battleground.
After a bounce from the low, 25,125 emerged as a stiff resistance that pushed the index back below the broken support zone. For most of the session, the same support zone turned into resistance — a textbook polarity flip. However, in the final hour, Nifty showed resilience and finally closed back above 25,080, ending the session at 25,082.30.
🔄 The structure was full of failed intraday breakouts, signaling confusion and conflict — likely fueled by a wider CPR, imbalanced market structure, and medium IB of 109 pts. It was a low-volatility session, but packed with psychological tests.
🕯 5 Min Time Frame Chart with Intraday Levels
🕯 Daily Time Frame Chart with Intraday Levels
🕯 Daily Candle Breakdown
Open: 25,149.50
High: 25,151.10
Low: 25,001.95
Close: 25,082.30
Change: −67.55 (−0.27%)
📊 Candle Structure Breakdown
Real Body: 67.20 points – small to moderate bearish body
Upper Wick: 1.60 points – negligible upside attempt
Lower Wick: 80.35 points – strong defense from day’s low
🔍 Interpretation
Opened higher but got instantly rejected (OH formation).
Sellers took charge early but failed to hold momentum all the way.
The long lower wick reflects buyer presence at key 25,000 zone.
The close below open but above reclaimed support suggests tug of war — with bulls slightly redeeming themselves by EOD.
🕯 Candle Type
Hammer-like red candle — while bearish on close, the long lower shadow indicates potential exhaustion of selling and hints at reversal if follow-through buying emerges next session.
📌 Key Insight
25,000–25,020 has emerged as crucial near-term support.
A strong open or close above 25,150–25,180 may confirm a bullish reversal setup.
Breakdown below 25,000 opens the door for a fall toward 24,950 or lower.
🛡 5 Min Intraday Chart
⚔️ Gladiator Strategy Update
ATR: 188.77
IB Range: 109.20 → Medium IB
Market Structure: 🔴 Imbalanced
Trades Triggered
09:50 AM – Long Trade → ❌ SL Hit
01:05 PM – Short Trade → ❌ SL Hit
📉 Tough day for directional trades — false breakouts dominated.
📌 Support & Resistance Zones
Resistance Levels
25,125
25,168
25,180 ~ 25,212
25,260
25,295 ~ 25,315
Support Levels
25,080 ~ 25,060
25,000 ~ 24,980
24,965
💭 Final Thoughts
“Reclaimed ground doesn’t mean victory – yet. Watch the next move. Rejection below 25,000 ends the bulls' narrative; a strong move above 25,180 rewrites it.”
✏️ Disclaimer
This is just my personal viewpoint. Always consult your financial advisor before taking any action.
Pivot Points

Gold continues to rise after keeping low and breaking high
Last Thursday and Friday, I repeatedly mentioned the position of 3344 to my members. As a strong resistance position in the early stage, every time the price falls below the low point, the pressure to find the bottom and rebound is this area, and then continue to break the low under pressure. This time, we emphasize that breaking through and standing firmly on 3344 is the key. If it can break through and stand firmly, the next resistance is 3358, followed by 3373.
Now the price has broken upward as expected, completing the qualitative change. The next step is to look at the switching of space. Keep low and break high to see acceleration. After breaking the low point, consider sweeping.
Specific key points are expanded:
1. The daily line pattern is still closing and flat. The lifeline is the space switching point in the past one or two months, which will determine the subsequent market space rhythm. At present, the price has successfully broken through the lifeline and switched upward to enter the lifeline to the upper track. 3339-3396
Then, in the case of subsequent market holding the lifeline, maintain the upper range sweep, yes, it is still the rhythm of sweeping, just change the space
2. The four-hour pattern opens slightly upward, pointing to the upward direction
Starting from the lower track 3283 of the squat probe pattern, it has risen steadily. After repeatedly determining the lifeline position 3310 area, it will start to rise further and the pattern will open upward
The lifeline position coincides with the support 3330-3328 area repeatedly determined last Friday, and together they become the last defensive dividing line for the bulls to rise
3. The double-line interval 3330-3325 of the hourly chart has become a space switching area, which previously suppressed the price from falling further, and now it has turned into support, and will rely on the price to further rise Step up, pay attention to the role of the dividing line
4. Maintain the idea of switching with the same profit space, start from 3283 and calculate 3313, then 3328, then 3343, then 3358, and finally 3373, and then 3388, and 3403 (here needs to be highlighted)
5. As shown in the figure, the purple large channel range is swept, the space range is about 100-150 US dollars, this wave of increase is about 100 US dollars, and there is still room to pay attention to. The upper track of the channel overlaps with the upper track of the daily line pattern in the 3396-3400 area, and the 3403 position mentioned above together become the next space dividing line area
In summary, for the current gold, it is still in the rising stage, and the idea remains low and bullish. Pay attention to the process The intensity and amplitude of the adjustment can be squatted to gain leverage, or sideways for a period of time to gain space. Both are ways of correction. After the correction is completed, continue to be bullish and break through.
Referring to this idea, we gave a long position from 3358-3356 in the afternoon. As expected, it sprinted to 3375 as of press time. Those who keep positions should pay attention to the upward loss point, and then pay attention to further rise.
Of course, today's trend will be more tiring, so there is still an opportunity to step back and buy low. Pay attention to the 3364-3362 position to continue to buy low (aggressive 3366 can start), stop loss 3355, target 3380-3388
Another extreme sweep needs to pay attention to the 3342-3339 and 3330-3328 areas. This needs to be determined according to the situation. Pay attention to 3388 and 3396-3403 when switching upward.

Bitcoin - Bitcoin, Unrivaled in the Market!Bitcoin is above the EMA50 and EMA200 on the four-hour timeframe and is in its ascending channel. Bitcoin’s current upward momentum has the potential to reach the target of $130,000. If it corrects, Bitcoin buying opportunities can be sought from the specified demand zones.
It should be noted that there is a possibility of heavy fluctuations and shadows due to the movement of whales in the market and compliance with capital management in the cryptocurrency market will be more important. If the downward trend continues, we can buy within the demand area.
In recent days, Bitcoin has managed to set a new historical high by crossing the $118,000 level; a jump that followed the strong accumulation of institutional capital, the upward trend of spot ETFs and the remarkable consolidation of such indices. This growth is not only the result of technical conditions or short-term market excitement, but is a clear reflection of the structural maturity of the Bitcoin ecosystem in the second half of 2025. A careful and comprehensive examination of the fundamental parameters shows that Bitcoin is moving differently than in the past: slower, but with much stronger support. On the other hand, more than $205 million in Bitcoin short selling positions have been liquidated following the jump in the price of Bitcoin and its crossing the $122,000 level.
First, the flow of investment from Bitcoin spot ETFs has broken records over the past week. In one day, more than $1.18 billion entered these funds, and the total annual inflow of these financial instruments has reached more than $51 billion. This is while ETFs such as IBIT (managed by BlackRock) and FBTC (managed by Fidelity) are attracting hundreds of Bitcoins daily, without causing any negative divergence in price indices. This phenomenon clearly shows that the participation of institutional investors through regulated channels is not only stable, but also accelerating. Along with this flow of capital, the parameters of the chain also paint a picture of a market with a balance of supply and demand. The MVRV ratio, an indicator for measuring market profitability, fluctuates between 2.2 and 2.34, meaning that the market is in a reasonably profitable state, but is still some way from the warning zone of profit saturation. Meanwhile, long-term holders (LTHs) are also continuing to accumulate. Long-term wallet holdings have reached a record high of 14.7 million BTC, representing nearly 70% of the total supply. In the last quarter alone, more than 13,000 BTC have been added to this group’s reserves.
On the other hand, the SOPR indicator, which measures realized profit ratio, shows that profit-taking is taking place at a gentle slope in the market, away from heavy selling pressure. This logical trend of profit-taking is a testament to mature investor behavior. Bitcoin flows to exchanges are also at very low levels; Bitcoin held on exchanges now account for just 1.25% of the total supply—the lowest level in over a decade. This significant reduction in potential selling pressure has kept Bitcoin’s price stable in the face of short-term volatility.
Behaviorally, the market is also showing signs of maturation. The number of daily active addresses has remained stable, but unlike during the buying frenzy, we are no longer seeing retail traders rushing into exchanges or mass wallet outflows. In other words, on-chain activity has stabilized, similar to the behavior of traditional mature markets—markets driven by data and structure, not emotion. From a macro perspective, the outlook for Bitcoin in the medium term is also positive. Many analysts and institutions, including Global X ETFs, see Bitcoin’s growth to $200,000 within the next 12 months as achievable. Technical analysis from some sources has also outlined the $140,000 range as the next price target in the next 100 days, provided that the VIX volatility index remains low and macroeconomic data maintains its current trajectory. However, a more conservative scenario sees a price consolidation in the $95,000-$100,000 range if geopolitical pressures increase or ETF inflows weaken.
Overall, Bitcoin is moving ahead in the summer of 2025 not only on the back of crypto market excitement, but also on the back of strong fundamentals and structured institutional capital inflows. Accumulation by long-term holders, a steady decline in supply on exchanges, a reasonable profit-taking balance, and a formal investment structure via ETFs have all combined to bring the market to a stable state and ready for further increases. If this trend holds, levels of $125,000-$140,000 in the short term, and a range of $180,000-$200,000 by the end of the year, are not far off!
On the other hand, BlackRock’s Bitcoin ETF (IBIT) managed to record the fastest growth in history among all ETFs, surpassing $80 billion in assets in just 374 days! For comparison, it should be noted that the S&P500 Index ETF needed about 5 times this time! BlackRock now holds about 706,000 Bitcoins (equivalent to 56% of the total ETF share).
FULL BACK SUPPORT LEVEL 📉 AUDUSD – Potential Rebound from Key Support
Price is currently responding to a well-established horizontal support level, indicating a possible short-term bullish retracement.
The appearance of a bullish imbalance candle on the 1-hour timeframe further strengthens the case for a recovery move.
🎯 Target: 0.658
🕐 Timeframe: 1H
📌 Outlook: Short-term Bullish

WTI Crude Oil Analysis – 4-Hour TimeframeWTI Crude Oil Analysis – 4-Hour Timeframe
At the moment, the price is trading below a key resistance zone (marked in red), which has previously triggered multiple pullbacks. The current price behavior near this area reflects market hesitation to break through this level.
🔴 Bullish Scenario:
If the price manages to break above this resistance zone and holds above it, we can expect the upward movement to continue toward higher resistance levels. This move may unfold in a step-by-step trend, accompanied by intermediate pullbacks. The next resistance zones could act as potential targets for the bullish wave.
🔴 Bearish Scenario:
If the price reacts negatively to the current resistance area and fails to break through, a bearish correction may follow. In this case, the nearby short-term support levels could be the first targets for sellers. If those supports are also broken, the likelihood of a deeper decline and continuation of the downward trend increases.

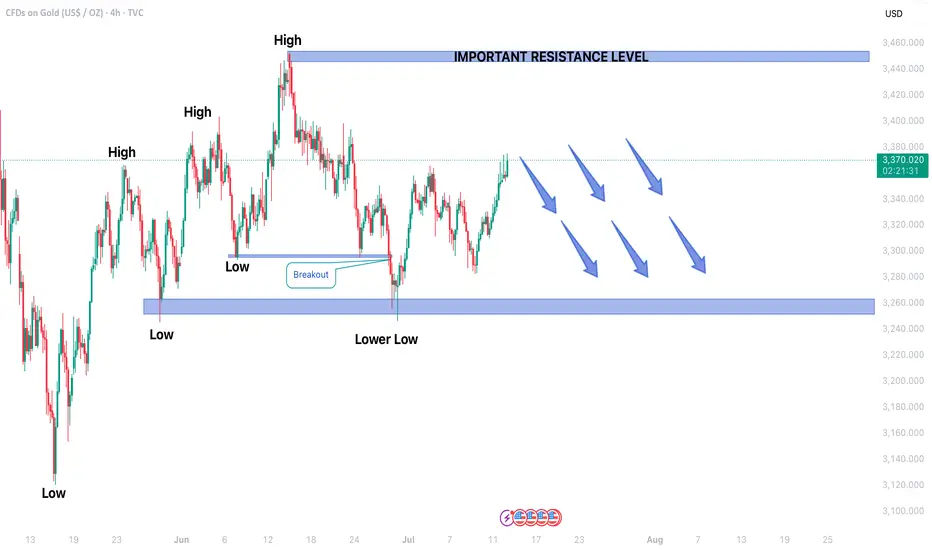
GOLD TRADING IN BEARISH TREND IN 4H TIME FRAMEGold price forming Lower lows which indicated Bearish trend movement.
Price is currently moving in Secondary Trend.
In upcoming sessions secondary trend may end and price may start forming Primary trend.
After a candlestick reversal pattern, Gold may continue to fall.
Price may hit the support level of 3250$ in upcoming sessions.
On higher side 3450$ may act as an important resistance level.
Gold (XAUUSD) Analysis – 4-Hour TimeframeGold (XAUUSD) Analysis – 4-Hour Timeframe
Currently, the price is moving in an upward trend and approaching a key resistance area. Recent volatility suggests that buyers have shown enough strength to break through previous resistance zones and are now attempting to overcome the next significant barrier ahead.
🔴 Bullish Scenario:
If the price manages to break above the current resistance and hold above it, we can expect a continuation of the upward move toward higher zones. In this case, the bullish wave could extend toward the next resistance levels (marked in blue).
🔴 Bearish Scenario:
If the price reacts negatively to the current resistance area and fails to break above it, a corrective decline may follow. The nearest support zone below could play a crucial role in maintaining the bullish structure. However, if this support is also broken, the path could open for a deeper pullback toward lower support levels.

GBPUSD Week 29 Swing Zone/LevelsAfter 7 straight weeks of profitable gold trading, we’re shifting gears to GBPUSD.
Why this pair? It’s offering a classic low-risk, high-reward setup that many traders appreciate:
🔒 Stop Loss: 10–15 pips
🎯 Take Profit: 50–100 pips
We’re analyzing price action using a simple but powerful concept:
Each zone is drawn based on how the high and low of one day compares with the next. For example:
Monday’s high/low vs Tuesday’s range
Tuesday’s vs Wednesday’s, and so on
This method helps spot potential continuation zones as market structure unfolds across the week.
👉 The key? Patience, and letting the levels tell the story.
As always price action determines trades

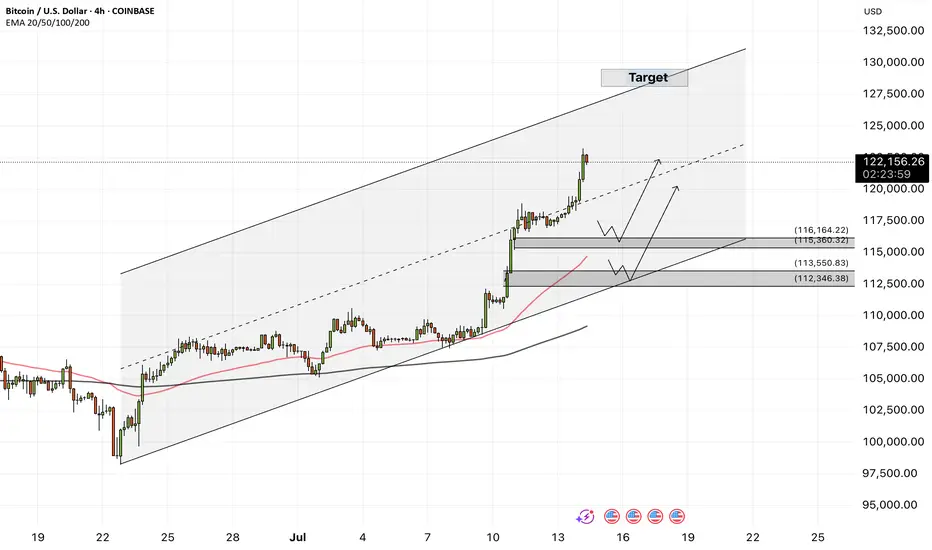
BTC Breakout is Real Flag Playing Out with Wave 3 MomentumBitcoin is looking really clean here. After weeks of sideways grind inside what looked like a consolidation trap, the structure has finally matured into something meaningful, a classic bullish flag breakout layered inside a broader Elliott Wave count.
What really stands out is how the flag structure (B → C) formed a smooth pullback after the strong A → B impulse. That was the pole. Now we’ve broken out of the flag, and momentum is picking up again, likely heading into wave (3) of the new leg pointing towards D.
This isn’t just about a flag the entire move is developing inside a wide ascending channel, and price is following it almost perfectly. The bullish momentum coming off the breakout zone is clean, no choppiness just strong candles and impulsive drive.
We might get a short-term breather (sub-wave 4 of current wave 3), but structure suggests more upside is likely as long as price holds above that $113K–$115K zone.
What I'm Watching Right now:
Support zone: $113K – $115K
Short-term target: $123-$127K
Final projection (if channel holds): $140K–$145K
Measured move from the flag and wave count both point up there, so I’ll be watching for minor pullbacks as entry opportunities.
Personal Take
I like when patterns align naturally not forced. This one’s got that nice blend of momentum, structure, and price behavior. I’m not rushing entries here, but will scale into dips if price holds support and volume confirms.
Have you spotted this setup on your end too? Drop your view in the comments always keen to see how others are reading this.
Follow for clean, no hype market breakdowns.

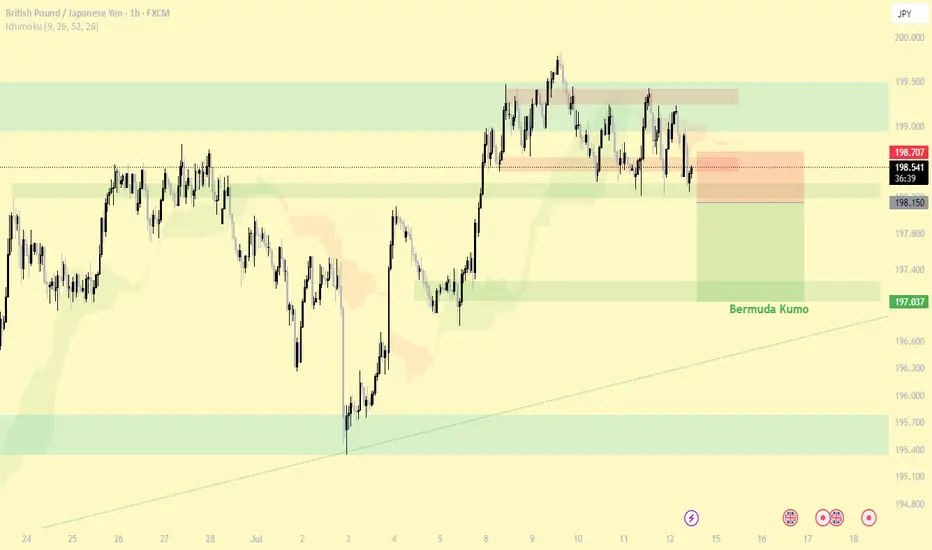
#GBP/JPY Monday 14 Jul 2025Reasons for entering the trade:
1- Breaking the last low of the high and the range area
2- Breaking the 4H support
3- Bermuda Kumo (4H)
Entry: 198.150
TP: 197.037
SL: 198.218
GBPUSD| - Bullish BiasHTF Overview (4H): Strong bullish structure in play, with multiple highs being broken and momentum firmly to the upside. Price is clearly respecting bullish order flow, suggesting continuation.
MTF Refinement (30M): Identified a 30M OB aligned with the trend. Waiting for price to mitigate this zone, as it could serve as the springboard for the next impulsive leg up.
Execution Plan: Once the 30M OB is mitigated, I’ll drop to LTF (1M/5M) to watch for confirmation — CHoCH, BOS, or microstructure shift — before executing longs.
Mindset: Bull momentum is intact — patience and confirmation are key to riding it with precision.
Bless Trading!

USDJPY| - Bullish Play Within Bearish HTF ContextHTF Overview (4H): Structure is still technically bearish, with buy-side liquidity (BSL) untouched and a major 4H supply OB unmitigated above. Expecting price to seek out that zone before any full reversal.
MTF Refinement (30M): Refined structure shows a potential bullish leg forming to push toward the 4H supply. Price is reaching for nearby sell-side liquidity (SSL), acting as inducement.
Execution Plan: Waiting for a clean sweep of SSL. Once that occurs and the 30M OB is mitigated, I’ll drop to LTF (1M/5M) to confirm bullish intent with CHoCH or BOS before executing a long.
Mindset: Playing the internal bullish wave with precision while respecting higher timeframe narrative. Quick to react if the HTF bias reasserts itself.
Bless Trading!

ETH – $7k Target in Sight
7k incoming on CRYPTOCAP:ETH —timing is up in the air, but the chart looks stellar.
A decisive break above $3,500 should kick off aggressive expansion.
Meanwhile, ETHBTC has been rallying hard off its lows; I’m eyeing a 50% gain against BTC over the next 2–3 months.
Holding through this strength makes sense—it’s been a long time since we’ve seen these setups.

XAUUSD (GOLD) - Bullish BiasHTF Overview (4H): Structure remains bullish after a recent break of highs. Liquidity above was taken, followed by a clean mitigation of a 4H OB — signaling strength and smart money continuation.
MTF Refinement (30M): Aligned with the bullish narrative, 30M shows price is likely reaching for nearby sell-side liquidity before resuming the upward move. Watching for price to sweep that liquidity zone next.
Execution Plan: Once the 30M OB is mitigated, I’ll drop to the 1M/5M for internal structure shifts — CHoCH or BOS — to confirm long entry.
Mindset: Not chasing — letting liquidity play its role and waiting for the OB + confirmation confluence before executing.
Bless Trading!

GBPJPY - Bullish BiasHTF Overview (4H): Price broke bullish structure with clean directional intent. Order flow remains aligned to the upside with no immediate signs of weakness.
MTF Refinement (30M): Zoomed into 30M for deeper structure clarity. Observing price actively reaching for sell-side liquidity (SSL) below a key low — a classic inducement setup forming.
Execution Plan: Waiting for a liquidity sweep below the SSL. Once swept, I’ll monitor the nearby 30M OB for mitigation. LTF confirmations (1M/5M CHoCH or BOS) will be needed before committing to a long entry.
Mindset: Patience over prediction — let liquidity do its job, then ride with smart money.
Bless Trading!

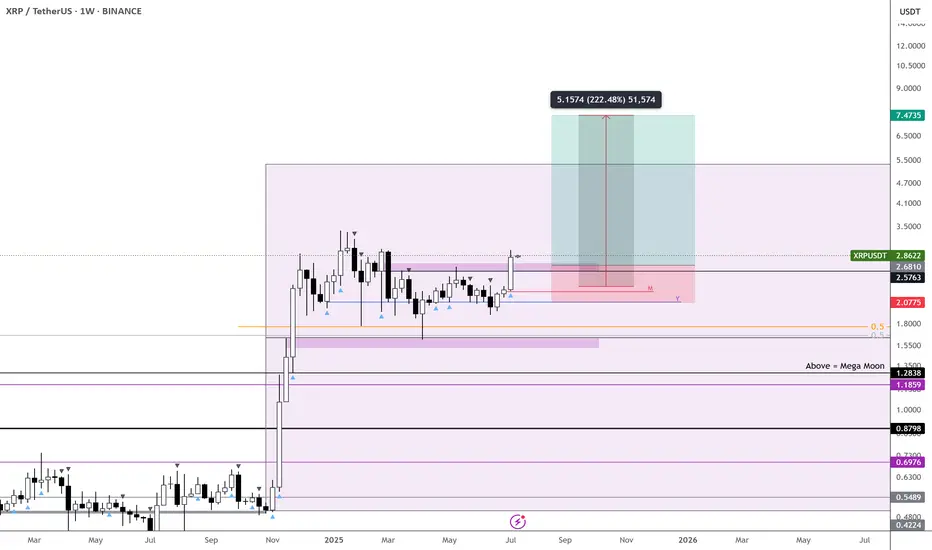
XRP – Dual Trends Active, Ready to Outperform - $7 Incoming
Two active trends on CRYPTOCAP:XRP right now—monthly and weekly confirmations are in, which significantly boosts the probability of hitting the first target.
Honestly, I see this outperforming CRYPTOCAP:ETH , though both are worth holding.
With both timeframes aligned, I’m expecting a strong move.
Targeting $7 on CRYPTOCAP:XRP and over $7k on $ETH.
NASDAQ - Bullish BiasHTF Overview: 4H shows strong bullish intent with momentum driving price higher. Clear upside direction supported by sustained breaks in structure.
Liquidity Note: Noticed a key liquidity zone beneath current price (marked in blue). Although deeper mitigation was possible, price remained bullish.
MTF Refinement (30M): Dropped to the 30M for structural clarity and saw an earlier reaction. A bullish OB was formed and respected — now monitoring it for a potential mitigation.
LTF Execution Plan: If the 30M OB is revisited, I’ll be looking to the 1M/5M for confirmation (CHoCH or BOS) before executing long positions.
Mindset: Momentum is with the bulls — just waiting for smart money to confirm their next move.
Bless Trading!

EUR/USD| - Bullish BiasHTF Context: Noted a clear break of structure to the upside, signaling strong bullish intent. Originally expected a deeper liquidity grab, but price shifted before reaching lower zones.
MTF Refinement: Dropped down to the 30M for better alignment — spotted a liquidity sweep confirming smart money interest.
LTF Execution Plan: Now watching for mitigation of the 30M OB. Once tapped, I’ll look for internal structure shift (1M/5M BOS or CHoCH) to confirm continuation.
Mindset: Staying patient — if price wants higher, it should respect this OB and show its hand first.
Bless Trading!

ETH – Watching the $2,900 Trigger for ATHsJust need BINANCE:ETHUSDT to break above $2,900 for the next trigger.
Feeling confident it will chew through the current supply zone.
Plenty of other coins are already showing clear direction, and Ethereum should follow.
Be patient—I doubt ETH will challenge the #1 spot, but a move above $2,900 opens the door to a potential new ATH.

BONK – Long Here, Patience RequiredTime to go long on $BONK.
Hard not to bid at this level—the risk/reward is solid.
Still expecting some range-bound price action before the real move kicks in, so patience is key here.
First target: the yearly open—nearly a 2x from current levels. BINANCE:BONKUSDT

PEPE – Strongest Setup Among Top Meme Coins
Out of the higher-cap meme coins, I’m leaning more toward $PEPEUSDT.
From a price action perspective, it’s showing more strength than CRYPTOCAP:DOGE , CRYPTOCAP:SHIB , and $WIF. That’s not to say the others won’t pump—but personally, CRYPTOCAP:PEPE looks the most appealing here.
The green box is a solid area to build a position. It’s held the trimester lows well and continues to test them while responding bullishly.
Let’s see how it plays out over the next two months—but I like the odds of upside from here.

CHILLGUY – Ideal Entry After Retrace - 2x incoming!Best time to enter on $CHILLGUY—been waiting for a retrace, and we finally got it.
Anything near $0.055 is a solid buy if you missed the green zone entries.
The 3D chart is already signaling strong demand, and both downtrend signals from the local top have expired.
Expecting this one to trend faster than $BERT.
Targeting the Yearly Open for now—about a 2x from current levels. Will reassess after that.

BERT – Positioning Early for Post-July Breakout - 10centsMEXC:BERTUSDT may take a few more weeks before it starts to surge.
Slowly building a position in this area—there’s a weaker downtrend signal off the local top that expires around July 21.
After that, I see a solid chance for trend continuation and potential new highs into late July or early August.
Yearly Open is the near-term target, but expecting a move toward 10c by year-end.
