DXY-Technical Analysis DAILY Timeframe 📊 DXY – Technical Analysis (1D Timeframe)
🔷 Overall Trend:
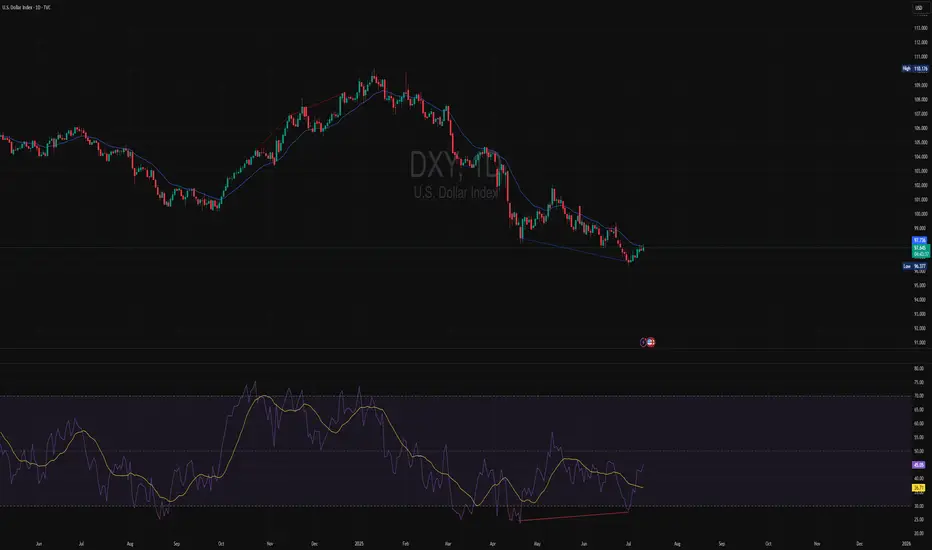
The Dollar Index (DXY) has been in a strong downtrend for several months, forming multiple confirmed Breaks of Structure (BOS) to the downside.
However, recent price action is showing signs of momentum loss and potential exhaustion from sellers near the current lows.
🟡 Market Structure:
Price recently formed a lower low, but momentum indicators are showing bullish divergence — suggesting the downward pressure is weakening.
A small bullish reversal candle has printed, indicating potential short-term buying interest.
There is no confirmed bullish CHoCH yet, but structure is starting to slow down and compress — signaling a possible shift.
📉 Indicators (RSI ):
RSI is rebounding from oversold territory, showing potential early reversal signals.
The confirms bullish divergence and shows fading bearish momentum.
Overall, sellers are showing reduced strength, increasing the chance of a corrective move to the upside.
🔹 Key Levels:
Immediate resistance zones:
🔹 97.23 and 97.73 — key levels to watch for bullish continuation.
Major support:
🔻 96.34 – 96.50 — current low area that if broken, will confirm further downside.
✅ Conclusion:
While DXY remains structurally bearish, the recent bullish divergence, loss of selling momentum, and RSI recovery suggest the potential for a short-term correction or bounce.
A confirmed CHoCH and break above 97.73 would signal a potential shift to bullish structure.
If price fails to break resistance and drops below 96.34, the bearish trend is likely to continue.
🟢 Scenario Table:
Scenario Trigger Implication
Bullish shift Break above 97.73 with CHoCH Potential trend reversal
Continuation bearish Break below 96.34 Downtrend continuation
Disclaimer: This analysis is for informational and educational purposes only. It does not constitute financial advice or a recommendation to buy or sell any asse
Pivot Points
BTC 1 hr technical analiysis Asset: BTCUSDT.P (Bitcoin Perpetual Futures)
Timeframe Provided: 1-Hour (1H)
BITGET:BTCUSDT.P
1. Higher Timeframe Bias (Assumed for 1H Context):
Based on the observed price action, specifically the strong impulsive bullish move around July 2nd-3rd, followed by a corrective pullback, it is reasonable to assume a bullish bias from the higher timeframes (Daily/4H). This assumption is crucial, as the 1H timeframe should ideally align with the dominant higher timeframe trend for high-probability setups. The strong push above previous resistance and the subsequent retracement suggest the potential for a continuation of an uptrend.
2. 1-Hour Structure Analysis:
Initial Structure: The price was generally ranging or in a slight downtrend until around July 2nd. We observe multiple internal bearish Break of Structures (1H BOS in red).
Change of Character (CHoCH): A significant bullish 1H CHoCH is observed around July 2nd, indicating a shift from a bearish to a bullish internal structure. This shift was followed by strong bullish momentum.
Break of Structure (BOS): After the CHoCH, the market showed clear bullish 1H BOS, confirming the new bullish impulse.
Current Structure: The market has recently pulled back significantly after the strong bullish impulse. This pullback has tested a key demand zone. We are looking for a continuation of the bullish trend from this pullback.
3. Liquidity and Inducement:
Sell-Side Liquidity (SSL): Prior to the bullish CHoCH, there were clear areas of sell-side liquidity that were swept, fueling the subsequent upward move.
Inducement: The current pullback, while corrective, may be acting as an inducement, drawing in early buyers or trapping sellers, before potentially continuing the upward movement. Price has swept some internal liquidity during this retracement.
4. Valid Demand/Supply Zones (1H):
Primary Demand Zone: The most prominent demand zone of interest is located roughly between $107,000 and $107,300. This zone represents an unmitigated order block (or a clear area of strong institutional buying) that initiated the significant bullish impulse. It also aligns with previous resistance that was broken and is now potentially acting as support (a "flip zone"). This is our primary point of interest for a long entry.
Mitigation: Price has begun to tap into this demand zone, indicating a potential mitigation phase.
5. Trade Setup Proposal (High Probability Long Setup):
Considering the assumed higher timeframe bullish bias and the current 1H structure, a long setup from the identified demand zone presents a high-probability opportunity.
Bias: Bullish
Entry Strategy: We are looking for confirmation within the demand zone. Given the 1H chart, a refined entry could be sought on a lower timeframe (e.g., 15M or 5M) for further confirmation (e.g., an internal CHoCH, aggressive entry within the order block). However, based on the provided 1H chart:
Proposed Entry Price: Around $107,150 - $107,250. This is within the heart of the unmitigated demand zone. The visual suggests an entry around $107,200.
Stop Loss (SL): Slightly below the low of the demand zone/order block, and crucially, below any structural low that would invalidate the bullish short-term structure.
Proposed SL Price: Around $106,750 - $106,900. The visual places the SL at approximately $106,900. This allows for some wick hunting but protects capital if the demand fails.
Target (TP): We will target the high of the recent bullish impulse, and potentially higher if the higher timeframe bias confirms a sustained uptrend.
Proposed TP Price: Initial target at the recent high around $110,900 - $111,000. The visual suggests $110,950.
Rationale for TP: This target represents the next logical liquidity pool (buy-side liquidity) and a significant structural high that, if broken, would confirm further bullish continuation.
Risk to Reward Ratio (RRR):
Entry: ~$107,200
SL: ~$106,900 (Risk: $300)
TP: ~$110,950 (Reward: $3750)
Calculated RRR: Approximately 1:12.5. This is an exceptional RRR and highlights the potential of this setup.
6. Important Considerations & Trade Management:
Confirmation: While the 1H demand zone is strong, for institutional-level entries, further confirmation on lower timeframes (e.g., a CHoCH or clear bullish momentum shift on the 5M/15M chart once price enters the demand zone) would be ideal.
Market News/Events: Always be aware of upcoming high-impact economic news (e.g., CPI, FOMC minutes, NFP) that could induce high volatility and invalidate technical setups. For crypto, major exchange news, regulatory announcements, or large whale movements can also impact price. As of Saturday, July 5th, 2025, there are no immediate high-impact economic data releases on the calendar for this weekend, but traders should always check the economic calendar for the upcoming week.
Partial Take Profits: Consider taking partial profits at intermediate highs or psychological levels to secure gains and reduce risk.
Trailing Stop Loss: Once the trade moves significantly in profit, consider trailing your stop loss to break-even or beyond to protect capital.
This detailed analysis, even with the limitation of a single timeframe, provides a clear, high-probability long setup based on advanced SMC principles. Monitor price action closely at the entry point and manage risk diligently.
Disclaimer: This analysis is purely for educational and analytical purposes and does not constitute a buy or sell recommendation or financial advice. All trading decisions must be made based on individual analysis, proper risk management, and careful consideration of market conditions by the trader themselves. As an AI model, I bear no financial responsibility for the outcomes of your trades.

AMD new range higherAMD essentially hit my buy zone that I called months ago almost to the T. Now with renewed strength and the market realizing there is share for both NVDA and AMD, the stock rips. I believe it will push up into this zone over the next week weeks and consolidate here. I am not currently in this trade but I did short AMD on the prior pivot.
Sometime in August we likely enter this range and I may start to sell CSP in the demand zones that form.

GTYR at the cusp of breakoutFib 0.236 level from last peak and trend line is the main hurdle. Once it breaks, resistances on pivots and other Fib levels will be the targets.

THG Holdings PLC Quote | Chart & Forecast SummaryKey Indicators On Trade Set Up In General
1. Push Set Up
2. Range Set Up
3. Break & Retest Set Up
Notes On Session
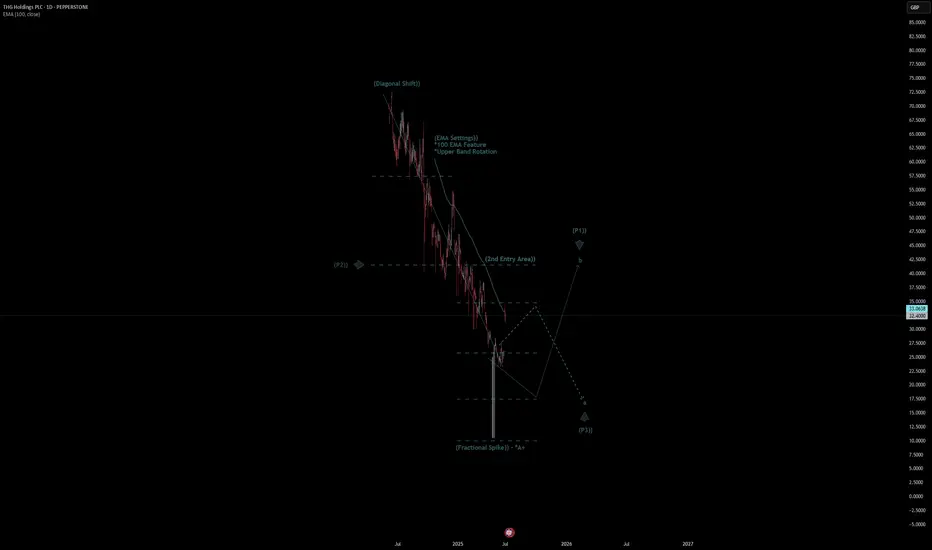
# THG Holdings PLC Quote
- Double Formation
* (Fractional Spike)) - *A+ | Completed Survey
* (EMA Settings)) - *100 EMA Feature | Subdivision 1
- Triple Formation
* (P1)) / (P2)) & (P3)) | Subdivision 2
* (TP1) = a / Long Consecutive Range
* (TP2) = b / Short Consecutive Pullback | Subdivision 3
* Daily Time Frame | Trend Settings Condition
- (Hypothesis On Entry Bias)) | Indexed To 100
- Position On A 1.5RR
* Stop Loss At 54.00 GBP
* Entry At 46.00 GBP
* Take Profit At 34.00 GBP
* (Downtrend Argument)) & No Pattern Confirmation
- Continuation Pattern | Not Valid
- Reversal Pattern | Not Valid
* Ongoing Entry & (Neutral Area))
Active Sessions On Relevant Range & Elemented Probabilities;
European-Session(Upwards) - East Coast-Session(Downwards) - Asian-Session(Ranging)
Conclusion | Trade Plan Execution & Risk Management On Demand;
Overall Consensus | Sell
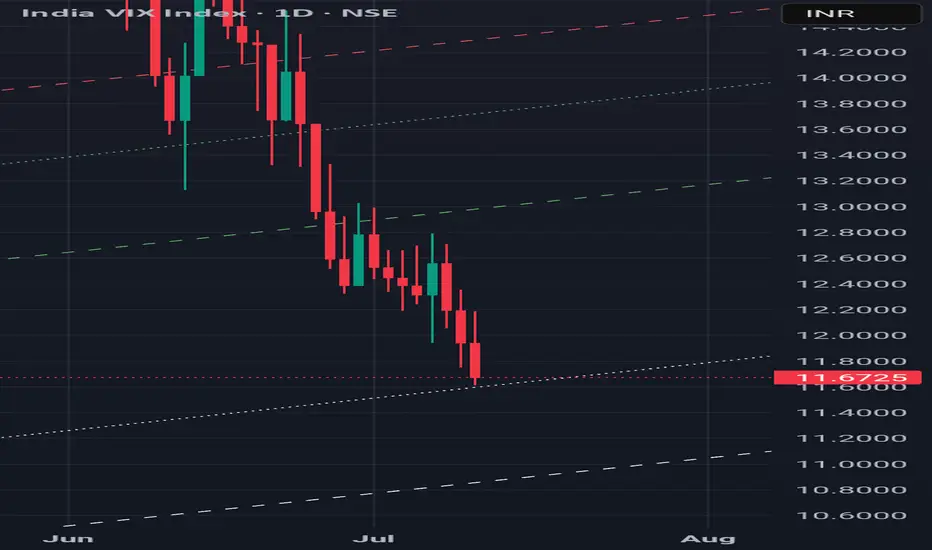
VIX will rise Indian market VIX low has done today now it will not fall more and from now on it will rise and nifty will fall down.
XRPUSDT BINANCE:XRPUSDT Price broke above the downtrend line but faced resistance at 2.2770 dollars and started correcting. Key supports are at 2.1900 and 2.0800 dollars. If it bounces, resistances to watch are 2.2770, 2.3600, and 2.4620 dollars. Price is currently between key levels.
Key Levels:
Support: 2.1900 – 2.0800
Resistance: 2.2770 – 2.3600 – 2.4620
⚠️Contorl Risk management for trades.

BTC Correction's 📉 Significant Bitcoin Correction During Uptrend
After a strong bullish rally, Bitcoin has entered a correction phase, retracing nearly 25% of its recent gains. Interestingly, this correction aligns exactly with the 200-period moving average on the 4-hour chart, marking a potential key support level.
🔍 Is Bitcoin’s Correction Over or Just Beginning?
The overlap with the 200 MA could signal the end of the correction, but if this zone fails to hold, deeper targets between the 35% and 75% retracement levels may come into play.
🛡️ Potential Support Levels for Bitcoin if the Correction Continues:
First support: 102,200 USD – 25% correction
Second support: 93,200 USD – 35% correction
Third support: 84,100 USD – 50% correction
Fourth support: 74,600 USD – 75% correction

ETHUSDTThis is very easy...
best support level 2300 to 2500 for jump price. but was needed for jump price for get enrgy for movement to high levels by fake breakout.
First level of resistance 2800 to 3000.
⚠️Control Money Management in your capital.

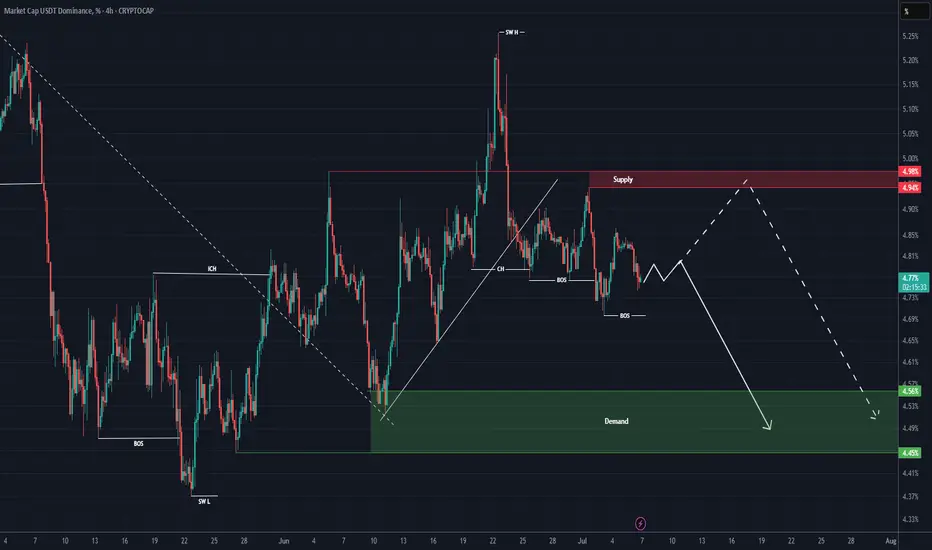
USDT DOMINANCE New Update (4H)By analyzing the chart, it becomes clear that the USDT dominance structure is bearish.
After the structural shift to a downtrend, with lower highs and lower lows forming, it is expected that the price will drop to the main support zone in order to collect major orders from lower levels.
The price could drop from the current level or from the upper supply zone, which would signal a bullish move in the overall market.
The target is the green box.
A daily candle closing above the supply zone would invalidate this analysis.
For risk management, please don't forget stop loss and capital management
Comment if you have any questions
Thank You
Market Structure Break & Bearish Reaction from Supply Zone.🔍 GOLD – Market Structure Break & Bearish Reaction from Supply Zone
Gold has recently broken its market structure (MSS), which is a significant shift in momentum and a potential indication of a change in the prevailing trend. Following this break, price retraced into a key supply zone, where it was rejected sharply—this rejection came in the form of a strong bearish engulfing candle, highlighting aggressive selling interest.
Interestingly, the market has now printed a second consecutive bearish engulfing from the same zone. This is a powerful signal that sellers are active and defending this level, making it a valid and confirmed short-term resistance zone. The repeated rejection suggests that smart money or institutional sellers may be positioned here.
Given this price action, we can anticipate a potential retracement from the current levels. The most probable downside target for this retracement would be the Fair Value Gap (FVG) that has been marked on the chart. If price respects the FVG and reacts bullishly from there, we may then see a resumption of the uptrend, possibly taking price higher again.
This setup presents a good opportunity for both short-term intraday traders and swing traders to watch for confirmation signals before entering the trade.
📌 Key Takeaways:
MSS indicates shift in trend
Consecutive bearish engulfing candles from supply zone
Sellers likely active in this area
Potential retracement toward marked FVG
Possible bullish continuation from FVG zone
🚨 As always, Do Your Own Research (DYOR) and manage your risk accordingly before making any trading decisions.

BTC/USDT Technical Analysis, 2025-07-07 11:30 UTC📊 BTC/USDT Technical Analysis, 2025-07-07 11:30 UTC
🕒 Binance Spot
📆 July 7, 2025 | 11:30 GMT Candle Observations
───────────────
💡 Price: 108712.97 USDT
📉 EMA200 (Dynamic): 108938.31
🟩 Support Watch: 107512.97
🟦 Resistance Target: 109782.97
───────────────
🔍 We're observing price action developing below EMA200, with a recent Piercing Line formation at a noted dip zone. This setup may suggest buyers are attempting to reclaim short-term control.
⚠️ Key tactical support remains near 107512.97, where historical reaction zones and liquidity zones intersect.
📈 A move toward 109782.97 is being monitored as a potential resistance test, in line with local OBV divergence and recovering bid pressure.
📌 Market Microstructure Notes:
• Order Book Imbalance leaning toward bids (+0.45)
• OBV Trend: +10.17% vs 5-period MA
• Thunder Engine Volume Acceleration: ⚡ Observed
• Whale Ask Cluster: ~640k USDT near top of range
📉 No guarantees of breakout or reversal watching how price reacts around key levels. Maintain cautious positioning near support/resistance pivots.

USDJPY ENTRY CHARTWe are still bullish on this pair, the JPY is still WEAK, and the trend on this Pair is BULLISH, price is sitting on a ZONE, we have our LTF confirmation set also, You can add to watch-list if this matches with your trade idea on this pair, and as for us, we advise you move BREAK-EVEN after price move +1r. THANK YOU.

BTCUSD – Range High Retest at 110KBitcoin is consolidating below the 110,736.11 resistance after reclaiming support from the 102,558.1 zone. Price is holding a tight range, building pressure just under key resistance — a breakout above this could spark a move to new highs.
Support at: 102,558.1 🔽 | 91,357.7 🔽
Resistance at: 110,736.1 🔼 (range high)
🔎 Bias:
🔼 Bullish: Break and hold above 110,736.1 opens room for bullish continuation.
🔽 Bearish: A break back below 102,558.1 would suggest a potential shift toward 91,357.7 support.
📛 Disclaimer: This is not financial advice. Trade at your own risk.

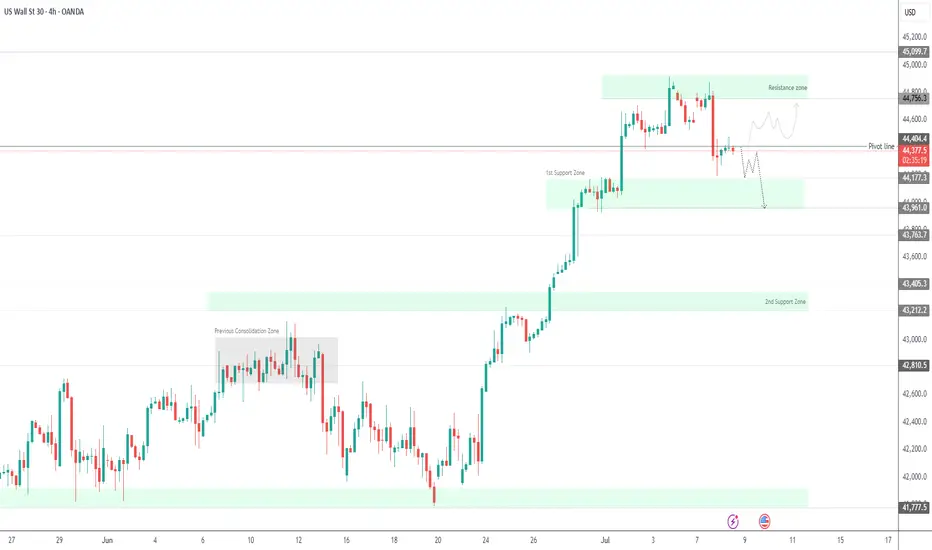
Dow Jones Below Key Pivot – Tariff Talks to Define Next MoveDow Jones – Overview
Fundamental Outlook:
In April, President Trump capped all so-called reciprocal tariffs at 10% until July 9, giving room for trade negotiations with key partners. That same month, the Nasdaq slipped into bear market territory, while the Dow and S&P 500 entered correction zones.
Since then, Wall Street has rebounded sharply. Last week, both the Nasdaq and S&P 500 surged to all-time highs, driven by a strong labor market that helped ease recession fears.
Technical Outlook:
Currently, Dow Jones is trading below the pivot level at 44410, which signals ongoing bearish momentum.
A sustained move below 44410 supports further downside toward 44180, with a break below this level opening the path to 43960.
However, if price reverses and closes above 44410 on the 1H or 4H timeframe, it may trigger a bullish move targeting 44750 and beyond.
Support: 44180 / 43960 / 43770
Resistance: 44515 / 44750 / 45100
Note:
Progress in tariff negotiations would likely support further upside in U.S. indices.
Lack of resolution may keep the Dow under bearish pressure in the short term.
Gold To The Basement? Week Ahead with Bearish Bias by PhoenixFX🌟 Welcome to Phoenix FX’s Intraday Pulse! 🌟
Hello, Phoenix FX family! 👋 I’m thrilled you’ve joined us for today’s TradingView chart breakdown. Our focus? Intraday opportunities—spotting those high-probability setups you can enter, manage, and leave to run whilst you concentrate on the things you love doing.
Here’s what you’ll find in this analysis:
Key Levels & Zones: Support, resistance, and Fair Value Gaps that matter on the smaller timeframes.
Price-Action Clues: Exact candlestick patterns and momentum signals to watch for your next entry.
Trade Triggers & Targets: Clear criteria for when to get in, where to take profits, and how to manage your risk.
Whether you’re hunting quick scalps or tactical swing moves, our goal is simple: help you trade with confidence, clarity, and community support. Got a different view or a fresh idea? Drop it in the comments—after all, “each one, teach one.” 😉
Let’s dive into the charts and make today’s market moves count! 🚀📈
Donald Trump’s presidency continues to exert outsized influence on gold through three main channels: trade policy uncertainty, fiscal stimulus (and resulting deficits), and shifts in safe-haven demand. Here’s how each factor has played out—and what it could mean for gold going forward:
1. Trade-War Uncertainty
What’s Happening: The Trump administration’s aggressive use of tariffs—including recent 25% duties on goods from Japan and South Korea—has periodically roiled markets and driven investors into gold as a safe haven. On July 7, gold pared losses after tariff news, as traders sought refuge despite a firm dollar.
Looking Ahead: If further tariff escalations or retaliations emerge, expect renewed spikes in gold. Conversely, any de-escalation or trade-deal breakthroughs could sap that safe-haven bid.
2. Fiscal Stimulus & Deficits
What’s Happening: Senate Republicans recently passed a Trump-backed tax‐and‐spending package projected to add $3.3 trillion to the U.S. deficit. Larger deficits—especially when financed by the Fed—tend to stoke inflation expectations, which bolsters gold’s appeal as an inflation hedge.
Looking Ahead: Continued large-scale stimulus or fresh tax cuts without offsetting revenue measures could keep real yields low (or negative), a classic tailwind for gold.
3. Safe-Haven Flows & Investor Positioning
What’s Happening: Despite peaking at record highs earlier this year, gold remains up roughly 30% since November, driven largely by investor fears around Trump’s policy unpredictability and geopolitical tensions.
Looking Ahead: Should Trump-era uncertainty persist—whether around trade, foreign policy, or domestic turmoil—gold is likely to retain its status as a portfolio diversifier and crisis hedge. A sustained drop in U.S. real rates or fresh bouts of market volatility would reinforce that trend.
🎯 Outlook Summary
Bullish Drivers: Ongoing trade-war rhetoric, larger deficits, and any new geopolitical flashpoints.
Bearish Risks: Clear resolution of major trade disputes, a pivot by the Fed toward earlier rate cuts (reducing real‐rate support for gold), or diminished investor fear.
------------------------------------------------------------------------------------------
PhoenixFX price action analysis based on the Daily time frame
🔴 Primary Resistance (Daily)
Zone: $3,348 – $3,400
Why It Matters:
Multiple daily closes have stalled here, leaving a clear Fair-Value Gap (dashed purple). Sellers are likely to defend this range until we see a decisive daily close above $3,400.
📉 Bearish Bias – Short Setups
Short at Resistance
Entry: Bearish daily reversal candle (engulfing, pin-bar) in $3,348–$3,400
Targets:
TP1: $3,290 (50% of Primary Buy Zone)
TP2: $3,250 (Primary Buy Zone low)
TP3: $3,172 (Secondary Buy Zone high)
Stop-Loss: Above $3,420
Breakdown Short
Trigger: Daily close below $3,250 (Primary Buy Zone low)
Entry: On the open of the next daily candle after close below $3,250
Targets:
TP1: $3,172 (Secondary Buy Zone)
TP2: $3,026 (Final Buy Zone 50% level)
Stop-Loss: Above $3,290
🔵 Potential Long Opportunities
Defensive Long (Aggressive)
Entry: Bullish daily rejection candle in $3,250–$3,290
Targets:
TP1: $3,348 (short-term resistance)
TP2: $3,400 (key resistance)
Stop-Loss: Below $3,230
Trend-Reversal Long (Ultra-Conservative)
Trigger: Daily close above $3,400
Entry: Open of the next daily candle after the close above $3,400
Targets:
TP1: $3,450
TP2: $3,500+
Stop-Loss: Below $3,360
📊 Week-Ahead Scenarios
Bearish Scenario (High Probability):
Price remains capped under $3,400.
Look for a bearish signal in $3,348–$3,400 to initiate shorts.
A break below $3,250 extends the move into deeper demand zones ($3,172 → $3,026).
Bullish Counter-Trend (Lower Probability):
Strong daily rejection candle in $3,250–$3,290 could spark a relief rally.
Short-term longs can target $3,348 and $3,400—ideal for quick swing trades.
Only a sustained daily close above $3,400 shifts the bias back to the upside.
Just a Heads-Up:
This is my take on the charts—not gospel, not financial advice, and definitely not a crystal ball 🔮.
Trading is part skill, part patience, and part “what just happened?” 😅
We all see things a little differently, and that’s the beauty of it. So if you’ve got a hot take, wild theory, or just want to drop some chart wisdom—hit the comments!
Let’s grow, learn, and laugh through the madness together. 🚀📈
Each one, teach one.
— Phoenix FX Team 🔥🦅

AUDUSD STARTED FORMING BEARISH TREND STRUCTUREThe AUD/USD pair has recently begun forming a bearish trend structure, signaling a potential continuation of downward momentum in the coming trading sessions. This shift in market sentiment is evident as the price has started printing lower lows, a key characteristic of a bearish trend. Lower lows indicate that sellers are gaining control, pushing the exchange rate downward with each successive decline. Traders and investors should remain cautious, as this pattern suggests further downside potential unless a significant reversal occurs.
On the lower side, the market is expected to test key support levels at 0.64500 and 0.63800. These levels may act as critical zones where buyers could attempt to step in, but if selling pressure persists, a breakdown could lead to an extended decline. A breach below these supports may open the door for deeper losses, reinforcing the bearish outlook. Conversely, if the pair finds stability near these levels, a short-term bounce or consolidation could occur before the next directional move.
On the upside, 0.65900 stands as a crucial resistance level. Any bullish retracement towards this zone could attract fresh selling interest, capping upward movements. A sustained break above this resistance would be necessary to invalidate the current bearish structure, potentially shifting the trend towards neutrality or even bullish reversal. Until then, rallies towards this resistance may present selling opportunities for traders aligning with the prevailing downtrend.
In summary, the AUD/USD pair is exhibiting bearish tendencies, with lower lows confirming seller dominance. The immediate targets lie at 0.64500 and 0.63800, while 0.65900 serves as a key resistance to watch. Traders should monitor price action around these levels for potential bearish continuation or signs of a trend reversal. Risk management remains essential, as unexpected macroeconomic developments or shifts in market sentiment could alter the current trajectory.

Gold Setup for longs and shorts This video covers gold on the local range whereby I expect price to eventually complete the move to the downside and clear the equal lows from MAy and June as well as take care of the poor lows and fill Quart Pivots .
I talk also about the Tradingview session volume profile chart and how this feature can really be a simple yet powerful guide for taking scalp trades off of specific levels and I show a couple of examples of the respect PA has for hitting those daily POC .
I Welcome any questions you may have

XAUUSD:Sharing of the Latest Trading StrategyAll the trading signals this week have resulted in profits!!! Check it!!!👉👉👉
Gold Market Analysis:
Overnight Dynamics: Following Trump’s reinstatement of tariffs, gold’s safe-haven demand drove another rally, but it still pulled back after facing pressure at the 3345 level. The decline extended today, requiring attention to the sustainability of safe-haven flows—recently, safe-haven-driven rallies have often been followed by pullbacks, so caution remains warranted for further gold corrections.
Technical Trends:
On the daily chart, gold continues to trade in a narrow range, with short-term moving averages essentially converging and flattening, suggesting a high probability of continued sideways movement in the near term.
The current range is temporarily compressed between 3285–3345, with the market bias leaning toward a "range-bound bearish" trend.
Trading Bias: Maintain a bearish stance on rebounds!
Trading Strategy:
Sell@3330-3320
TP:3300-3280

O'Reilly Automotive Quote | Chart & Forecast SummaryKey Indicators On Trade Set Up In General
1. Push Set Up
2. Range Set Up
3. Break & Retest Set Up
Notes On Session
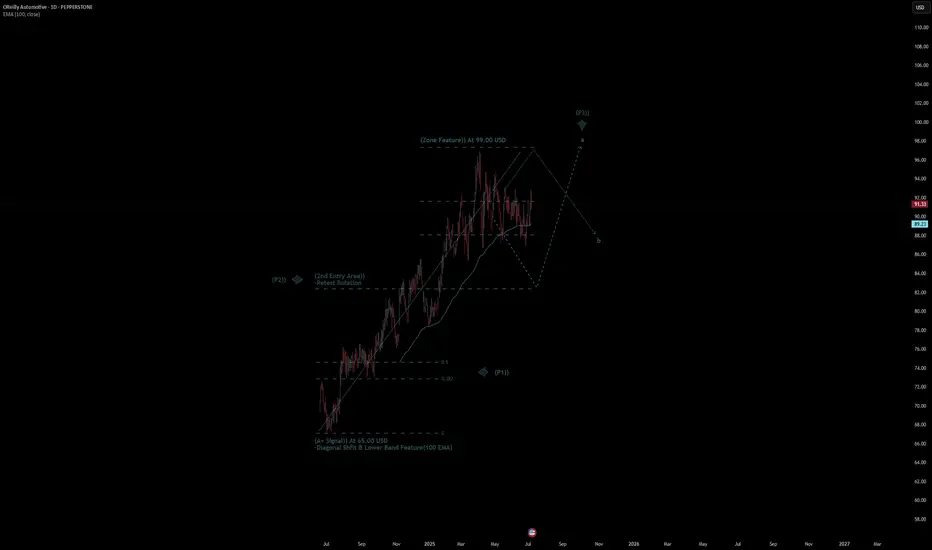
# Oreilly Automotive Quote
- Double Formation
* (A+ SIgnal)) At 65.00 USD | Completed Survey
* (Zone Feature)) At 99.00 USD | Subdivision 1
- Triple Formation
* (P1)) / (P2)) & (P3)) | Subdivision 2
* (TP1) = a / Long Consecutive Range
* (TP2) = b / Short Consecutive Pullback | Subdivision 3
* Daily Time Frame | Trend Settings Condition
- (Hypothesis On Entry Bias)) | Regular Settings
- Position On A 1.5RR
* Stop Loss At 85.00 USD
* Entry At 91.00 USD
* Take Profit At 100.00 USD
* (Uptrend Argument)) & No Pattern Confirmation
- Continuation Pattern | Not Valid
- Reversal Pattern | Not Valid
* Ongoing Entry & (Neutral Area))
Active Sessions On Relevant Range & Elemented Probabilities;
European-Session(Upwards) - East Coast-Session(Downwards) - Asian-Session(Ranging)
Conclusion | Trade Plan Execution & Risk Management On Demand;
Overall Consensus | Buy
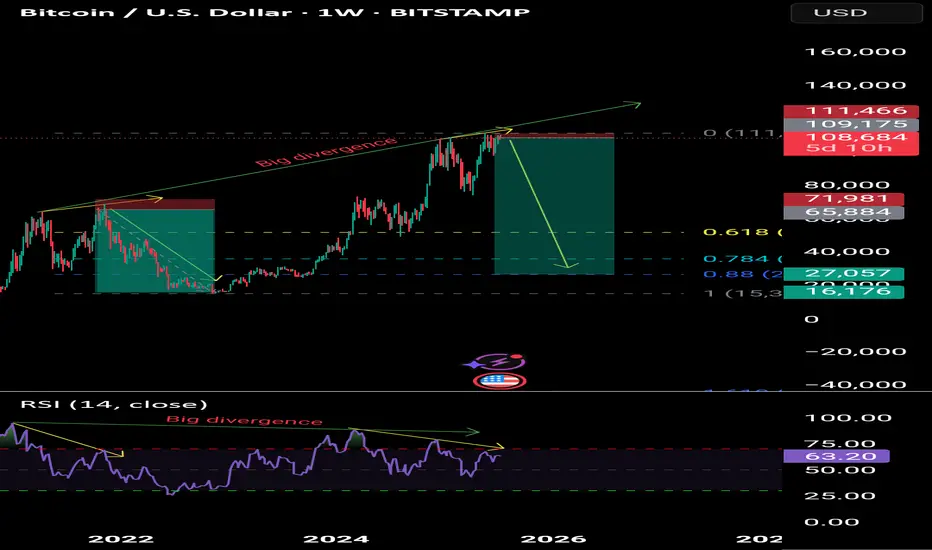
Bitcoin to the 30,000 levelBitcoin to the 30,000 level
On the weekly time frame, there is a negative divergence of Masoud and the winner is the one who keeps her sell trade below 30,000.
SHIB – One Last Chance for a MoveGiving CRYPTOCAP:SHIB one last shot to do something big.
It’s sitting at a strong pivotal level with some clean weekly SFPs forming.
A 2x looks doable, especially considering how well it’s been holding—though it may take time.
CRYPTOCAP:PEPE and CRYPTOCAP:DOGE are showing strength too, so SHIB isn’t alone here.
The key? CRYPTOCAP:BTC needs to cool off and give alts some breathing room over the next two months. Otherwise, BINANCE:SHIBUSDT could drop another 50%.

XLM – Bottom In, Eyes on $1+
XLM looks bottomed—hard to ask for a better setup than this.
Invalidation is clear: new lows. But as it stands, this is a clean weekly block retest that looks ready to launch.
From here, I’m expecting the move to begin.
See you above $1 CRYPTOCAP:XLM $XLMUSDT.
