GBPJPY - Bullish Bias • Waiting to Execute from LTFPair: GBPJPY
Bias: Bullish
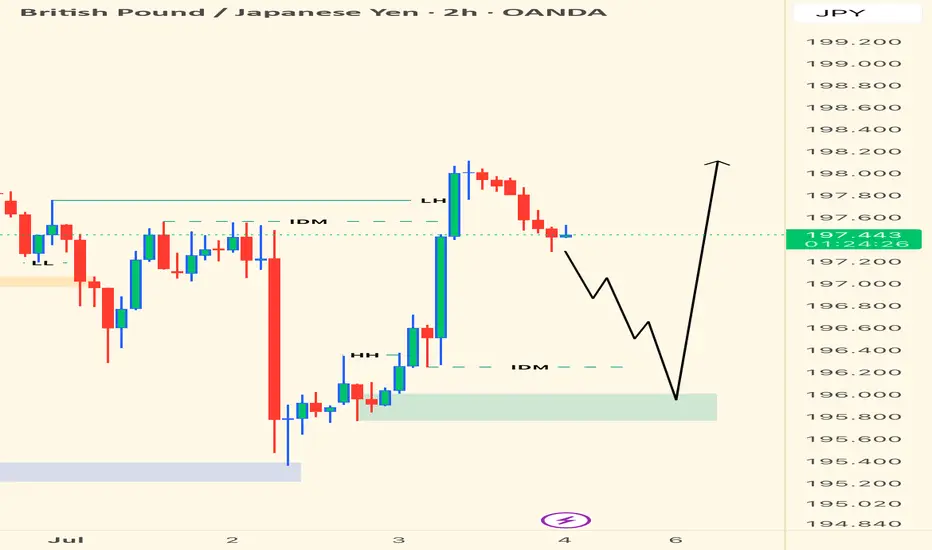
HTF Overview (2H): Price delivered the sweep I was patiently waiting for—textbook clean across multiple timeframes. The market has now tapped into the deeper range where real interest lies.
LTF Confirmation: All I need now is a structure shift + inducement on the 5M/1M to step in. I only move when the market shows its hand.
Entry Zone: Green zone marked on chart—expecting LTF sweep + shift before executing.
Targets: Short-term target is near the previous structure high around 198.200+.
Mindset Note: This setup has been cooking all week. Now the prep is done, I just need precision. Watching like a hawk. When it confirms—I strike.
Bless Trading!
Pivot Points
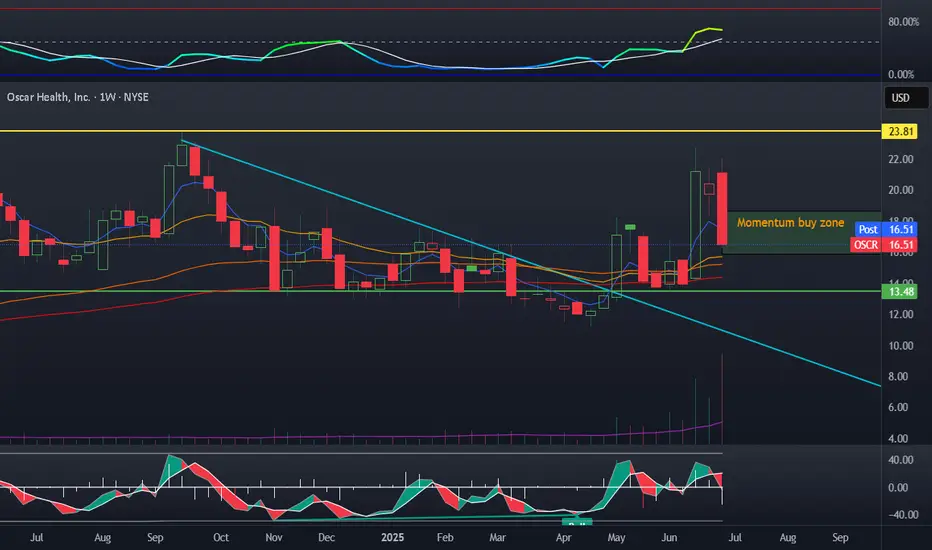
OSCR a buy OSCR I have added to the position after the correction. Ive had a few rounds of covered calls collected. We note a nice FUD based correction on the stock, this will allow stochastic to fall alongside volatility. This will also allow the moving averages time to catch up.
My plan:
Sold 16$ CSP, bought shares around 16$, sold covered calls when price was higher, today I also bought 20$ September calls.
Artyusdt buy opportunityARTYUSDT is currently trading within a descending broadening wedge formation, with price recently bouncing off the lower boundary. The structure suggests a continued move toward the upper boundary near the $0.915 zone. A breakout above the Immediate Internal Resistance Level (IIRL) would likely trigger strong bullish momentum, setting the stage for a move toward the projected target. Focus remains on the buy-back zone, which presents a strategic area for accumulation as the setup matures.

XAU/USD Struggles Below 3352, Bearish Pressure Remains ActiveXAU/USD Below Pivot, Watching 3352 for Bullish Confirmation
Gold prices edged up today as investors shifted their focus to the U.S. fiscal situation and lingering uncertainty ahead of the July 9 deadline when U.S. tariffs are set to take effect. But at the same time, we have strong resistance on the way.
The price continues to move below the pivot level and the 3352 resistance, which together form a strong supply zone.
A confirmed breakout above 3352 on the 4H candle is needed to validate a bullish move toward 3365. However, the possibility of a renewed decline remains unless the price also breaks above 3365, which would confirm a continuation of the upward trend.
The bearish trend remains active as long as the price trades below the pivot at 3348 and the 3352 level. Sustained trading below this zone would likely lead to a decline toward 3320 and 3313.
Key Technical Levels
Resistance: 3352 - 3365 - 3400.
Support Levels: 3320 - 3313 - 3218.
Pivot Line: 3348

K.I.S.S.Keep it simple stupid
My favourite market acronym. There's not a lot of price history to go on, just 1 trend line and some hidden bullish divergence. Tight stop loss below the trend

TRBUSDT Setup – Staggered Exits, Smart Profits📌 Entry: 36.70
🎯 TP1: +10% → Secure 50% of position
🛡️ Move to risk-free after TP1 to protect capital
🎯 TP2: Take 50% of remaining volume
🎯 TP3: Close all remaining volume
Calculated exits. Risk-managed. Momentum-ready.

Forterescue Ltd Quote | Chart & Forecast SummaryKey Indicators On Trade Set Up In General
1. Push Set Up
2. Range Set Up
3. Break & Retest Set Up
Notes On Session
# Forterescue Ltd Quote
- Double Formation
* (A+ SIgnal)) | Completed Survey
* (Diagonal Shift)) | Subdivision 1
- Triple Formation
* (P1)) / (P2)) & (P3)) | Subdivision 2
* (TP1) = a / Long Consecutive Range
* (TP2) = b / Short Consecutive Pullback | Subdivision 3
* Daily Time Frame | Trend Settings Condition
- (Hypothesis On Entry Bias)) | Indexed To 100
- Position On A 1.5RR
* Stop Loss At 74.00 USD
* Entry At 67.00 USD
* Take Profit At 57.00 USD
* (Uptrend Argument)) & No Pattern Confirmation
* Ongoing Entry & (Neutral Area))
Active Sessions On Relevant Range & Elemented Probabilities;
European-Session(Upwards) - East Coast-Session(Downwards) - Asian-Session(Ranging)
Conclusion | Trade Plan Execution & Risk Management On Demand;
Overall Consensus | Sell

CAD/JPY Bearish Trend Analysis – Key Levels to Watch CAD/JPY Bearish Trend Analysis – Key Levels to Watch
The CAD/JPY pair is currently moving in a bearish trend structure, indicating a weakening of buying pressure in the market. This suggests that sellers are gaining control, and the pair is likely to remain under downward pressure in the upcoming trading sessions. Traders should prepare for potential further declines unless a significant reversal pattern emerges.
Bearish Momentum Signals Downside Risk
Recent price action shows that the pair has been struggling to sustain upward movements, with lower highs and lower lows reinforcing the bearish bias. The weakening buying pressure is evident from the lack of strong bullish candles and diminishing volume on upward retracements. This signals that any short-term recoveries may be limited, and the downtrend could resume.
Key Support and Resistance Levels
- Downside Target: The next major support level to watch is 104.900. If selling momentum accelerates, this level could be tested in the coming sessions. A break below this support may open the door for further declines toward lower psychological levels.
- Upside Resistance: On the higher side, 106.150 stands as a critical resistance level. Any bullish retracement toward this zone could attract fresh selling pressure, keeping the bearish structure intact unless convincingly broken.
Trading Strategy Considerations
- Short Opportunities: Traders may consider short positions on pullbacks toward resistance, particularly near 106.150, with a downside target of 104.900.
- Risk Management: A break above 106.150 could invalidate the bearish outlook, signaling a possible trend reversal or consolidation. In such a scenario, stops should be adjusted accordingly.
Conclusion
The CAD/JPY pair remains bearish, with 104.900 as the next key downside target. Resistance at 106.150 is crucial for maintaining the downtrend. Traders should monitor price action around these levels for confirmation of continued bearish momentum or a potential reversal. Stay cautious and trade with disciplined risk management.

Fox Corp Class B Quote | Chart & Forecast SummaryKey Indicators On Trade Set Up In General
1. Push Set Up
2. Range Set Up
3. Break & Retest Set Up
Notes On Session
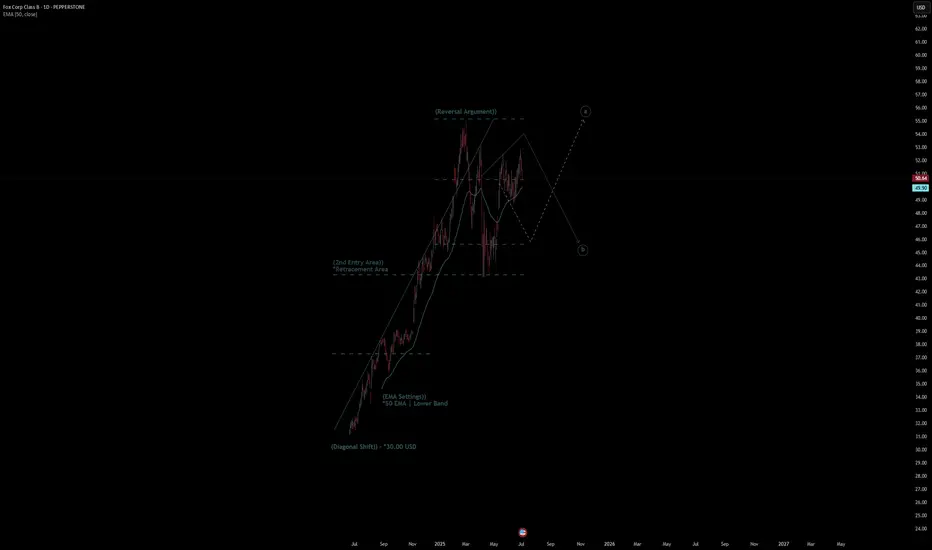
# Fox Corp Class B Quote
- Double Formation
* (Diagonal Shift)) - *30.00 USD | Completed Survey
* (2nd Entry Area)) | Subdivision 1
- Triple Formation
* (P1)) / (P2)) & (P3)) | Subdivision 2
* (TP1) = a / Long Consecutive Range
* (TP2) = b / Short Consecutive Pullback | Subdivision 3
* Daily Time Frame | Trend Settings Condition
- (Hypothesis On Entry Bias)) | Regular Settings
- Position On A 1.5RR
* Stop Loss At 45.00 USD
* Entry At 50.00 USD
* Take Profit At 58.00 USD
* (Uptrend Argument)) & No Pattern Confirmation
* Ongoing Entry & (Neutral Area))
Active Sessions On Relevant Range & Elemented Probabilities;
European-Session(Upwards) - East Coast-Session(Downwards) - Asian-Session(Ranging)
Conclusion | Trade Plan Execution & Risk Management On Demand;
Overall Consensus | Buy
Analysis on circle using tpo and regular chart longs and shortMust watch video giving 2 really nice Risk reward entries on the Newley listed stock Circle
In this video I highlight a region using limited data of where to get filled if you missed the IPO and want to buy some circle .
We are currently in a no trade zone for buyers as I anticipate that price will gravitate down to the .786/.886 level over time .
In this video I also use the TPO chart "Time price opportunity" and demonstrate what i am looking for from using this type of chart to add to my confluences for a high probability trade .
Also identified in the chart is a short trade off of the weekly pivots and the value area high of the range .
Thankyou for watching and i welcome any questions

Samsara’s IoT Surge: A Fleet Management Play with Space to GrowSamsara NYSE:IOT , a trailblazer in the Internet of Things (IoT) for fleet management, has been turning heads since its 2021 IPO. With a market cap hovering around $17 billion and its stock quadrupling since debut, the company is riding high on analyst optimism. But beyond the hype, what’s driving Samsara’s ascent-and what risks lie ahead?
From Startup to IPO Star: Samsara’s Journey
Founded in 2015 by Sanjit Biswas and John Bicket-veterans of the tech world who sold their previous startup, Meraki, to Cisco-Samsara hit the ground running. By 2018, it was a unicorn valued at $1 billion, and in 2021, it raised $805 million in a high-profile IPO, catapulting its valuation to $11.5 billion. Fast forward to today, Samsara's shares rose sharply if we compare it to its IPO price, demonstrating and reinforcing investor confidence in its growth.
The Business: IoT Meets Fleet Management
At its core, Samsara offers cloud-based platforms that help logistics and transportation companies optimize operations. Using a mix of cameras, GPS, and AI-powered sensors, its solutions provide real-time insights into vehicle location, driver behavior, and asset tracking. In 2019, the company introduced AI-driven dashcams to monitor driver safety, and by 2021, its subscription revenue topped $300 million with 20,000 customers.
Samsara got a lot of innovations, but what is the latest one? Bluetooth tags for tracking smaller assets, expanding its reach beyond vehicles to parcels and inventory. With annual recurring revenue (ARR) hitting $1.1 billion in 2024 and growing 35% year-over-year, the company’s momentum is undeniable.
Financial Status: Growth with a Profitability Horizon
Samsara’s financials paint a picture of rapid expansion. In Q3 2025, revenue jumped 36% to $322 million, while ARR climbed to $1.349 billion. Gross margins sit at a healthy 73%, and free cash flow is positive—a rarity for high-growth tech firms. Customer growth is equally impressive: the number of large clients (those spending over $100,000 annually) rose 30% in 2024.
Nevertheless, we should note that Samsara remains unprofitable, with net losses narrowing but still present. The company is laser-focused on scaling, reinvesting heavily in R&D and customer acquisition. Analysts expect it to reach breakeven soon, but the timeline still remains a wildcard.
Market Opportunity: A $100 Billion TAM Beckons
Samsara’s addressable market is vast. The Total Addressable Market (TAM) for fleet management and logistics IoT is estimated at $50 billion, with Samsara capturing just 1% of it. Expand that to adjacent sectors-manufacturing, industrial operations-and the TAM balloons to $100 billion. With a market share of only 1%, the runway for growth is immense.
The company’s leadership in its niche is clear, though rivals like Geotab (10% market share) and Verizon Connect NYSE:VZ loom large. Samsara’s edge? A relentless focus on innovation, as seen in its AI-powered Samsara Intelligence platform and partnerships with heavyweights like DHL and Tyson Foods.
Risks to Watch
High-growth tech isn’t without pitfalls. Samsara faces stiff competition in a crowded field, and its reliance on rapid scaling leaves little room for error. Regulatory hurdles, especially around data privacy, could also emerge as IoT adoption spreads. Plus, the company’s unprofitability-while shrinking-remains a concern for risk-averse investors.
A Growth Story with Legs
At $39 per share, Samsara trades below its all-time high, but analysts see plenty of upside. Wells Fargo and Piper Sandler peg its target at $54-$55, with a consensus forecast of $49.50. Samsara NYSE:IOT offers a compelling blend of innovation, market leadership, and a massive TAM. But it’s not a slam dunk-competition and profitability hurdles loom. Still, for those betting on the IoT revolution, Samsara’s growth engine looks hard to ignore.

MEW Main Trend. Memcoin. 2025 07 02Logarithm. Time frame 3 days.
Cat in a dogs world (MEW)
X -133 thousand subscribers (this is not enough).
Reduction from the maximum -87%. For such assets, this is not enough.
I imposed a descending channel on the chart (current descending trend of the main trend), and a horizontal one, if by some miracle this local Ross hook is broken upwards (not forming a local head and shoulders), not only to the resistance of the secondary trend (red line), but to break through it. Percentages to key zones of support/resistance levels are shown for clarity.
After the downward trend is broken, such "psychological-fundamental" assets are usually pumped up by +800-1000% from the minimums or more. Low liquidity, and the contingent of people who subscribe to these projects, allows this to be done easily at the right time: "the hamster is not scared". After pumping — a slow death, with pumps an order of magnitude smaller. Therefore, do not forget to sell in the alt season.
When working with such cryptocurrencies by liquidity, observe money management, use partial entry or on a breakout. Do not use margin leverage, as there may be snot in any direction for a large percentage, which will lead to liquidation "out of the blue".

Plata’s Bond Debut: A Bet on Mexico’s Digital Banking BoomMexico’s digital banking industry is gaining momentum, and Plata, a fast-emerging fintech player, is making waves with its debut bond issuance. Targeting $120 million (with the potential to scale up to $200 million) marks a turning point for a company transitioning from a credit card issuer to a full-fledged digital bank. For us, it’s a chance to tap into the growth of financial inclusion in Latin America’s second-largest economy. But with high rewards come risks we must note, as usual. So, here’s what we need to know about Plata and its latest move.
From Credit Cards to Banking: Plata’s Evolution
Plata started in 2023 as a credit card issuer, focusing on Mexico’s underbanked population—a segment that makes up roughly 60% of the country’s 130 million people. By December 2024, Plata secured a banking license from Mexican regulators, a game-changer that allows it to issue loans directly from its balance sheet and, starting in 2026, accept deposits upon meeting specific conditions. The change has undoubtedly expanded the company's scope of activity and its revenue potential.
The company’s flagship product, the Plata Card, offers an average credit limit of $10,000 at interest rates exceeding 30%, targeting small loans averaging $200 per customer. With 1.5 million cardholders by mid-2025, Plata has built a diversified portfolio designed to be manageable for its target market. Backed by $450 million in equity financing, including a hefty 70% stake from Baring Fintech Private Equity Americas Fund, Plata also boasts a management team with roots from Tinkoff Bank—a fintech known for its innovative, customer-first approach. For a more convenient analogy, this business model is very similar to that used by the American bank Capital One NYSE:COF , allowing customers to manage their finances entirely through digital channels, from opening an account to investing, without visiting branches. Most services are digitally oriented.
The Bond Offering: Terms and Appeal
Plata’s bond issuance introduces a three-year, senior unsecured note featuring a callable structure, designed to stimulate its growth ambitions while offering investors a compelling opportunity. The offering begins at $120 million, with the flexibility to expand to $200 million, indicating confidence in its market reception. The bond carries a tenor of three years, with call options kicking in after 18 months at 106% of par value, gradually declining to 101% near maturity, signaling the issuer’s optimism about achieving early repayment as the business scales. Initially marketed with a 16% coupon rate, investor demand briefly pushed expectations toward 12%, though the final rate is anticipated to stabilize between 15% and 16%, paid semi-annually, which underlines the bond’s high yield potential, stemming from Mexico’s emerging market dynamics and Plata’s nascent stage. A put option further enhances its appeal, allowing bondholders to exit at 101% if a change of control occurs, providing a safety net against ownership uncertainties. While this structure attracts yield-hungry investors, liquidity poses a challenge, as the minimum trading lot of $125,000 and settlement through a Norwegian central securities depository—linked to Euroclear via Scandinavian banks—may restrict secondary market activity.
Financial Snapshot: Growth at a Cost
Plata’s financials reflect the classic fintech tradeoff: heavy upfront investment for long-term gains. The company has burned through $260 million of its $450 million equity raise over three years, a planned cash burn to fuel customer acquisition and technology development. Despite this, Plata’s loan portfolio yields a net contribution margin of around 2%, and it’s on track to break even by Q2 2028.
Credit quality is improving, too. In June 2023, 33% of new cardholders defaulted after their first payment—a steep learning curve. By 2025, sharper underwriting has slashed non-performing loans (NPLs) to 15%, a manageable level given the 70% gross yield on its products. With an equity ratio projected at 22%, Plata’s capital cushion looks robust for a growth-stage bank.
Mexico’s Underbanked Opportunity
Mexico’s banking sector is ripe for disruption. Traditional banks have been slow to serve the underbanked, leaving room for digital players like Plata to step in. Leveraging an app-only platform and rapid credit card delivery, Plata follows successful footsteps of Tinkoff’s or the more well-known Capital One model, adapted for Mexico’s unique market. The company’s IT backbone, partly based in Cyprus at the upscale Trinity building, underscores its tech-driven approach. The company’s IT backbone, partly based in Cyprus at the upscale Trinity building, underscores its tech-driven approach.
Competition is intensifying, with established banks and other fintechs vying for the same customers. Yet Plata’s early traction—1.5 million users in two years—and its focus on small, accessible loans give it an edge. If it can scale while keeping NPLs in check, Plata could capture a sizable slice of this underserved market.
Risks to Watch
The allure of high yields comes with significant uncertainties, given Plata’s short operational history and heavy reliance on rapid expansion. The company faces potential threats from Mexico’s economic volatility, where currency fluctuations and macroeconomic instability could erode profitability, alongside the risk of regulatory shifts in banking or fintech that might upend its business model. Credit risk remains a concern, as a surge in possible defaults could pressure its balance sheet despite recent improvements in loan performance, while the bond’s modest $120 million size and reliance on a Norwegian depository could deter some investors and limit liquidity in the secondary market. Nevertheless, Plata’s credibility is bolstered by its backers at Baring Fintech, a firm with a successful track record supporting companies like Kaspi NASDAQ:KSPI and Revolut, which lends a degree of reassurance. Additionally, the bond’s flexible structure, with call and put options, helps mitigate some of these risks, offering both the issuer and investors strategic adaptability in navigating this high-stakes venture.
The Verdict: A High-Yield Play with Caveats
Plata’s bond debut is a pretty well entry point into Mexico’s digital banking surge. A 15-16% yield is hard to ignore, especially with a clear path to profitability and strong equity support. For investors comfortable with emerging market risk, it’s an opportunity to support a fintech with it big digital potential in a market begging for innovation.
But look first, then leap as some say. Thin liquidity and credit uncertainties mean this isn’t a casual investment. Those considering it should weigh the upside—growth in an underbanked hotspot—against the downside of a young bank in a volatile region. For the right portfolio, Plata’s bonds could be a calculated win. Just don’t expect a smooth ride.

Tesla Drop Pressures Nasdaq – 22,470 Key to Hold RecoveryUSNAS100 | Overview
Tesla dropped approximately 5%, weighing heavily on the Nasdaq, amid public tensions between Elon Musk and Donald Trump.
Yesterday, the price declined below 22,610 due to the impact of Tesla’s fall but remained above 22,470. As long as it trades above this level, a recovery attempt is likely, with the price expected to break through the consolidation zone between 22,615 and 22,740.
However, if the 1h candle closes below 22,470, the bearish trend is expected to continue toward 22,280 and potentially lower.
Pivot: 22,470
Resistance: 22,615 – 22,740 –23,000
Support: 22,280 – 22,200

Bitcoin STANDING..bitcoin now is standing on monthly pivot and hold that as the support.
3rd pivot's resistance is at 124k is reachable in few weeks.

Dow Reverses for Pullback, Bullish Case Valid Above 44,400US30 OVERVIEW
Dow Jones Maintains Uptrend, Poised for Retest and Potential Extension
Dow Jones futures edged up by 69 points early Wednesday, signaling cautious optimism as investors shifted focus away from technology stocks to kick off the second half of the year.
The price continued its bullish trend until it reached the resistance zone, then reversed for a correction, falling below 44,630. Remaining below this level could extend the correction toward 44,400, which now serves as key support and pivot line for confirming a bearish trend.
As long as the index trades above 44400, the bullish trend remains intact, targeting 44,630, and potentially crossing the resistance zone within 44760 and 44920.
Resistance Levels: 44,630 → 44760 → 44920.
Support Levels: 44400 → 44120 → 43960.
How to Trade Liquidity Sweep in Forex Market (SMC Trading)
I will show you a real example of trading liquidity sweep with Smart Money Concepts.
You will learn the essential SMC liquidity basics, a simple and profitable strategy to identify and trade liquidity sweep.
I will share with you an accurate entry confirmation signal that works perfectly on any Forex pair.
Liquidity Basics
In order to trade liquidity sweeps profitably, you should learn to identify significant liquidity zones.
To spot them, analyze a historic price action and find clusters of important historic key levels.
Examine a price action on EURUSD on an hourly time frame.
I underlined multiple horizontal key levels.
The price respected each level, found support on them, and rebounded.
What is so specific about these levels is that they are lying close to each other, composing a liquidity cluster.
That fact that EURUSD strongly bounced from these levels suggests that buying interest and high buying volumes were concentrated around them.
We can unite these levels and treat them as a single demand zone that has just been broken and turned into a supply zone.
After we found a valid liquidity zone, we can look for a liquidity sweep.
First, we should let the price approach that area and look for a specific price behavior then.
That is a perfect example of a liquidity sweep.
You can see that the price formed a wide range candle with a long tail.
Its high went way beyond the underlined area, but its body closed within.
In order to understand, why a liquidity sweep occurred, let's zoom in our chart and try to understand a behavior of the market participants.
Our supply zone concentrated selling orders , we assume that sellers were placing their orders across its entire length.
Their stop losses were presumably lying above that area.
Smart Money know that and with a liquidity sweep they manipulate the market, making sellers close their positions in a loss (buying back their positions from the market) and providing a liquidity for big players.
After a formation of a such a candlestick, a reliable confirmation of a saturation of the Smart Money is a formation of a strong bearish candle - a clear sign of strength of the sellers.
A bearish engulfing candle above confirmed a completion of a liquidity sweep and indicates a highly probable bearish continuation.
Your perfect sell entry is immediately after a close of such a candlestick.
Stop loss should strictly lie above the high of a liquidity sweep.
Take profit is based on a local low.
Look, how quickly the price reached the goal.
Your strategy of trading liquidity sweeps of demand zones is absolutely the same.
Let the price test a demand zone, wait for a formation of wide range bearish candle with a tail going below its lows.
Wait for a bullish imbalance candle and buy immediately then.
Stop loss will be below the low of a liquidity sweep, take profit - a local high.
This SMC strategy works on any time frame and can be applied for trading any Forex pair, Gold, Silver, Crypto and commodities.
Try it by your own and let me know your results.
❤️Please, support my work with like, thank you!❤️
I am part of Trade Nation's Influencer program and receive a monthly fee for using their TradingView charts in my analysis.

BITCOIN STRATED FORMING BEARISH TREND STRUCTUREBITCOIN SHOWS SIGNS OF BEARISH REVERSAL – KEY LEVELS TO WATCH
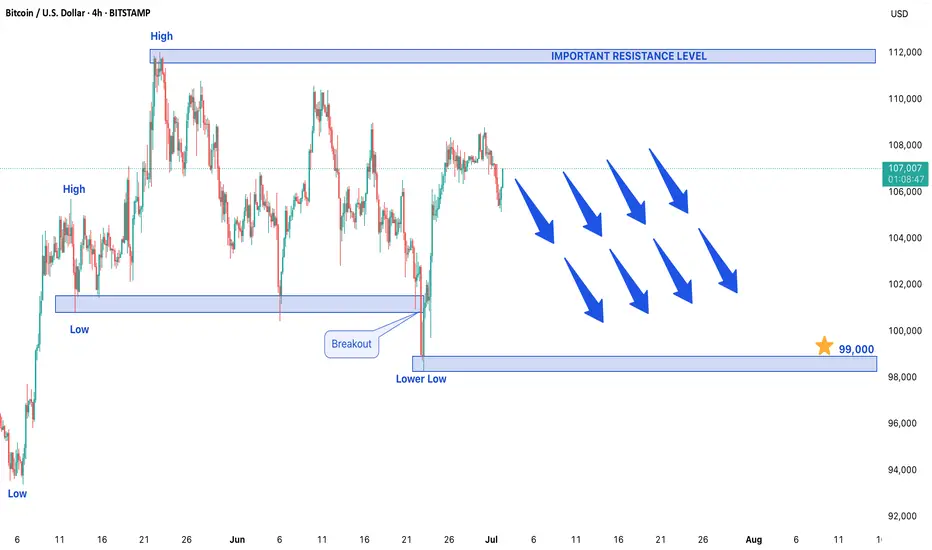
After an extended bullish run, Bitcoin is now showing early signs of a potential trend reversal as the market begins forming a bearish structure. The formation of a lower low on the price chart indicates weakening bullish momentum and suggests that sellers may be gaining control. This development comes after a sustained upward trend, signaling that a corrective phase could be underway in the cryptocurrency market.
Bearish Confirmation: Lower Low Formation
The appearance of a lower low is one of the most reliable technical indicators of a trend reversal. This pattern demonstrates that bears are successfully pushing prices below previous support levels, establishing a new downward trajectory. While this doesn't necessarily confirm a long-term bear market, it does suggest that Bitcoin could face further downside pressure in the near term. Traders should watch for confirmation through follow-through selling or additional bearish candlestick patterns.
Downside Target: $99,000 in Focus
If the bearish momentum continues, Bitcoin could test the $99,000 support level in upcoming trading sessions. This level represents a psychologically important zone where buyers may attempt to step in. However, a decisive break below this support could accelerate declines, potentially leading to deeper corrections. Traders should monitor volume and price action around this level for signs of either consolidation or continuation of the downtrend.
Resistance Level: $12,000 as Key Barrier
On the upside, $12,000 now acts as a critical resistance level. Any short-term rallies toward this zone could attract renewed selling pressure, reinforcing the bearish outlook. For the current downtrend to be invalidated, Bitcoin would need to reclaim and sustain above this resistance with strong buying volume. Until then, traders may consider selling into strength near this level while maintaining tight risk management.
Market Outlook: Correction Expected After Prolonged Rally
Given Bitcoin's history of volatile price swings, this potential reversal should not come as a complete surprise after its extended bullish run. Market participants should watch for:
- Increasing trading volume on downward moves (confirming bearish conviction)
- Potential bearish continuation patterns (like descending triangles or flag formations)
- Macro factors that could influence crypto markets (regulatory news, ETF flows, or macroeconomic shifts)
Conclusion
Bitcoin appears to be entering a corrective phase, with $99,000 as the next key downside target and $12,000 serving as major resistance. While the broader uptrend may still be intact long-term, short-term traders should prepare for potential bearish continuation. As always, proper position sizing and stop-loss strategies remain crucial in navigating Bitcoin's inherent volatility. A break above $12,000 would require reassessment of the bearish outlook.
U.S. dollar index DXY analysis- daily time frame ✅ U.S. Dollar Index (DXY) Analysis — Daily Timeframe
👤 A TVC:DXY trader’s perspective:
When I look at this chart, several key points immediately stand out:
1️⃣ Long-Term Trend
On the weekly and daily timeframe, the major trend has turned bearish after peaking around 114. We see a clear series of lower highs and lower lows confirming the downtrend.
The sharp rally from 89 to 114 in the past was a strong impulsive move, which is now undergoing a deep correction. Currently, price is hovering around a major historical support near 96.
2️⃣ Key Support Zone
The current price near 96.7 is sitting right at a significant support area that has triggered considerable buying interest in the past.
If this support decisively breaks, the green zone marked as DD (around 93–95) represents a strong long-term demand zone and will likely be the next liquidity target for buyers.
3️⃣ Resistance (Supply Zones)
The four red-marked 4HR zones between 97 and 101.9 clearly show significant supply zones where sellers have stepped in on lower timeframes.
Should the price attempt a bounce from current levels, these resistance areas may act as a strong barrier to further upside.
4️⃣ Price Structure and Liquidity
Looking more closely, the market seems to be moving from a consolidation phase toward lower support liquidity. That means there is a high probability of a liquidity grab toward the 93–95 area before a potential fresh bullish leg.
At higher levels, unless the price can break and hold above 98 and then 100, we cannot confirm a trend reversal.
🔹 Summary
✅ Overall downtrend remains dominant
✅ 96–97 is a critical support zone
✅ A break below this support targets 93–95
✅ Trend reversal only possible with a confirmed break and hold above 98, and then 100–101
✅ The 4HR resistance zones (97–101) are strong hurdles for any bullish retracement
✅ As long as price remains below 98, any rally is likely just a corrective move
⚠️ Disclaimer: This analysis is for educational and informational purposes only and does not constitute financial advice or a recommendation to buy or sell. All trading decisions are solely your own responsibility.

USDJPY| - Weekky OutlookBias: Bullish
HTF Overview (4H):
Price has shown bullish intent by breaching a major internal high and taking out significant sell-side liquidity (SSL) before mitigating the 4H order block below. This suggests a bullish narrative is forming, even though the 4H swing high hasn’t been taken yet.
LTF Confirmation (30M):
Currently showing bearish momentum. I’ll wait for a clean CHoCH to confirm shift in intent. Once price sweeps liquidity and mitigates a valid 30M OB, I’ll look for entries.
Entry Zone:
After liquidity sweep + OB mitigation on 30M (or refinement on 5M), I’ll execute the setup.
Targets:
• Scalp: 5M structure highs
• Short-Term Hold: 30M structure highs
• Extended Hold: 4H structure highs (if price action is strong)
Mindset Note:
Structure tells the story, but price action confirms whether it’s worth riding. Even when structure looks awkward, respect is often still given—so stay fluid, but focused.
Bless Trading!

#GBPUSD: Detailed View Of Next Possible Price Move! GBPUSD exhibited a favourable movement after rejecting a pivotal level previously identified. We anticipate a smooth upward trajectory, potentially reaching approximately 1.45. Conversely, the US Dollar is on the brink of collapse around 90, which will directly propel the price into our take-profit range.
During GBPUSD trading, it is imperative to adhere to precise risk management principles. Significant news is scheduled to be released later this week.
We kindly request your support by liking, commenting, and sharing this idea.
Team Setupsfx_

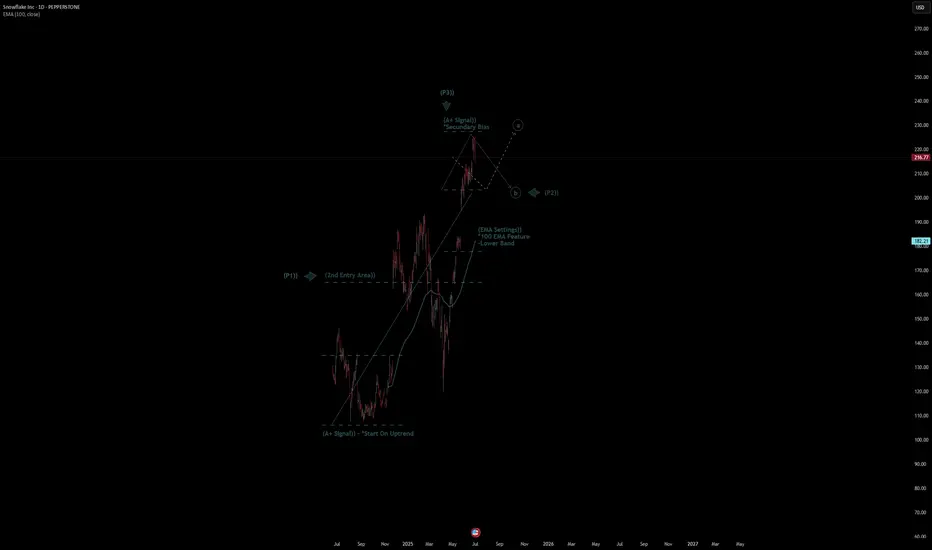
Snowflake Inc Stock Quote | Chart & Forecast SummaryKey Indicators On Trade Set Up In General
1. Push Set Up
2. Range Set Up
3. Break & Retest Set Up
Notes On Session
# Snowflake Inc Stock Quote
- Double Formation
* (A+ SIgnal)) - *Start On Uptrend | Completed Survey
* (2nd Entry Area)) | Subdivision 1
- Triple Formation
* (P1)) / (P2)) & (P3)) | Subdivision 2
* (TP1) = a / Long Consecutive Range
* (TP2) = b / Short Consecutive Pullback | Subdivision 3
* Daily Time Frame | Trend Settings Condition
- (Hypothesis On Entry Bias)) | Regular Settings
- Position On A 1.5RR
* Stop Loss At 201.00 USD
* Entry At 216.00 USD
* Take Profit At 240.00 USD
* (Uptrend Argument)) & No Pattern Confirmation
* Ongoing Entry & (Neutral Area))
Active Sessions On Relevant Range & Elemented Probabilities;
European-Session(Upwards) - East Coast-Session(Downwards) - Asian-Session(Ranging)
Conclusion | Trade Plan Execution & Risk Management On Demand;
Overall Consensus | Buy
XAU USD 2HR CHART ANALYSIS 🔎 XAUUSD (Gold Spot) 2H Chart Analysis:
✅ Price recently made a strong bullish rally up to the resistance zone between 3346–3368.
✅ A supply zone has been marked in this area, which is currently causing a bearish reaction.
✅ BOS (Break of Structure) and ChoCH (Change of Character) labels on the chart indicate that the overall market structure has been bearish, and price has now retraced to this supply area for a potential pullback.
✅ The trader appears to have taken a short position with a stop loss around 3368 and a target around 3259, giving a risk-reward ratio of approximately 1:3.
---
🔎 Possible Scenarios:
✅ Bearish Scenario (preferred):
If the supply zone at 3346–3368 holds and price rejects from there, the logical target could be the previous support near 3259, in line with market structure and bearish momentum.
✅ Bullish Scenario (invalidation):
If price breaks above 3368 with strength and confirms a candle close above, that would invalidate the supply zone, and the uptrend may resume toward higher levels around 3418 (previous highs).
---
🔎 Key Levels:
✔️ Resistance (Supply Zone): 3346–3368
✔️ Support (Demand Zone): 3259–3244
✔️ Market Structure: bearish, with a pullback into supply
✔️ Stop loss (for the short): above 3368
✔️ Target: around 3259
---
This analysis is not financial advice and does not constitute a trade recommendation.
OANDA:XAUUSD
