XAUUSD BUY SETUPHere the price action shows bullish shift at M15 so we wait to retest at our zone to enter buy .
Please follow to support me .
Thank you !
Pivot Points

USDT DOMINANCE New Update (4H) First of all you should know that "USDT Dominance" is always moving inverse of BTCUSDT .
In this analysis, we want to examine this index on lower timeframes. It has reached a support zone and a trendline.
Ideally, we should see a pullback from the green box toward the red box.
There is a high chance of price rejection from the red box to the downside, which could lead to a bullish move in the market.
Let’s see how the price reacts to the red box.
For risk management, please don't forget stop loss and capital management
Comment if you have any questions
Thank You

GBPJPY| Midweek OutlookEven though it’s midweek, I wanted to share an update on GBPJPY and walk you through the process so far.
Price has been showing clear bullish structure from the 4H down to the 30M, so I remained patient and waited for price to revisit and mitigate a bullish order block — and that’s exactly what we got.
Now that mitigation has played out, I’m watching closely for LTF confirmations to line up. Ideally looking for entry opportunities around 196.006 – 195.922, depending on how the lower timeframes react and confirm.
Not rushing anything — just executing based on structure, mitigation, and confirmation. I’ll continue updating as price develops.
#GBPJPY #SMC #OrderBlock #SmartMoneyConcepts #PriceAction #ForexTrading #GJSetup #MidweekOutlook #InducementKing #DayTrader
Bless Trading!

EURJPY: A Big Move In Making, Please Share Your Views! Date: 22/06/2025
Hello everyone,
I hope you’re all having a good weekend. As we previously discussed, we expected a sharp decline in Europe/JPY, but unfortunately, it didn’t work out in our favour due to the extremely bullish US dollar. This led to the crossing and invalidation of our two selling zones.
Looking at next week’s price projection, we can confirm that the price is heading towards 170.50 and may be selling at this level. Therefore, we will be keeping a stop loss at 171.50.
Once the trade is activated, we can set our target at 166.0, 163.50, and the final target will be placed at 158.50.
If you like our work, please like our idea.
Good luck and trade safely next week.

Oil Price: Breakout or Fakeout? Watch This Zone Closely Technical Overview:
The current price action is testing the upper boundary of a descending wedge, a bullish reversal pattern. The recent strong green candle indicates a potential breakout attempt, yet price is hovering near a critical resistance level at $74.20 (Fib 0.5).
Key levels from the Fibonacci retracement are:
🔼 Resistance at $74.20 (0.5), then $78.16 (0.618)
🧲 Local support at $69.78 (0.382)
🛡️ Strong demand zone near $63.81 (0.236) if rejection occurs
Structure + Patterns:
Price has been compressing inside a falling wedge, which statistically resolves to the upside.
The breakout candle broke above the 20 EMA and touched the upper wedge resistance — signaling a decision point.
Volume is rising on bullish candles — initial confirmation of buyer interest, but not yet decisive.
Scenarios to Watch
Bullish Case:
Break and close above $74.20 on higher volume → likely move toward $78–$86 resistance zone.
Confirmation of wedge breakout could trigger trend reversal, aligning with bullish fib levels.
Momentum could accelerate if macro factors support demand (see geopolitics below).
Bearish Case:
Failure to close above $74.20 = fakeout risk → price may reject down to $69.78 or even retest $63.81.
Bearish rejection wick on the daily/4H would be an early signal.
Macro & Geopolitical Factors to Monitor:
Middle East Tensions: Any escalation (especially around Iran or shipping lanes) could spike oil due to supply fears.
US Strategic Reserves & Elections: Moves to refill reserves or control inflation could support demand.
China Demand Recovery: Data showing improved industrial output or stimulus from PBoC may strengthen global oil outlook.
Final Thoughts:
Price is at a pivot zone — breaking this wedge with strength could shift the short-to-midterm trend. Until then, this remains a "show me" breakout . Watch how the next 1–2 weekly candles close around the $74–$75 area to confirm direction.

Fintech or Government Regulation? — A Perspective from MacromicsStablecoins have evolved from a supplementary tool into a cornerstone of the digital economy. They are used in DeFi, cross-border settlements, and provide liquidity in crypto markets. Today, the question is not whether stablecoins are needed, but who will control them — private fintech companies or government regulators.
Fintech: Flexibility, Speed, Innovation
Projects like USDC, USDT, and Paxos have demonstrated that private companies are capable of launching robust digital assets, quickly adapting them to markets, APIs, wallets, and decentralized platforms.
Advantages:
24/7 availability;
Operational independence;
Flexible integration architecture.
The downside is legal uncertainty. Without licenses and oversight, issuers are exposed to regulatory risk.
Government Pressure and CBDCs
The US, EU, and China are moving toward tight control over stablecoin issuance. The EU has adopted the MiCA regulation, while the US is discussing mandatory licensing of issuers. China and India are betting exclusively on CBDCs, banning private stablecoins altogether.
While CBDCs currently lack the flexibility of private solutions, they offer an alternative for the public sector and B2B settlements.

Gold Outlook: Bullish Bias Builds🧠 Combined Market Intelligence Report
Focus Asset: XAU/USD (Gold/USD)
Current Price: $3,381.65
🌍 Macro Overview: Key Weekly Market Themes
🏦 Central Bank Policy Divergence
Federal Reserve: Held rates steady; Powell struck a more cautious tone. Seven members now forecast no cuts in 2025. Rate cut probability softened early in the week, then revived after Fed Governor Waller hinted at a possible July cut.
Swiss National Bank (SNB): Cut rates to 0.00%, surprising markets and signaling potential for negative rates if needed.
Bank of Japan (BOJ): Maintained rates at 0.50%, slowed bond tapering, signaled caution amid trade and inflation uncertainty.
ECB & BOE: Mostly neutral/dovish tones. ECB may cut in 6 months; BOE remained split.
🧩 Implication: Diverging monetary paths and policy uncertainty support demand for neutral reserve assets like gold.
⚔️ Geopolitical Risk: Israel-Iran Conflict
Markets opened bullish on gold due to de-escalation signals from Iran, but risk-off sentiment returned midweek after:
Trump’s “unconditional surrender” demand
Iran’s “irreparable damage” threat
Reports of possible U.S. strikes
By Friday, Trump hit “pause” for 2 weeks of diplomacy.
🧩 Implication: Geopolitical tension is unresolved. Gold remains a top safe-haven hedge as military conflict risk persists.
📉 Macro Data Weakness
U.S. Retail Sales: -0.9% (vs. -0.4% expected)
U.S. Industrial Production: -0.2%
Philly Fed Manufacturing: -4.0
UK Retail Sales: -2.7% m/m
Eurozone Wage Growth: 3.4% y/y (missed expectations)
Australia Jobs: -2.5k (vs. +15k expected)
🧩 Implication: Global slowdown signals strengthen gold’s appeal as a defensive and inflation-hedging asset.
📊 Technical Outlook for XAU/USD (Gold)
🔹 Current Price: $3,381.65
🔸 Key Indicators (1D)
Indicator Value Signal
RSI 55.65 Slightly bullish (>50)
Stochastic %K / %D 51.23 / 53.33 Neutral zone
Williams %R -44.18 Mid-range, no strong signal
Bollinger Mid-Band 3,381.55 Price = BB midline (balance point)
Keltner Mid-Channel 3,381.94 Matching price (consolidation)
📍 Key Price Levels
Support: $3,360 → $3,345
Resistance: $3,410 → $3,430
Breakout Point: Close above $3,410 confirms upside momentum
Breakdown Point: Close below $3,360 confirms renewed selling pressure
📈 Forecast for Gold (XAU/USD) – Next 1–5 Days
🔮 Fundamental Bias: 🔼 Mildly Bullish
Unresolved geopolitical tension = sustained safe-haven flows
Global economic softness = pressure on real yields
Mixed Fed tone, SNB cut = supportive macro backdrop for gold
📉 Technical Bias: 🔁 Neutral to Bullish
RSI above 50, price above major midlines = buyers still in control
Consolidation at key pivot level ($3,381) suggests accumulation, not exhaustion
If price breaks above $3,410 and sustains, rally toward $3,430–3,460 is likely
If price breaks below $3,360, watch for a retest of $3,345–3,330 support zone
🎯 Final XAU/USD Forecast Summary
Time Frame Direction Price Targets Confidence Risk Catalyst
1–2 Days 🔁 Sideways-to-Bullish $3,390 → $3,410 Moderate News on Fed, Trump-Iran
3–5 Days 🔼 Bullish $3,430 → $3,460 High Breakout + geopolitics
Bearish Case 🔽 If < $3,360 $3,345 → $3,330 Moderate Peace deal + strong USD
⚠️ Trade Considerations
If bullish breakout (> $3,410) → potential swing trade toward $3,460
If failed breakout (< $3,360) → reversion trade toward $3,330
Avoid aggressive positions until volatility picks up, as current setup is range-bound with breakout potential.
The Support and Resistance outlined in green and red are the respective support/resistance for this pair currently for 1M-1Y timeframes!
No Nonsense. Just Really Good Market Insights. Leave a Boost
TradeWithTheTrend3344

ETHUSDT Weekly: $2550 - The Bullish Pivot Point• Current Price Consolidation and Immediate Range : The ETHUSDT price is currently consolidating within a critical immediate range, bounded by the 2000−2200 weekly support below and the 2900−3000 overhead resistance area. This 2000−3000 zone defines the current primary trading boundaries on the weekly timeframe.
• Key Bullish Catalyst at $2550 : For the bullish sentiment to gain significant momentum and indicate a potential continuation of the recent upward movement, a decisive weekly close above the $2550 level is paramount. This price point acts as an immediate pivot; successfully clearing and holding above it would suggest a re-energized buying interest targeting the upper bound of the current range.
• Significance of the "Deciding Area" : The 2900−3000 region, labeled as a "Deciding Area," represents a crucial resistance confluence. This zone previously served as significant support and the long-term green ascending trendline, which was subsequently broken. A successful retest and breakout above this area would indicate a potential shift in market structure from bearish to bullish, opening the path towards the higher Key Resistance at 3900−4000.
• Critical Support and Downside Risk : Maintaining the 2000−2200 weekly support is essential for bulls. A sustained weekly closure below this level would invalidate the current bullish outlook and likely lead to a retest of the strong demand zone around 1400−1500, signaling a deeper retracement or a renewed bearish trend.
Disclaimer:
The information provided in this chart is for educational and informational purposes only and should not be considered as investment advice. Trading and investing involve substantial risk and are not suitable for every investor. You should carefully consider your financial situation and consult with a financial advisor before making any investment decisions. The creator of this chart does not guarantee any specific outcome or profit and is not responsible for any losses incurred as a result of using this information. Past performance is not indicative of future results. Use this information at your own risk. This chart has been created for my own improvement in Trading and Investment Analysis. Please do your own analysis before any investments.

BTC short term I expect to see the retest of the highlighted area such as the 100k$ level, where we left the closest imbalance unfilled after taking the highs and not spooling higher, I assume we receive some kind of distribution during the summer in the range from ATH to the marked levels, after which we would have to see whether the structure will allow us for the continuation of the trend if it shows strong reaction and just wicks through the highlighted levels
Generally, I think we are close to the pivot point but still have some time for other assets to show if they want to perform, when everyone will be buying in the range which likely be part of the distribution for BTC, I refrain from any long term investments or long speculations. Might trade some swings though if the range offers such.
If we continue going higher conservatively looking I think 120-130 k will be the maximum we can spool towards

Bitcoin Wave Analysis – 23 June 2025
- Bitcoin reversed from round support level 100,000
- Likely to rise to resistance level 105,000
Bitcoin cryptocurrency recently reversed from the support area between the round support level 100,000, the lower daily Bollinger Band and the 38.2% Fibonacci correction of the upward impulse from April.
This support area was further strengthened by the support trendline of the daily down channel from May.
Given the clear daily uptrend, Bitcoin cryptocurrency can be expected to rise to the next resistance level 105,000.

BTC Short to 93.3My target is at least SSL on 93.3
WTF, there is no need to post a huge text description to understand what is depictured on the chart!

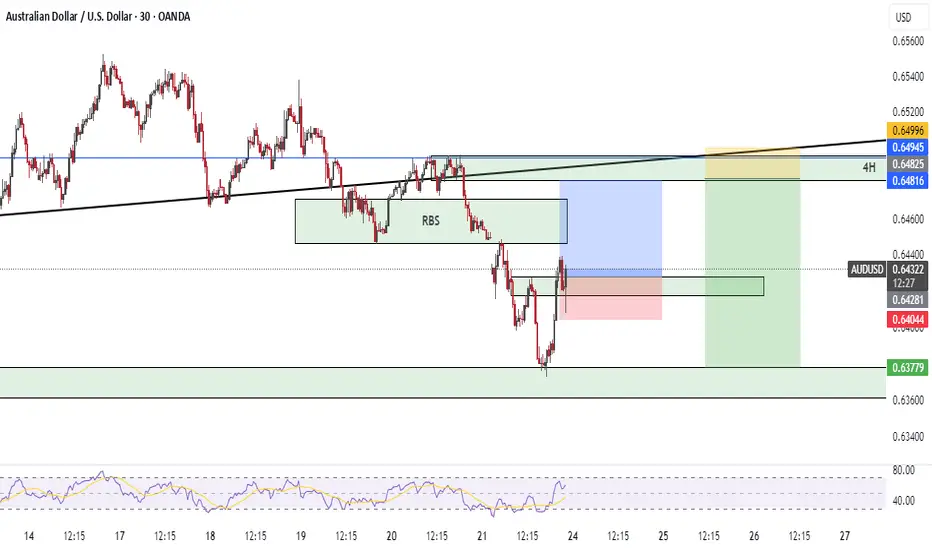
AUDUSD SETUPWe will enter the given setup .
Watch for market shift on LTF for confirmation entry .
Please follow to support me !
XAUUSD INTRADAY KEY LEVELS Greetings,
Hello traders, this is the XAU-USD 15m pivot resistance zone.
Based on market trend and previous day movement.
Intraday resistance 2 is represented by the yellow line. 3395.32
And circular figure 3100 may act as a resistance zone.
Key levels;
Entry: 3395.32
Target: 3385.32
Stop loss: 4095.32
Risk Reward Ratio 1:1
Your likes and boosts motivate us to keep learning and sharing ideas!

CDW Corp Stock Quote | Chart & Forecast SummaryKey Indicators On Trade Set Up In General
1. Push Set Up
2. Range Set Up
3. Break & Retest Set Up
Notes On Session
# CDW Corp Stock Quote
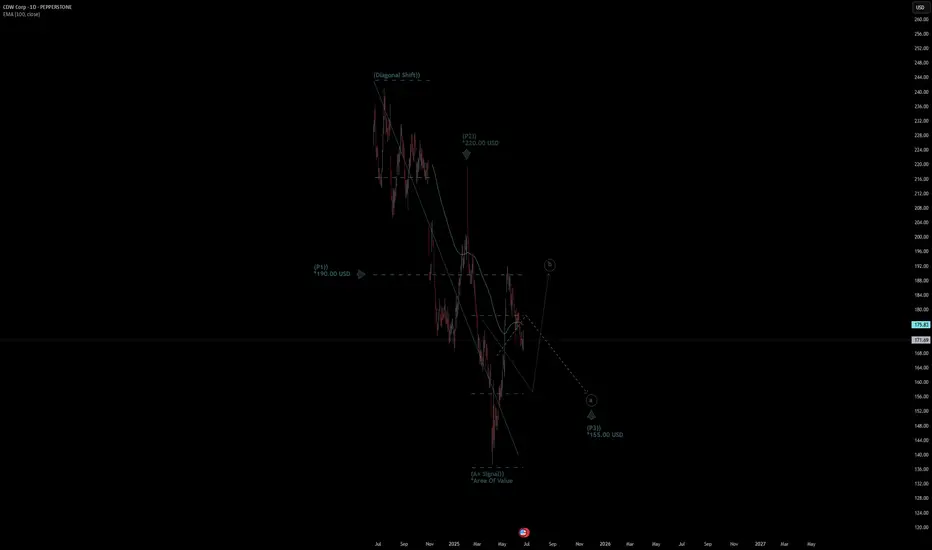
- Double Formation
* (Diagonal Shift)) At 240.00 USD | Completed Survey
* (A+ SIgnal)) - *Area Of Value | Subdivision 1
- Triple Formation
* (P1)) / (P2)) & (P3)) | Subdivision 2
* (TP1) = a / Long Consecutive Range
* (TP2) = b / Short Consecutive Pullback | Subdivision 3
* Daily Time Frame | Trend Settings Condition
- (Hypothesis On Entry Bias)) | Regular Settings
- Position On A 1.5RR
* Stop Loss At 180.00 USD
* Entry At 170.00 USD
* Take Profit At 158.00 USD
* (Downtrend Argument)) & No Pattern Confirmation
* Ongoing Entry & (Neutral Area))
Active Sessions On Relevant Range & Elemented Probabilities;
European-Session(Upwards) - East Coast-Session(Downwards) - Asian-Session(Ranging)
Conclusion | Trade Plan Execution & Risk Management On Demand;
Overall Consensus | Sell
#GBPJPY: 600+ Pips Swing Move, JPY To Drop! GBPJPY has successfully rejected the area previously identified in our analysis of GJ. We had anticipated a price rejection and reversal with a strong bullish impulse, which has materialised. Following the positive candle close on Friday, we anticipate a continuation of the bullish trend and potential reaching of the 200 mark.
When trading, it is crucial to prioritise risk management. Conduct your own analysis and utilise this information solely for educational purposes.
Three potential targets have been identified: 198, 200, and 202. A stop loss can be positioned below our buying zone, as indicated by the black-marked zone.
Your support, expressed through likes, comments, and shares, is greatly appreciated and encourages us to continue providing valuable content.
❤️🚀
Team Setupsfx_

Nifty Analysis EOD – June 23, 2025 – Monday🟢 Nifty Analysis EOD – June 23, 2025 – Monday 🔴
👊 Tug of War Between Optimism and Pessimism
Nifty opened with a sharp 140-point gap-down, weighed by geopolitical tensions and negative news cues. The mood was clearly pessimistic — yet, from the deep low of 24,824.85, bulls made a bold comeback.
What followed was a classic textbook reversal:Price clawed back up, cutting through multiple key resistances — S1, VWAP, CDH, CPR BC, and Central CPR — before kissing the CPR TC, where it marked the day high at 25,057. This level acted as a supply zone and pushed Nifty back down toward the CPR BC, where it managed to close above the open — a quiet victory for the bulls, even in a red session overall.
The level 24,825 has now proven itself once again — the market’s respect for this support zone grows stronger with every bounce.
Today’s candle was a spinning top-style doji and also formed an inside bar, with all movement inside Friday’s wide-range candle (352 pts). Despite a smaller 232-point range today, this still requires caution — inside bars after large-range candles often result in false breakouts, especially amid macro noise.
📌 When the world looks bearish, and the chart looks bullish — trust your system.And that’s exactly what I did today — sticking to the Gladiator Strategy, a simple, disciplined intraday price action-based option buying framework.
🕯 5 Min Time Frame Chart with Intraday Levels
🕯 Daily Time Frame Chart with Intraday Levels
🕯 Daily Candle Breakdown
Open: 24,939.75
High: 25,057.00
Low: 24,824.85
Close: 24,971.90
Change: −140.50 (−0.56%)
📊 Candle Structure Breakdown
Real Body: 32.15 pts (small green body)
Upper Wick: 85.10 pts
Lower Wick: 114.90 pts
🔍 Interpretation
Despite a lower close than Friday, it was a green-bodied candle (close > open).
Long lower wick shows strong buying near 24,825.
Long upper wick signals resistance near 25,050–25,060.
🕯 Candle Type
📍 Spinning Top with Long Wicks — Sign of indecision, but slight bullish bias due to buying off the lows.
📌 Key Insight
Support at 24,825 holds strong.
Upper rejection near 25,050 indicates tight overhead pressure.
Watch closely:
Break above 25,060 → May trigger bullish continuation.
Break below 24,820 → Could open downside to 24,735–24,660 zone.
🛡 5 Min Intraday Chart
⚔️ Gladiator Strategy Update
ATR: 254.95
IB Range: 163.25 → Medium IB
Market Structure: ⚖️ Balanced
Trades Triggered:
🟢 10:14 AM – Long Trade → ✅ Target Achieved (Trailing Exit, R:R 1:4.51)
🔴 2:16 PM – Short Signal → ❌ Discarded (RR not favorable)
📌 Support & Resistance Zones
Resistance Levels
24,980 ~ 25,000
25,060 ~ 25,080
25,125 ~ 25,150
25,180 ~ 25,212
25,285
Support Levels
24,965
24,894 ~ 24,882
24,825
24,800 ~ 24,768
24,735 ~ 24,725
💭 Final Thoughts
Markets are currently walking a tightrope — with bearish headlines on one side and bullish price action on the other.The Gladiator approach today helped sidestep the noise and focus on what matters: price structure and clean levels.
📌 Trade the chart, not the news. And when in doubt — zoom out.
🧠 “Uncertainty is the playground of the disciplined.”
✏️ Disclaimer
This is just my personal viewpoint. Always consult your financial advisor before taking any action.

NAS100 - Will the stock market continue to rise?!The index is trading in its short-term descending channel on the four-hour timeframe between EMA200 and EMA50. If there is no re-up and the channel is broken, I expect a correction to form, the target of which can be the bottom of the descending channel.
If the channel top is broken, we can expect a new ATH to be recorded in the Nasdaq index. It is better to wait for confirmation in case of a breakdown in order to control the risk further.
Over the past week, the Nasdaq has managed to stay within a stable range, especially despite geopolitical pressures, mixed signals from the Federal Reserve, and some concerns in the semiconductor sector. This stability is largely due to the strong fundamentals of large technology companies, the reduction in distribution days (selling pressure) in the market, and renewed expectations of interest rate cuts later in the year.
At a structural level, the number of distribution days, which indicate selling pressure from large institutions, has reached a relatively low number of 3 days in the Nasdaq over the past month. This is a sign of the weakness of heavy selling at price peaks and the market's willingness to maintain long positions. Unlike trends seen in previous years, this time the market has shown no signs of widespread divergence or fundamental weakness, even despite strong inflation data or concerns about new trade restrictions with China.
This trend is largely supported by the stellar performance of companies such as Nvidia, Microsoft, Apple and other major players in the artificial intelligence and technology sectors. Revenue growth, increased investment in AI infrastructure, as well as the return of institutional investors’ confidence in technology stocks, have led the Nasdaq to record significant returns since the beginning of 2025. Analysts from major financial institutions such as Goldman Sachs and Morgan Stanley, while warning of potential selling pressure on the index, remain positive about continued growth, of course, assuming that economic data does not deviate from the expected path.
However, some risks are clearly visible in the trading week ahead. The most important of them is the possibility of geopolitical tensions again affecting the market. In recent days, oil prices have risen and financial markets have experienced moments of fear after tensions in the Middle East escalated and the US political response to Iran and Israel's moves. Although the Nasdaq was able to withstand these fluctuations, the market remains very sensitive to energy price spikes and their impact on inflation.
Important data in the coming week could also determine the market's direction. The release of the Core PCE index, the Fed's preferred inflation measure, as well as data on unemployment insurance claims, both play a key role in the interest rate outlook. If inflation data is lower than expected, the likelihood that the Fed will start cutting rates in September or November increases, which would be a bullish stimulus for the stock market and especially the Nasdaq.
On the other hand, potential pressure on the semiconductor group - especially if new restrictions on technology exports to China are imposed - could disrupt the market trend. Last Friday, just one news report on the possibility of restricting exports of advanced chipsets caused the Nasdaq to fall by more than 0.6%. If this trend becomes official US government policy, it could cause a correction in stocks of companies such as Nvidia, AMD and ASML, which are heavy weights in the Nasdaq index.
In addition to these factors, next week will also see the release of quarterly reports from major companies such as Micron, FedEx and Nike. The results of these reports, especially in the area of sales and cost forecasts, could affect economic growth expectations. If the figures are better than expected, the Nasdaq could move towards new highs. However, if the data is released, the market could enter a short-term correction phase.
In terms of correlation with monetary policy, the Nasdaq index has become more sensitive than ever to interest rates and cash flows. The dollar price, real interest rates, and the direction of Treasury bonds all now have a direct impact on the valuation of technology companies. As a result, any change in the path of monetary tightening or easing is immediately reflected in the Nasdaq’s performance. However, analysts believe that the market will remain in a “wait and see” phase until the official data is released in July. In summary, the Nasdaq index is currently in a situation where its fundamentals are supported by the profitability of large technology companies, the easing of institutional selling pressure, and the possibility of a rate cut. At the same time, the market remains highly sensitive to major geopolitical news, trade policy, and economic data. As a result, the week ahead can be considered a “two-sided” period, where opportunities and threats are in a delicate balance, and only economic data and quarterly results can tip the balance in the direction of an increase or a correction.

$SPX6900 heading for new lows?Despite price rallying of the March lows and almost making new highs, price rejected at the top of the range and formed a lower high which sets up the potential for a large bearish move.
I think it's likely that from here, that we at least go and test the support in the $.62 range, but I have a feeling that breaks and that we go and test the lower supports before the bull trend resumes.
Let's see how it plays out in the coming weeks.

GBPCHF Buy Trade IdeaHello Traders
In This Chart GBPCHF HOURLY Forex Forecast By FOREX PLANET
today GBPCHF analysis 👆
🟢This Chart includes_ (GBPCHF market update)
🟢What is The Next Opportunity on GBPCHF Market
🟢how to Enter to the Valid Entry With Assurance Profit
This CHART is For Trader's that Want to Improve Their Technical Analysis Skills and Their Trading By Understanding How To Analyze The Market Using Multiple Timeframes and Understanding The Bigger Picture on the Charts

USDT DOMINANACE ANALYSIS (12H)This analysis is an update of the analysis you see in the "Related publications" section
First of all you should know that "USDT Dominance" is always moving inverse of BTCUSDT .
I correctly identified the upward movement in Tether Dominance in the previous analysis, but with the news of war in the Middle East, there are now bullish triggers for this index.
It is expected that the price will at least surge upward toward TP1.
Avoid opening impulsive and emotional positions, especially without proper risk management and setting a stop-loss | this is a dangerous market.
For risk management, please don't forget stop loss and capital management
When we reach the first target, save some profit and then change the stop to entry
Comment if you have any questions
Thank You

BTC/USDT Technical Analysis, 2025-06-20 19:45 UTCBTC/USDT Technical Analysis, 2025-06-20 19:45 UTC
💡 Trade Setup Summary
Pattern Detected: Bullish Hammer at local bottom
Confirmed by bullish candle close above pattern high
Volume Confirmation:
Volume Flow Analysis → Increasing OBV
Current Volume = 5.17, which although lower than the short-term mean, is paired with a positive trend
Order Book & Whale Confirmation:
Whale Bids > 2 BTC detected: 1 order, 3.54 BTC
Order Book Imbalance: 36.84% favoring buyers
Technical Indicators :
✅ Oversold region confirmed (likely RSI < 30, inferred by engine)
✅ Bullish pattern with volume trend confirmation
✅ Order book imbalance > 2%
✅ Whale bid presence
✅ Market pressure shows buyer dominance
✅ OBV increasing
Entry Price: 103146.58
Target (TP): 105646.58
Stop Loss (SL): 102146.58
Risk:Reward Ratio: ~2.5:1

ETH NEW UPDATE (8H)This analysis is an update of the analysis you see in the "Related publications" section
After the pump and hitting the red zone, it got rejected.
It's better not to open a short position on Ethereum, as its dominance appears bullish | which means it might be resilient against a potential drop.
The closing of a daily candle above the invalidation level will invalidate this analysis.
For risk management, please don't forget stop loss and capital management
Comment if you have any questions
Thank You

ONDO — Reversal or more Pain ahead? After a strong rally back in 2024, ONDO topped at $2.15 — completing a clear 5-wave impulsive move. Since then, price has entered a prolonged downtrend, dropping over -70%, with no confirmed reversal signs yet.
We’re now trading around a critical zone near $0.70. So the question is: where’s the next potential bottom?
🔎 Technical Breakdown:
📍 VWAP Breakdown:
The yellow anchored VWAP (Volume Weighted Average Price) has been lost — a clear sign of market weakness. This VWAP was previously acting as support but has now flipped to resistance, which often precedes continued downside.
📌 Key Support Zone:
$0.80–$0.70 was a structural support area that has now been broken — another bearish sign.
📉 Fibonacci Confluence:
Taking the structure and applying a Fibonacci retracement, the 0.786 retracement lies at $0.4828 — let’s round that to a critical $0.50 zone. This level is important for several reasons:
Liquidity rests at a previous key low at $0.50128
Anchored VWAP Band (0.618 multiplier) aligns with the same area
The 8/1 Gann Fan also intersects around this zone
All roads lead to the $0.50 level as a potential high-probability reversal zone. A bounce from here — especially with volume confirmation or reversal candlesticks etc. — would be a signal worth watching.
💡 Educational Insight: Importance of 0.786–0.886 Fibonacci Zone + VWAP
While many focus on the 0.618 retracement, bear markets often go deeper.
The 0.786–0.886 zone is where emotional exhaustion kicks in — traders give up, liquidity pools build, and smart money steps in.
Combining this with Anchored VWAP adds precision:
VWAP reflects where the “average buyer” is positioned. When price reaches confluence with both deep fibs and VWAP fib bands, you have a statistically powerful setup for reversals.
🚨 Note: These zones are not automatic buy levels — watch for confirmation signs before entering.
🛎️ Set your alerts, stay patient, and as always let the trade come to you.
_________________________________
💬 If you found this helpful, drop a like and comment!
Want breakdowns of other charts? Leave your requests below.
