XAUUSD| Weekly OutlookStill holding the same idea going into this week — waiting on that 30-minute mitigation to confirm bullish intent.
Until price delivers that, I’m staying patient and letting the market open up. No need to force anything. Let structure lead.
Bless Trading!
Pivot Points

EURUSD| Weekly OutlookSame story as last week — still patiently waiting for the major engineered liquidity above to get cleared before considering any meaningful longs.
That said, EU is currently offering a clean structure for short setups into the downside order block. Everything is lining up technically, but it’s important to note this is a counter-trend move — and personally, I’m not taking it.
It’s tempting when structure looks this clean, but I know it’s not my proper approach. For me, the real play is still higher — waiting on that bull-side OB mitigation to align with the bigger picture narrative. Until then, I’ll let others chase while I sit on my hands. Pure discipline only.
Bless Trading!

GOLD[XAUUSD]: Breakthrough the bearish pressure, What next?Evening Everyone,
Hope you are doing great, price recently breakthrough the current price inducement, showing a strong bullish volume emerging in the market. Long term approach remain bullish ultimately taking the price towards the new high.
Good luck
Team Setupsfx_

#EURJPY: Major Swing Sell +1100 Pips, One Not To Miss! The Japanese Yen (JPY) is most likely to continue its bullish trend, as the Dollar Index (DXY) is expected to decline due to the ongoing conflict between Israel and Iran. Historically, JPY and CHF, alongside gold and silver, have been favoured by global investors and remain bullish. Strong fundamentals and technical support further support our analysis.
The 167-169 price region remains a critical point for sellers, where we anticipate significant selling volume. There are two entry points to consider: one near the current price and another slightly further away. Please monitor volume and use smaller time frames for entries.
Our Swing Target is at 154, but you can also target smaller zones once the trade is activated. For instance, set take-profit levels at 164, 160, and finally, at 154.
To encourage and support us, you can like the idea, comment on it, or share it.
Team Setupsfx_
❤️❤️🚀🚀

Nifty 50 at a Turning Point? Key Levels & Market Outlook AheadThe Nifty 50 ended the week at 25,112.40 with a gain of 1.59%
If Nifty sustains below 25,033, selling pressure may increase. However, a move above 25,192 could restore bullish momentum.
Key Levels for the Upcoming Week
🔹 Price Action Pivot Zone:
The crucial range to watch for potential trend reversals or continuation is 25,033 -25,192.
🔹 Support & Resistance Levels:
Support:
S1: 24,797
S2: 24,482
S3: 24,093
Resistance:
R1: 25,431
R2: 25,750
R3: 26,144
Market Outlook
✅ Bullish Scenario: A sustained breakout above 25,192 could attract buying momentum, driving Nifty towards R1 (25,431) and beyond.
❌ Bearish Scenario: A drop below 25,033 may trigger selling pressure, pushing Nifty towards S1 (24,797) or lower.
Disclaimer: lnkd.in

Bank Nifty Weekly Insights: Key Levels & TrendsBank Nifty ended the week at 56,252.85 with a gain of 1.31%
Key Levels for the Upcoming Week
🔹 Price Action Pivot Zone:
The critical range to monitor for potential trend reversals or continuation is 56,135 to 56,372
🔹 Support & Resistance Levels:
Support Levels:
S1: 55,781
S2: 55,308
S3: 54,726
Resistance Levels:
R1: 56,729
R2: 57,206
R3: 57,786
Market Outlook
✅ Bullish Scenario: A sustained move above 56,372 could trigger buying momentum, potentially driving Bank Nifty towards R1 (56,729) and beyond.
❌ Bearish Scenario: If the index falls below 56,135, selling pressure may increase, pulling it towards S1 (56,729) and lower levels.
Disclaimer: lnkd.in

Indus on the MoveIndus Towers Ltd is India’s largest telecom tower infrastructure company, operating over 220,000 towers and enabling more than 340,000 colocations across all 22 telecom circles. Backed by Bharti Airtel (holding ~50%), the company offers long-term revenue visibility, steady cash flows, and a crucial position in India’s telecom value chain—especially as the country rapidly expands its 5G infrastructure.
In Q4 FY25, the company reported a standalone revenue of ₹7,727 crore, up 7.4% year-on-year. Consolidated revenue also rose to ₹7,547 crore. Net profit margins remain robust at around 33%, while the return on equity (ROE) stands strong at 30–33%. Operating efficiency is also reflected in the return on capital employed (ROCE), which is approximately 28.6%.
Liquidity remains healthy, with ₹33.4 billion in cash and short-term investments, positive working capital of ₹31.4 billion, and operating cash flow of ₹11,582 crore in FY2024. The company has a manageable debt-to-equity ratio of ~0.65 and net debt around ₹178 billion. Valuation metrics are attractive: a price-to-earnings (P/E) ratio near 10.8x and EV/EBITDA of ~5.6x suggest the stock is undervalued relative to its cash-generating strength. The Piotroski F-score of 7–8 reflects solid financial health.
Overall, the fundamentals indicate that Indus Towers is a stable, cash-rich business with long-term growth potential linked to telecom and data consumption growth in India.
📉 Technical Outlook
The 2-hour chart reflects a significant breakout pattern. A long-standing descending trendline has acted as dynamic resistance since April, repeatedly pushing the price lower. However, recent price action shows a strong breakout above this trendline, accompanied by bullish candles and higher volume.
The reversal zone between ₹388–392 acted as a key support area where buyers stepped in. The breakout above this zone followed by a push beyond the ₹404–408 zone signals strong upside momentum.
Key levels to monitor:
Close Above ₹408: Confirms the breakout and initiates bullish momentum.
Resistance Targets: ₹424 (R1), ₹438 (R2), and ₹462 (R3).
Support Zone: ₹388–392 remains a demand area. A move below this may invalidate the setup.
The pattern suggests a shift from lower highs to potential higher highs, which can attract swing and positional traders.
✅ Conclusion
Indus Towers is a classic case where fundamentals and technicals align. On one hand, it boasts strong earnings, consistent cash flow, low valuation, and strategic importance in India’s 5G rollout. On the other, the recent breakout from a long-term resistance trendline shows a potential trend reversal on the chart.
For investors and traders, this confluence presents a compelling opportunity. An entry in the ₹404–408 range could yield solid returns, with targets at ₹424, ₹438, and ₹462. A stop-loss below ₹388 is advisable to manage risk.
Disclaimer: lnkd.in

Gold weekly outlookThis is my outlook for gold this week, however due to increased Geopolitical developments trading Gold could result in extreme volatility.
please take note of all different zones for buys and sells according to the Fibs. Also if the trend breaks the trend regression channel we could see a pivot to the downside.

F5 Networks Stock Quote | Chart & Forecast SummaryKey Indicators On Trade Set Up In General
1. Push Set Up
2. Range Set Up
3. Break & Retest Set Up
Notes On Session
# F5 Networks Stock Quote
- Double Formation
* (Diagonal Shift) - *Bias On Hold | Completed Survey
* (A+ SIgnal)) - *Reversal Entry | Subdivision 1
- Triple Formation
* (P1)) / (P2)) & (P3)) | Subdivision 2
* (TP1) = a / Long Consecutive Range
* (TP2) = b / Short Consecutive Pullback | Subdivision 3
* Daily Time Frame | Trend Settings Condition
- (Hypothesis On Entry Bias)) | Regular Settings
- Position On A 1.5RR
* Stop Loss At 255.00 USD
* Entry At 284.00 USD
* Take Profit At 328.00 USD
* (Uptrend Argument)) & No Pattern Confirmation
* Ongoing Entry & (Neutral Area))
Active Sessions On Relevant Range & Elemented Probabilities;
European-Session(Upwards) - East Coast-Session(Downwards) - Asian-Session(Ranging)
Conclusion | Trade Plan Execution & Risk Management On Demand;
Overall Consensus | Buy

Bullish Tone, and made a trade based on Pivots amd FVG in comboTrade Analysis
(1) Trade Plan:
The idea was that the short term trend looked bullish, hence I marked up the key levels and checks to see if the price was at any of the pivot levels. Based on the idea when price crosses the Centre Top Pivot and is above a support . Further more it already visited a recent Bullish.. Hence the price may continue towards R1 above.
-
(2) Indicators (4 of 5):
- Only Pivot and Support lines and FVG
(3) Confirmations (3 of 3):
- 30 min candle closing well above the TOP Centre Pivot line.
(4) Risk Management Plan:
- This was little high as it was set to below the end of the Bullish FVG at the bottom. On hindsight i should have waited on my entry for a revisit. However sometimes i don't wait as it does not revisit.
(5) Profit Target:
- R1
(6) Stop Loss:
- Bottom Of FVG
(7) Entry:
- First Candle after 30 min candle closed above TCP
(8) Profit Taking Plan:
-
(9) Analyzation:
-
(10) Psychology of the Trade:
-
(11) Overall Rating:
(12) What was Good:
-
(13) What was Bad:
-
(14) Improvement Areas:
-
(15) Rule Broken & Key Takeaways:

*USDJPY| Weekly Breakdown - Bulls Took OverUJ was all bullish this week, no question about it. The chart made it clear—30M structure stayed intact, and market flow shifted heavily in favor of the buyers.
Liquidity was taken along the way, with higher lows stacking up clean, setting the stage for further continuation to the upside.
Not overcomplicating this one—bulls won the battle, and structure confirmed it. Now we look for smart ways to join that strength as price builds momentum into next week.
Stay with the flow, not against it.
Bless Trading!

*NAS100| Weekly Breakdown - Structure Is PriceWhew—Nasdaq was a wild one this week, but once you master structure, liquidity, and OBs, the chaos turns into clarity.
Price held my 30M demand zone, even after a sketchy wick-based reaction early on. First long position? Quick scalp to the highs—in and out, no burger 🍔.
Didn’t wait for a full mitigation at first—anticipated the bullish momentum by staying aligned with structure. Later, price came back and mitigated the zone with body closes, confirming the intent for another long setup into next week.
Yes, I hold trades over weekends—because here’s what I’ve figured out:
“Price is structure. Structure is price. Master that, and it flows exactly how it should.”
This week was just another example of that.
Bless Trading!

*GBPUSD | Weekly Breakdown - Patience Over PressureThis week, GU didn’t follow the original script, and that’s perfectly fine. No forced trades, no ego—we sat back and let price do what it needed to do.
Price broke straight through the 30M demand zone, showing clear bearish intent. That shift redirected my focus to the 4H demand, which held strong and gave us the real story.
Now the play is simple: I’m waiting for price to retrace back to mitigate the 30M zone, then I’ll look for continuation sales aligned with that new HTF momentum.
No stress—just adjusted bias, preserved capital, and waited for the next clean setup.
We don’t chase—we position. 😉
Bless Trading!

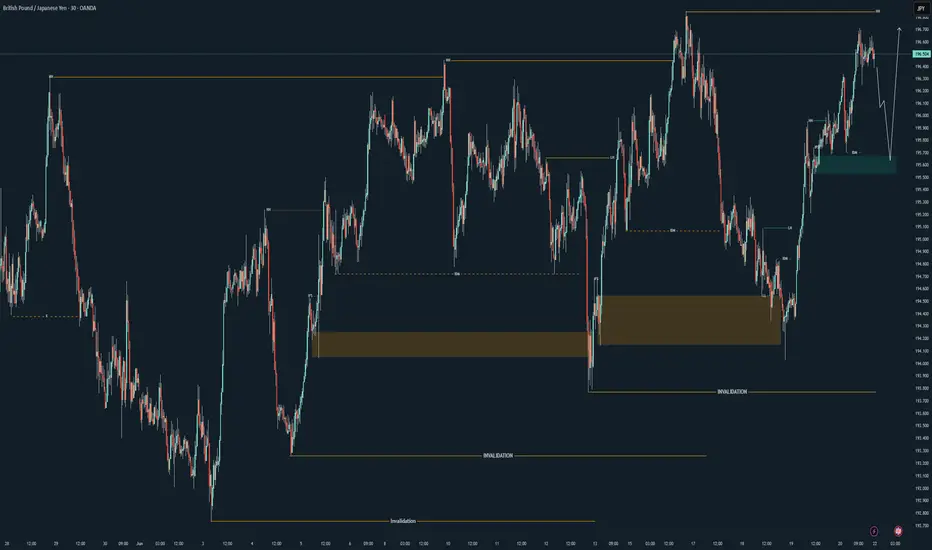
*GBPJPY Weekly Breakdown - Structure + PrecisionThis week, GJ moved exactly how it was supposed to—clean structure, proper mitigation, and follow-through.
Price respected the bullish flow all week, tapping into a refined 30M order block (green zone) before lifting off. That zone did its job—mitigated, held, and set the tone for the next leg up. No need to force anything here—just fundamentals and execution.
We’re still holding higher lows, and unless structure says otherwise, I’m expecting continuation next week with a clean break of those highs.
Simple reads. Clean execution.
This is how we do it. 😉
Bless Trading!
$100 a barrel coming soon for Crude oil futures In this video we focus on the current accumulation in the oil chart and the prospect of higher prices ahead .
I highlight how the respect of the previous quinquennial pivots gave us a 45% move to the upside in the past 8 weeks .
Looking ahead on the monthly timeframe we have the following confluences above the current price of $75 .
Above the current pa we have the point of control at $ 88 and the avwap at $97, if we can reclaim the poc I think we will continue to push up to the fib levels that I have mentioned in the video.
In addition to the above we also have the decennial pivots at $107/$112 alongside the value area high .
All of this validates for me why oil will be pushing back up throughout the course of the year .
Tools used in the video
Tr pocket , pivots , fived range volume profile and fib expansion

XAUUSD: Is Bullish Trend Ended? Or It is just beginning big moveAs we previously stated that price can reverse between 3340 to 3350 region, which was a pivotal point for bulls. Price smoothly moved currently trading at 3376 and possibly bullish move continuing towards 3400,3450 and ultimately reaching 3600.
Following the price’s all-time high at $3500, it experienced a sharp decline and failed to maintain that level. A substantial 2400 pips would have resulted in significant losses for many accounts. Initially, it was perceived as a minor correction, with the expectation of further price appreciation. However, this assumption proved incorrect. After reaching an even higher peak, the price invariably undergoes a more substantial correction.
At 3260, substantial bullish volume surged into the market, necessitated by the presence of a fair value gap. Subsequently, the price experienced a decline, reflecting the prevailing bearish trend, which favoured the bears. However, at 3200, a pivotal level representing a discounted price point, bull volume surged. This powerful bullish impulse propelled the price to 3432, ultimately confirming the bullish trend. AB=CD there recurring pattern emerged weekly. When the price reached the 3432 level as a fair value gap, the CD pattern commenced.
AB=CD we have identified a recurring pattern. It appears to be an equal move in any direction, and it has manifested precisely as anticipated. We were aware that the price would reject at 3120, and it did so accordingly. Currently, the market is in our favour. Upon market opening, it exhibited a positive gap, propelling the price to 3450. However, it subsequently declined, reaching 3384.
Presently, we find ourselves in the accumulation phase, poised for distribution. This distribution is anticipated to be substantial, potentially leading to another record high, potentially reaching 3650.
Moving forward, the price could continue towards our target from its current position. Alternatively, there exists a possibility that it may drain the sell-side liquidity and reverse from 3360-3370.
Our take-profit levels are set at 3450, 3490, 3520, and finally, 3600. When entering the market, it is advisable to employ a short time frame. It is important to note that this analysis is merely our opinion, and market conditions may deviate from expectations.
We extend our best wishes for success and safe trading. If you wish to demonstrate your support, you may consider liking, commenting, or sharing this analysis with others.
Sincerely,
Team Setupsfx_

USNAS100- Geopolitical Pressure Builds,NAS at Key Decision PointUSNAS100 – Technical Overview
🔻 Bearish Outlook:
The price is currently testing 21780. A 4H candle close below this level would confirm downside continuation toward 21635.
A break below 21635 would further strengthen the bearish trend, targeting 21470 and 21375.
🔺 Bullish Scenario:
Bullish momentum may return if the price breaks and holds above 21780 on the 4H timeframe, with upside targets at 21930, and potentially 22090.
• Support: 21635/ 21475 / 21375
• Resistance: 21780 / 21930 / 22090

Nifty Analysis EOD – June 20, 2025 – Friday🟢 Nifty Analysis EOD – June 20, 2025 – Friday 🔴
🚀 Bull Run Out of the Blue 🚀 – A Masterclass in Price Action
Nifty kicked off the session with a +56-point gap-up — surprising many, especially since Gift Nifty hinted flat to negative and yesterday’s close was weak. The real jolt came when, in the very first minute, price broke above the Previous Day High (PDH) and opened directly above the CPR zone — a rare occurrence when geopolitical tensions are peaking.
As I often say:
📌 “Market rarely follows the obvious. It thrives in the unexpected.”
Today was a textbook example of that.
Luckily, we were prepped. In yesterday’s note, I mentioned the bullish trigger above 24,862 — and right from the open, Nifty respected every level, offering "hope-on" and "hope-off" trades. What seemed like a 25K test turned into a blast to 25,136, with 100 points added in the last 30 minutes, leaving even seasoned traders awestruck.
The intraday close at 25,079.75 and the adjusted close at 25,112.40 — both above the 15th May closing levels — give a bullish vibe heading into the weekend. 🤞
💬 Personal Note:
Today was special — I sat with my elder daughter, helping her understand real-time market behavior. And what a day it was! From trend reversals, cup & handle, head & shoulders, wedges, shallow pullbacks, to aggressive one-way rallies — everything aligned perfectly to make this a live-action lesson in intraday trading.
🕯 5 Min Time Frame Chart with Levels
🕯 Daily Time Frame Chart
🕯 Daily Candle Breakdown
Open: 24,787.65
High: 25,136.20
Low: 24,783.65
Close: 25,112.40
Change: +319.15 (+1.29%)
📊 Candle Structure Breakdown
Real Body: 324.75 pts → ✅ Strong Green Candle
Upper Wick: 23.80 pts
Lower Wick: 4.00 pts
🔍 Interpretation
Opened flat and never looked back.
Minimal wicks = clear directional strength.
Buyers in full control from open to close.
🕯 Candle Type
📈 Bullish Marubozu-like — One of the strongest bullish signals. A powerful sign of trend continuation or breakout momentum.
📌 Key Insight
Today’s candle reinforces bullish strength.
Holding above 25,100 is key going forward.
A move above 25,136 could invite fresh upside targets — possibly 25,180+ and beyond.
🛡 5 Min Intraday Chart
⚔️ Gladiator Strategy Update
ATR: 251.32
IB Range: 116.6 → Medium IB
Market Structure: 📈 ImBalanced
Trades Triggered:
🔹 9:41 AM – Long Trade → Target Achieved (Trailing Exit, R:R 1:4.79)
🔹 12:18 PM – Short Contra Trade → Target Achieved (R:R 1:2)
🔹 1:07 PM – Long Trade → Target Achieved (Trailing Exit, R:R 1:2.62)
📌 Support & Resistance Zones
Resistance Levels
25,125 ~ 25,150
25,180 ~ 25,212
25,285
Support Levels
25,080 ~ 25,060
25,000 ~ 24,980
24,965
24,894 ~ 24,882
💭 Final Thoughts
The market surprised today — not just in movement but in clarity.The clean break, follow-through strength, and intraday structure hint at momentum continuation — but weekends can bring surprise news.
📌 Watch 25,100 as line in the sand on Monday.
🧠 “Markets are teachers. Today’s lesson? Expect the unexpected, but prepare like it’s already here.”
✏️ Disclaimer
This is just my personal viewpoint. Always consult your financial advisor before taking any action.

US30 Under Pressure as Geopolitical Risks Drive VolatilityUS30 – Technical Overview
Dow Jones (US30) futures are trading lower amid escalating tensions in the Middle East, with markets closely monitoring any potential U.S. response that could significantly sway sentiment.
⚠️ Volatility remains elevated, and traders should remain cautious ahead of potential geopolitical developments.
US30 continues to trade below the key level at 42160, maintaining a bearish bias.
As long as the price stays below this level, further downside remains likely.
However, the market is also testing the pivot zone, and a confirmed break above 42160 could trigger a bullish move toward 42410.
Key Levels:
• Pivot: 42160
• Support: 41900 / 41780 / 41310
• Resistance: 42310 / 42410 / 42580

XAUUSD: 1H Chart Trend Continuation or Deeper Pullback?Established Uptrend Channel : The XAUUSD pair is trading within a well-defined, long-term ascending channel (highlighted by the red parallel bands), indicating a clear bullish trend with consistent higher highs and higher lows over the observed period.
Significant Support Confluence : The lower boundary of the ascending channel, particularly the area marked "Confluence Area for support" (green and orange shaded zone), has repeatedly acted as a strong demand zone where price has found support and reversed higher.
Current Corrective Phase and Deciding Point : Price is currently undergoing a short-term correction, forming a smaller, descending channel (white/grey box) within the larger uptrend. This area is labeled "Deciding Area to continue Higher," indicating that the immediate future direction is contingent on whether price breaks out of this smaller channel or continues within it.
Projected Pathways : The chart illustrates two immediate potential scenarios: a resumption of the primary uptrend (green dotted path) upon a successful breakout from the short-term descending channel, or a deeper retracement towards the major ascending channel's support (red dotted path) if the current corrective structure persists or breaks lower.
Disclaimer:
The information provided in this chart is for educational and informational purposes only and should not be considered as investment advice. Trading and investing involve substantial risk and are not suitable for every investor. You should carefully consider your financial situation and consult with a financial advisor before making any investment decisions. The creator of this chart does not guarantee any specific outcome or profit and is not responsible for any losses incurred as a result of using this information. Past performance is not indicative of future results. Use this information at your own risk. This chart has been created for my own improvement in Trading and Investment Analysis. Please do your own analysis before any investments.

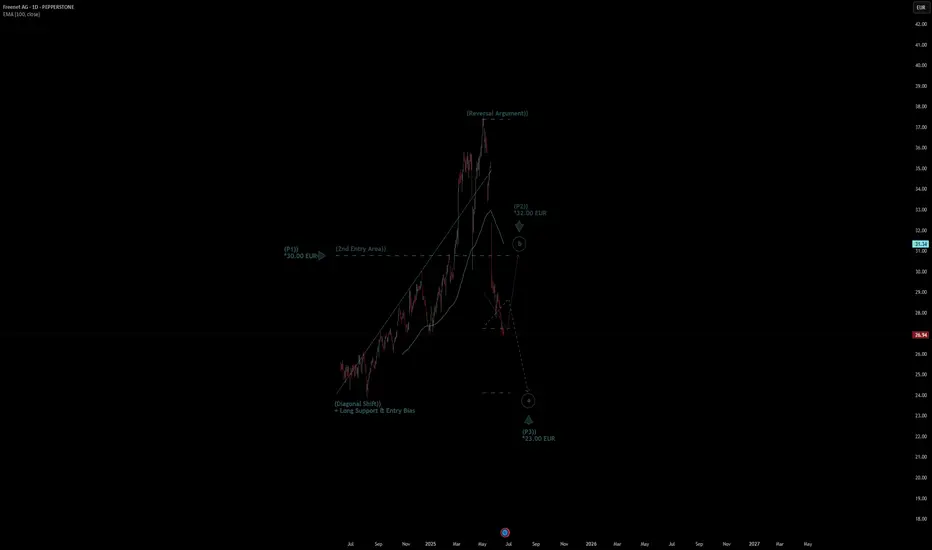
Freenet AG Stock Quote | Chart & Forecast SummaryKey Indicators On Trade Set Up In General
1. Push Set Up
2. Range Set Up
3. Break & Retest Set Up
Notes On Session
# Freenet AG Stock Quote
- Double Formation
* (Diagonal Shift) + Long Support & Entry Bias | Completed Survey
* (2nd Entry Area)) At 30.00 EUR | Subdivision 1
- Triple Formation
* (P1)) / (P2)) & (P3)) | Subdivision 2
* (TP1) = a / Long Consecutive Range
* (TP2) = b / Short Consecutive Pullback | Subdivision 3
* Daily Time Frame | Trend Settings Condition
- (Hypothesis On Entry Bias)) | Regular Settings
- Position On A 1.5RR
* Stop Loss At 28.00 EUR
* Entry At 27.00 EUR
* Take Profit At 25.00 EUR
* (Downtrend Argument)) & No Pattern Confirmation
* Ongoing Entry & (Neutral Area))
Active Sessions On Relevant Range & Elemented Probabilities;
European-Session(Upwards) - East Coast-Session(Downwards) - Asian-Session(Ranging)
Conclusion | Trade Plan Execution & Risk Management On Demand;
Overall Consensus | Sell
DAX | Bearish Below 23810–23690, Targeting 23395 and 23160DAX | Technical Analysis
The price has stabilized below the pivot zone (23810 – 23690), confirming the continuation of bearish momentum.
📉 As long as the price remains below 23810 and 23690, the downtrend is expected to persist, with a potential move toward 23395. A confirmed break below this level could extend the decline toward 23160.
Pivot Zone: 23810 – 23690
Resistance Levels: 24085, 24300
Support Levels: 23395, 23160
Trend Outlook: Bearish Momentum

Nifty Analysis EOD – June 19, 2025 – Thursday🟢 Nifty Analysis EOD – June 19, 2025 – Thursday 🔴
📉 Bookish Spinning Top Doji – Another Day of Indecision on Expiry
Nifty opened with a mild +16-point gap-up and immediately dipped to test the Previous Day Low (PDL), marking the day low at 24,738.10. A quick reversal took the index 125 points higher, reaching a high of 24,863, only to settle back into theta-eating mode around VWAP.
Just as things looked ready to turn, a 13:50 breakout attempt fizzled as the price faced rejection above the CPR zone, leading to a final dip below the previous low, touching a new intraday low at 24,733.
Though the intraday close was at 24,744.70, the settlement close was 24,793.25 — a 47.65-point difference that’s not trivial, especially on expiry day.
The entire day remained a narrow-range, rollercoaster ride — clearly showing neither bulls nor bears could take charge. The total range was just 130 points, forming a textbook Spinning Top, which reflects market contraction.
📌 Now what?
Keep a close eye on the range:
🟢Bullish Breakout ➤ above 24,862 (CDH)
🔴Bearish Breakdown ➤ below 24,733 (CDL)
The squeeze is on. Expansion is near.
🕯 5 Min Time Frame Chart with Levels
🕯 Daily Time Frame Chart
🕯 Daily Candle Breakdown
Open: 24,803.25
High: 24,863.10
Low: 24,733.40
Close: 24,793.25
Change: −18.80 (−0.08%)
📊 Candle Structure Breakdown
Real Body: 10.00 pts → 🔻 Small Red Candle
Upper Wick: 59.85 pts
Lower Wick: 59.85 pts
🔍 Interpretation
Equal wicks show balanced buying and selling.
Small real body signals strong indecision.
Intraday volatility was neutral despite expiry impact.
🕯 Candle Type
⚖️ Perfect Spinning Top / Doji-like Candle – Indicates market contraction, waiting for directional resolution.
📌 Key Insight
The market continues its tight range-bound structure.
Any breakout beyond 24,865 or breakdown below 24,730 could trigger directional moves.
Till then: “Wait and watch mode.”
🛡 5 Min Intraday Chart
⚔️ Gladiator Strategy Update
ATR: 240.08
IB Range: 125.00 → Medium IB
Market Structure: ⚖️ Balanced
Trades:🚫 No Trade Triggered by System
📌 Support & Resistance Zones
Resistance Levels
24,894 ~ 24,882
24,972 ~ 25,000
25,060 ~ 25,080
25,102 ~ 25,125
Support Levels
24,825 ~ 24,847
24,725 ~ 24,735
24,660
24,590
💭 Final Thoughts
The market is compressing like a coiled spring.Spinning tops near resistance often signal upcoming volatility.Let the breakout come to you — don’t pre-empt, participate.
🧠 “When the market sleeps in narrow ranges, it dreams of big moves.”
✏️ Disclaimer
This is just my personal viewpoint. Always consult your financial advisor before taking any action.
