Nifty Analysis EOD – June 18, 2025 – Wednesday🟢 Nifty Analysis EOD – June 18, 2025 – Wednesday 🔴
⚖️ Dhamakedar Start, But Indecisive Close – Weekly Expiry Caution Ahead
Nifty opened with a 65-point gap-down at 24,788.35, but what followed was a power-packed bullish start — within just 25 minutes, it surged over 150 points, hitting a day high of 24,947.55.
However, the euphoria didn’t last.
As the session progressed, the index gradually gave up all its gains, slipped below the previous day’s low, and finally found support at 24,750, a critical level. By the end of the day, Nifty settled around the opening zone at 24,812.05, just +23 points above open, while net change remained −41.35 points from the previous close.
The day showcased both strength and weakness — a typical "everyone-expected-fall-but-it-didn't-fall-enough" kind of day. The long upper wick reflects failed attempts by bulls, while the lack of breakdown keeps the bears in check.
Tomorrow is weekly expiry — caution is advised.
🕯 5 Min Time Frame Chart with Levels
🕯 Daily Time Frame Chart
🕯 Daily Candle Breakdown
Open: 24,788.35
High: 24,947.55
Low: 24,750.45
Close: 24,812.05
Change: −41.35 (−0.17%)
📊 Candle Structure Breakdown
Real Body: 23.70 pts → ✅ Green Candle (tiny body)
Upper Wick: 135.50 pts
Lower Wick: 37.90 pts
🔍 Interpretation
Strong bullish momentum early on, but buyers failed to hold above 24,900.
Long upper wick signals supply or profit-booking at higher levels.
Price closed near open despite wide range → indecision between bulls and bears.
🕯 Candle Type
🟨 Spinning Top – A textbook indecisive candle, often seen at turning points or during pauses in trend.
📌 Key Insight
Buyers couldn’t reclaim or close above 24,950 — resistance strengthened.
Support held at 24,750 — but barely.
Watch 24,950 on upside and 24,750 on downside — a breakout from either may decide expiry-day trend.
🛡 5 Min Intraday Chart
⚔️ Gladiator Strategy Update
ATR: 252.34
IB Range: 170.65 → Medium IB
Market Structure: ⚖️ Balanced
Trades:🚫 Short Trigger at 12:45 : Trapped - SL Hit
📌 Support & Resistance Zones
Resistance Levels
24,894 ~ 24,882
24,972 ~ 25,000
25,060 ~ 25,080
25,102 ~ 25,125
Support Levels
24,825 ~ 24,847
24,725 ~ 24,735
24,660
24,590
💭 Final Thoughts
When price travels 200 points but closes flat, it tells you something: Smart money is waiting.Weekly expiry ahead could bring unexpected moves.✅ Stay nimble. Stay alert.
🧠 “When in doubt, let the market shout — not whisper. Listen for the breakout.”
✏️ Disclaimer
This is just my personal viewpoint. Always consult your financial advisor before taking any action.
Pivot Points

Massive Oil Move Incoming? Only One Thing Can Stop ItOIL – Overview
Oil Rallies to 5-Month High as Israel-Iran Tensions Escalate
Oil prices surged to a five-month high early Wednesday amid escalating conflict between Israel and Iran. The ongoing airstrikes between the two nations, along with reports that the Trump administration is considering military involvement, have intensified concerns over a broader regional war.
Since Israel launched a surprise strike on Iran last week targeting nuclear sites, oil has risen nearly 10%, fueled by fears of potential supply disruptions. President Trump has publicly called for Iran's "unconditional surrender," signaling heightened geopolitical risk.
Despite the ongoing conflict, Iran's oil exports remain largely unaffected, and the country has not yet disrupted shipping through the Persian Gulf — a critical route supplying around 20% of global oil demand. However, markets remain on edge over the potential for further escalation that could directly impact supply.
Technical Outlook:
Oil maintains bullish momentum as long as it trades above 72.21, with upside targets at:
➡️ 77.21
➡️ 79.50 — key breakout level
➡️ 85.40 — next resistance zone
➡️ Potential extension to 88.40 if momentum continues
🔻 A shift to bearish sentiment is only likely if negotiations begin between Iran and Israel, signaling potential de-escalation.
Key Levels:
• Pivot: 73.20
• Resistance: 77.21 / 79.50 / 85.40
• Support: 69.55 / 68.33 / 66.03
Caution: Any signs of de-escalation or negotiations between Iran and Israel could quickly reverse the trend.

Visteon Corp Stock Quote | Chart & Forecast SummaryKey Indicators On Trade Set Up In General
1. Push Set Up
2. Range Set Up
3. Break & Retest Set Up
Notes On Session
# Visteon Corp Stock Quote
- Double Formation
* (Diagonal Shift) + 107.00 USD | Completed Survey
* (A+ SIgnal)) At 115.00 USD | Subdivision 1
- Triple Formation
* (P1)) / (P2)) & (P3)) | Subdivision 2
* (TP1) = a / Long Consecutive Range
* (TP2) = b / Short Consecutive Pullback | Subdivision 3
* Daily Time Frame | Trend Settings Condition
- (Hypothesis On Entry Bias)) | Regular Settings
- Position On A 1.5RR
* Stop Loss At 80.00 USD
* Entry At 90.00 USD
* Take Profit At 105.00 USD
* (Uptrend Argument)) & No Pattern Confirmation
* Ongoing Entry & (Neutral Area))
Active Sessions On Relevant Range & Elemented Probabilities;
European-Session(Upwards) - East Coast-Session(Downwards) - Asian-Session(Ranging)
Conclusion | Trade Plan Execution & Risk Management On Demand;
Overall Consensus | Buy

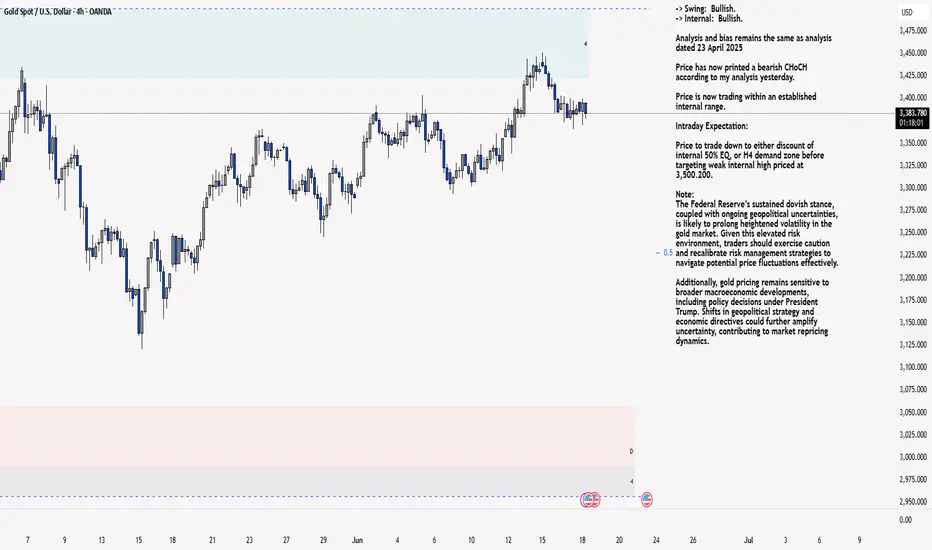
XAU/USD 18 June 2025 Intraday AnalysisH4 Analysis:
-> Swing: Bullish.
-> Internal: Bullish.
Analysis and bias remains the same as analysis dated 23 April 2025
Price has now printed a bearish CHoCH according to my analysis yesterday.
Price is now trading within an established internal range.
Intraday Expectation:
Price to trade down to either discount of internal 50% EQ, or H4 demand zone before targeting weak internal high priced at 3,500.200.
Note:
The Federal Reserve’s sustained dovish stance, coupled with ongoing geopolitical uncertainties, is likely to prolong heightened volatility in the gold market. Given this elevated risk environment, traders should exercise caution and recalibrate risk management strategies to navigate potential price fluctuations effectively.
Additionally, gold pricing remains sensitive to broader macroeconomic developments, including policy decisions under President Trump. Shifts in geopolitical strategy and economic directives could further amplify uncertainty, contributing to market repricing dynamics.
H4 Chart:
M15 Analysis:
-> Swing: Bullish.
-> Internal: Bullish.
Following previous high, and printing of bearish CHoCH, price has pulled back to an M15 supply zone, where we are currently seeing a reaction. Therefore, I shall now confirm internal high.
Price is now trading within an established internal range.
The remainder of my analysis shall remain the same as analysis dated 13 June 2025, apart from target price.
As per my analysis dated 22 May 2025 whereby I mentioned price can be seen to be reacting at discount of 50% EQ on H4 timeframe, therefore, it is a viable alternative that price could potentially print a bullish iBOS on M15 timeframe despite internal structure being bearish.
Price has printed a bullish iBOS followed by a bearish CHoCH, which indicates, but does not confirm, bearish pullback phase initiation. I will however continue to monitor, with respect to depth of pullback.
Intraday Expectation:
Price to continue bearish, react at either M15 supply zone, or discount of 50% internal EQ before targeting weak internal high priced at 3,451.375.
Note:
Gold remains highly volatile amid the Federal Reserve's continued dovish stance, persistent and escalating geopolitical uncertainties. Traders should implement robust risk management strategies and remain vigilant, as price swings may become more pronounced in this elevated volatility environment.
Additionally, President Trump’s recent tariff announcements are expected to further amplify market turbulence, potentially triggering sharp price fluctuations and whipsaws.
M15 Chart:
BNB Pump???On the daily chart of BNB, a symmetrical triangle has formed, and the price is approaching a breakout point. The $600–$604 zone, aligned with the 200-day moving average and the descending trendline, acts as a key resistance. A bullish breakout could push the price toward the $696 area. On the downside, the $575 support is crucial — if broken, the next potential drop could target the $505 zone. Price compression and declining volatility suggest a strong move is likely soon.
📈 A major move is coming for BNB!
🔺 Resistance: $604
🔻 Support: $575 and then $505

Netsol - Inverse H&S into playNetsol is in its buyback phase which is about to be over in June.
Inverse H&S is in play where it hit its daily pivot level. If it now makes a higher high and higher low, 2nd shoulder will be confirmed. Alternatively, it may hit 123 (bottom of its first shoulder) before going upward. Upside short term target will be 183.

MLCF - Cooling down after a long rallyMaple Leaf is cooling down after a long rally and is preparing for touching its all time high.
It struck Fib 0.618 level and is now spending some time here as expected. It may retrace to its Fib 0.5 level (73 to 74) before again going up.
Once it crosses and gives monthly closing above 88, we can see it hitting 108 and then 133 in quick succession.

Nifty Analysis EOD – June 17, 2025 – Tuesday🟢 Nifty Analysis EOD – June 17, 2025 – Tuesday 🔴
⚠️ Resistance Rejection at 25K – Pause or Warning Sign?
Yesterday’s note rightly anticipated today’s challenge near 25K — and that’s exactly how the session unfolded.
Nifty opened at 24,977.85, right inside the critical resistance zone of 24,972–25,000, and formed a near O=H (Open = High) structure. The index quickly lost ground, dropping 135 points within the first hour to mark a day low of 24,813.70, forming a medium-sized Initial Balance (IB) within a wide CPR — conditions known for range-bound or tricky days.
Throughout the session, Nifty hovered largely inside the CPR and IB, with a false breakdown attempt around 12:50 PM. Such setups (wide CPR + higher value + medium IB) often result in false moves or low-conviction sessions, and today was no exception.
By day’s end, Nifty closed at 24,853.40, logging a modest −93.10 point dip, forming what can be termed as a healthy pullback — but the real test remains.
If bulls want to take charge again, they must breach and close above 25,025. On the flip side, if 24,800–24,820 gives way, it could trigger a slide toward 24,725 and 24,660 in the coming sessions.
🕯 Daily Time Frame Chart
🕯 Daily Candle Breakdown
Open: 24,977.85
High: 24,982.05
Low: 24,813.70
Close: 24,853.40
Change: −93.10 (−0.37%)
📊 Candle Structure Breakdown
Real Body: 124.45 pts → 🔻 Red Candle
Upper Wick: 4.20 pts
Lower Wick: 39.70 pts
🔍 Interpretation
Opened near the day’s high but selling dominated soon after.
Small upper wick shows minimal buyer strength; recovery attempts were mild.
Lower wick indicates some support emerged at day’s low, but overall tone remained bearish.
🕯 Candle Type
🟥 Bearish Candle – strong real body, minor lower wick — reflects steady intraday selling, though not overly aggressive.
📌 Key Insight
Nifty has now rejected the 25K zone two days in a row, turning it into short-term resistance.
If 24,800 breaks, expect pressure to mount — next watch: 24,725 → 24,660.
Bulls need a close above 25,025 to regain command.
🛡 5 Min Intraday Chart
⚔️ Gladiator Strategy Update
ATR: 258.48
IB Range: 131.60 → Medium IB
Market Structure: ⚖️ Balanced
Trades:🚫 No Trade Triggered by System
📌 Support & Resistance Zones
Resistance Levels
24,894 ~ 24,882
24,972 ~ 25,000
25,060 ~ 25,080
25,102 ~ 25,125
Support Levels
24,825 ~ 24,847
24,725 ~ 24,735
24,660
24,590
💭 Final Thoughts
Today’s session didn’t break anything major — but it also didn’t conquer anything new.Stuck between major support and resistance, the index is coiling for a move. Bulls have the burden of proof now.
🧠 “Markets don’t pause forever — compression leads to expansion. Be ready when it chooses its direction.”
✏️ Disclaimer
This is just my personal viewpoint. Always consult your financial advisor before taking any action.

XAUUSD: Accumulation in process,Waiting for Bullish DistributionHello,
Today, we will analyse the key points of each significant move.
Following the price’s all-time high at $3500, it experienced a sharp decline and failed to maintain that level. A substantial 2400 pips would have resulted in significant losses for many accounts. Initially, it was perceived as a minor correction, with the expectation of further price appreciation. However, this assumption proved incorrect. After reaching an even higher peak, the price invariably undergoes a more substantial correction.
At 3260, substantial bullish volume surged into the market, necessitated by the presence of a fair value gap. Subsequently, the price experienced a decline, reflecting the prevailing bearish trend, which favoured the bears. However, at 3200, a pivotal level representing a discounted price point, bull volume surged. This powerful bullish impulse propelled the price to 3432, ultimately confirming the bullish trend. AB=CD there recurring pattern emerged weekly. When the price reached the 3432 level as a fair value gap, the CD pattern commenced.
AB=CDTheHeyIndeed, we have identified a recurring pattern. It appears to be an equal move in any direction, and it has manifested precisely as anticipated. We were aware that the price would reject at 3120, and it did so accordingly. Currently, the market is in our favour. Upon market opening, it exhibited a positive gap, propelling the price to 3450. However, it subsequently declined, reaching 3384.
Presently, we find ourselves in the accumulation phase, poised for distribution. This distribution is anticipated to be substantial, potentially leading to another record high, potentially reaching 3650.
Moving forward, the price could continue towards our target from its current position. Alternatively, there exists a possibility that it may drain the sell-side liquidity and reverse from 3360-3370.
Our take-profit levels are set at 3450, 3490, 3520, and finally, 3600. When entering the market, it is advisable to employ a short time frame. It is important to note that this analysis is merely our opinion, and market conditions may deviate from expectations.
We extend our best wishes for success and safe trading. If you wish to demonstrate your support, you may consider liking, commenting, or sharing this analysis with others.
Sincerely,
Team Setupsfx_

USDT Dominance SHOWDOWN INCOMINGAfter a full liquidity sweep at 4.50%, USDT.D is now pressing into the EMA cluster from below…
📊 What does that mean?
➡️ Stablecoin dominance is rising = risk-off behavior creeping in
➡️ But we’re STILL under trend — and that green dot sweep could mean a fakeout bottom
🧠 If USDT.D breaks above EMAs → altcoins bleed
🔥 If USDT.D gets rejected here → altcoins pump hard
This is the pivot. Watch closely.

TON: The Cryptocurrency Powering Telegram’s FutureOKX:TONUSDT OKX:TONEUR
In the fast-paced world of cryptocurrencies, TON (The Open Network) stands out as a project with a compelling backstory and bold ambitions. Born from the vision of Telegram’s founders, the Durov brothers, TON was initially designed to bring blockchain technology into one of the world’s most popular messaging apps. Despite early regulatory setbacks, it has since evolved into an independent blockchain platform under the stewardship of the TON Foundation. With its deep ties to Telegram’s vast user base and innovative technology, TON is poised to make a significant impact in the crypto space.
First, what is TON?
TON, or so called The Open Network, is a decentralized blockchain platform originally conceived by Nikolai and Pavel Durov, the minds behind Telegram. The project began with an audacious goal: to integrate a cryptocurrency-then called Gram-into Telegram, enabling seamless digital payments and decentralized services for its users. However, in 2019, the U.S. Securities and Exchange Commission (SEC) intervened, questioning whether Gram was a security rather than a cryptocurrency. This regulatory clash forced Telegram to step back, and the project was handed over to the open-source community.
Today, TON operates independently under the TON Foundation, a non-profit organization dedicated to its development. While it no longer has a formal tie to Telegram’s corporate structure, TON remains closely linked to the app’s ecosystem, powering various features and positioning itself as a key player in the cryptocurrency.
Technology and Features
TON’s blockchain is engineered to deliver exceptional speed, scalability, and versatility, distinguishing it from many other cryptocurrencies. At its foundation lies a Proof-of-Stake (PoS) consensus mechanism, where validators stake their tokens to secure the network and process transactions. This method stands in stark contrast to the energy-intensive Proof-of-Work systems of older blockchains like Bitcoin, offering a more sustainable and efficient alternative. To manage high transaction volumes, TON incorporates sharding, a technique that divides the blockchain into smaller, parallel chains, enabling simultaneous transaction processing and significantly boosting scalability. Beyond its core architecture, TON supports smart contracts, opening the door for developers to create decentralized applications (dApps) tailored to diverse needs, such as payments or gaming. The platform also extends its functionality with TON DNS, a decentralized domain name system, and TON Storage, a file storage solution, enhancing its scope as a comprehensive blockchain ecosystem. Together, these attributes position TON as a sturdy backbone for both everyday financial activities and intricate decentralized innovations, paving the way for a wide range of future projects.
Use Cases and Applications
TON’s real-world value springs from its deep integration with Telegram, a messaging giant boasting over 700 million active users. This massive user base serves as a powerful launchpad for TON’s adoption. Within Telegram, the cryptocurrency facilitates seamless peer-to-peer payments, allowing users to transfer tokens directly to one another with ease. It also powers the app’s “gifts” feature, where people can buy and send virtual gifts, all processed efficiently on the TON blockchain. According to data from the Dune analytics platform, the total market cap of these Telegram gifts exceeded $200 million, which points to the growing popularity and acceptance of TON technology among users. Taking this a step further, developers can build Telegram Mini Apps that operate within the platform, leveraging TON for transactions and other functions-a development that could evolve Telegram into a “super-app” akin to some kind of China’s WeChat, where users access an array of services without leaving the interface. Outside of Telegram, TON’s versatility shines through its support for smart contracts, making it an appealing option for decentralized finance (DeFi) initiatives like lending platforms and decentralized exchanges. Its low-cost, high-speed transactions also make it ideal for non-fungible tokens (NFTs) and blockchain-based gaming, while its efficiency positions it as a promising tool for global payments, particularly in regions with limited financial infrastructure. As Telegram continues to improve its ecosystem, the role of TON is expected to grow, which could lead to widespread adoption of the cryptocurrency around the world.
Market Position and Further Potential
The cryptocurrency field is home to many notable players, and TON is one of them. As of mid-2025, its market capitalization stands at approximately $8 billion, ranking it among the top 20 cryptocurrencies globally. Moreover, as Pavel Durov noted, TON has become the number one blockchain in terms of daily NFT trading volume, which only strengthens more its position in the market and demonstrates its leadership in the rapidly growing segment of non-fungible tokens. Its daily trading volume of around $200 million signals robust liquidity and investor engagement.
Also several elements underpin TON’s promising trajectory. Telegram’s vast and active user base provides an unparalleled advantage, offering a ready audience that could accelerate adoption as blockchain features are further integrated into the app. Additionally, TON’s forward-thinking design, with its emphasis on scalability and efficiency, sets it apart from older, less agile blockchains, attracting both developers and users seeking cutting-edge solutions. The growing synergy between TON and Telegram, combined with the rising mainstream acceptance of cryptocurrencies, points to a strong future. Industry observers suggest that TON could ascend into the top 10 cryptocurrencies, propelled by its innovative technology and the strategic advantage of its Telegram ecosystem, positioning it as a formidable contender in the blockchain race.
Investment Considerations
TON presents to us with a compelling blend of potential rewards and inherent uncertainties. Its tight integration with Telegram offers a distinct edge, as few cryptocurrencies can tap into such an expansive and engaged user pool, potentially driving demand as the platform introduces more blockchain-based functionalities. The cryptocurrency’s advanced technological framework further enhances its appeal, equipping it to support the next generation of decentralized applications, from DeFi to NFTs, which could translate into significant growth if Telegram’s monetization efforts succeed. However, this opportunity comes with caveats. TON’s history, including its earlier regulatory tussle with the SEC, serves as a reminder of the persistent legal and compliance challenges that could shape its path forward. Like its peers, TON is not immune to the crypto market’s characteristic volatility, with prices susceptible to rapid shifts caused by sentiment or external events. It also faces fierce competition from entrenched giants like Ethereum and fast-rising networks like Solana, all battling for supremacy in the blockchain space. Despite these hurdles, TON’s unique strengths and strategic positioning make it an intriguing prospect for observation and possible investment in the future.
TON is more than just a cryptocurrency, it’s a blockchain platform with the potential to transform digital interactions, especially within the extensive Telegram ecosystem. Its innovative technology, coupled with Telegram’s global reach, sets the stage for pretty notable growth in the years ahead. Though challenges like regulation and competition persist, TON’s prospects remain promising.

Platinum for a short?after a bullish run, the fundamentals on platinum have shifted sharply into bearish bias, aligning perfectly with a key weekly supply zone. The recent weekly rejection candle confirms seller presence and validates the zone.

Gold has recently broken below its 4-hour bullish Fair Value GapGold Market Analysis (In-depth & Strategic Overview):
Gold has recently broken below its 4-hour bullish Fair Value Gap (FVG) and is currently trading beneath its Consequent Encroachment (CE) level — a signal that short-term bullish momentum has weakened.
In the latest 4H candle, the market swept the liquidity resting below the previous day's lows, a classic move to trap early sellers and collect stop-losses. Right after this liquidity grab, the price touched the daily bullish FVG, found support there, and then managed to close back inside the 4H FVG. This action reflects a temporary defense by buyers — but the battle is far from over.
📌 Key Levels to Watch:
$3401: This is a critical resistance level. If the market successfully closes above $3401, it could signal a bullish continuation, paving the way for an upward move.
$3389: This is a crucial support level. If price breaks below $3389, it would likely lead to further downside movement, opening the door for deeper corrections.
⏳ Current Strategy:
The best move right now is to wait and watch how the market reacts to these key levels. A breakout above $3401 would confirm strength and potential bullish continuation. Conversely, a breakdown below $3389 could trigger a fresh wave of selling pressure.
🚨 Until one of these levels is clearly broken, the market may remain in a state of indecision or range-bound movement.
🔍 Always DYOR – Do Your Own Research!
Stay informed, manage your risk wisely, and avoid emotional decisions.

Bullish Trend Remains IntactNatural Gas has been trading inside this rising channel for just over 2 years now. Tested the bottom of this channel for most of this year, now it’s looking to go back up to the top of the channel once again. I would stay long until it hits the top of the channel, unless it closes above the top of the channel on a weekly basis in which case that would be very bullish and I would stay long.

BTCUSD – Range Scalping Zones IdentifiedPrice tapped into a previous short zone near 108.6 and showed rejection. We’re watching for downside follow-through toward the 104.2 to 104.5 range where a potential long opportunity may form.
This chart outlines clean range-based levels for scalping. These zones line up with prior liquidity sweeps and local structure shifts. Scalpers can look to react at these levels depending on how price behaves when we get there.
Ideal for traders on lower timeframes like the 15m, but the concept applies across intraday setups. Always wait for confirmation before entering.

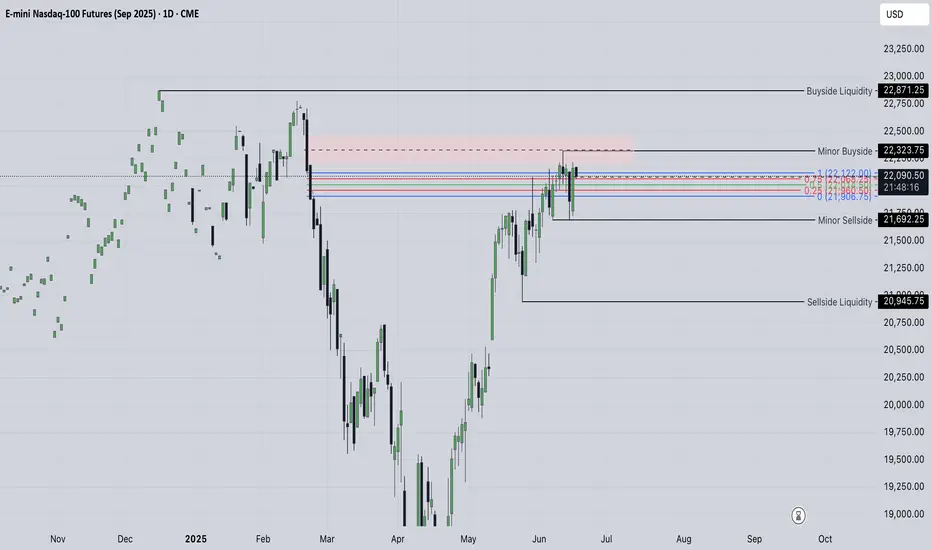
NQ studyI am quite sure the sharp move is coming... which way will it happen we will see, for longer term positions there are no reasonable entries, so once we get a breakout of this distribution or consolidation either way we are likely to see the bigger traders joining along which will accelerate the movement, so far we are looking bullish and ld like to see prices remain above the measured imbalance from 24th of february and its 50 % level, as well as going higher should let us overtake the pink imbalance positioned higher and the minor buyside though we have already received the rejection from that area.
in this case
Looking for sellside delivery first of all I am interested in the minor sellside (20945) as we have formed the equal lows down there, breaking this level will likely put us in shorts for a period of time receiving so called correction to the upward movement we had.
Eurofins Scientific SE Stock Quote | Chart & Forecast SummaryKey Indicators On Trade Set Up In General
1. Push Set Up
2. Range Set Up
3. Break & Retest Set Up
Notes On Session
# Eurofins Scientific SE Stock Quote
- Double Formation
* (Diagonal) - *Shift & Entry | Completed Survey
* (2nd Entry Area)) + *Lower Band Feature | Subdivision 1
- Triple Formation
* (P1)) / (P2)) & (P3)) | Subdivision 2
* (TP1) = a / Long Consecutive Range
* (TP2) = b / Short Consecutive Pullback | Subdivision 3
* Daily Time Frame | Trend Settings Condition
- (Hypothesis On Entry Bias)) | Indexed To 100
- Position On A 1.5RR
* Stop Loss At 118.00 EUR
* Entry At 123.00 EUR
* Take Profit At 128.00 EUR
* (Uptrend Argument)) & No Pattern Confirmation
* Ongoing Entry & (Neutral Area))
Active Sessions On Relevant Range & Elemented Probabilities;
European-Session(Upwards) - East Coast-Session(Downwards) - Asian-Session(Ranging)
Conclusion | Trade Plan Execution & Risk Management On Demand;
Overall Consensus | Buy

Macromics Group: Market Trends Overview (June 2025)Global Economic Landscape: What Has Changed?
June 2025 marks significant shifts in the global economy. After several years of instability caused by the pandemic, inflation, and geopolitical tensions, markets are gradually stabilizing. However, new challenges are emerging: rising risks in Asia, digital transformation in Europe, and strategy shifts in the U.S.
China and India continue to show strong growth rates—5.8% and 6.5% respectively. Europe, by contrast, is lagging behind due to slow recovery and persistent inflation. The U.S. maintains a steady course driven by consumer spending and innovation, reporting 2.1% GDP growth.
Macromics Group continues to deliver in-depth analytics and strategies for clients seeking to understand and capitalize on these changes. We analyze trends across more than 120 industries, helping companies adapt and thrive.
Macroeconomics and Monetary Policy: A Shift Toward Stabilization
Financial regulators have begun cautiously lowering interest rates after the peaks of 2024. The U.S. Federal Reserve has dropped its rate to 4.5%, while the ECB has reduced its rate to 3.75%. This is made possible by a decline in inflation: 2.7% in the U.S. and 3.1% in the EU.
Meanwhile, developing nations like Turkey and Argentina are still grappling with high inflation. These countries risk falling behind the global recovery unless decisive steps are taken.
Overall, the global course is toward soft stabilization: interest rates remain high but steady. This creates favorable conditions for investment and long-term planning.
Financial Markets: From Caution to Moderate Optimism
Stock markets in June 2025 show mixed performance. U.S. indexes such as the S&P 500 and Nasdaq hit new highs, thanks to the booming tech sector. Stocks of companies involved in AI, quantum computing, and cybersecurity are particularly strong.
European markets are less active but relatively stable. Growth is limited by high costs, demographic issues, and the transition to ESG standards. In Russia and CIS countries, markets are under pressure due to sanctions, currency restrictions, and reduced investment.
On the currency front, the U.S. dollar and Chinese yuan dominate. The ruble is volatile, the euro is stable, and the yen is strengthening as a safe haven asset.
Technology: The Engine of New Markets
The main trend in 2025 is AI and automation. Companies are deploying neural networks in logistics, marketing, finance, and HR to cut costs and boost efficiency. Demand for AI professionals and developers is surging.
5G infrastructure has matured in most developed countries, unlocking new potential in IoT, telemedicine, and remote work. At the same time, quantum computing is advancing rapidly, with commercial solutions expected by 2026.
Macromics Group invests in next-generation analytical platforms, enabling clients to access real-time insights and forecast trends before they go mainstream.
Energy and Sustainability: ESG and the “Green” Shift
Energy markets have stabilized after the turbulence of 2024. Oil prices remain between $70–$85 per barrel—comfortable for both producers and consumers. Meanwhile, renewable energy—solar, wind, and hydrogen—is seeing record investment.
Corporations are increasingly reporting according to ESG standards. It’s not just a trend, but a new business reality. Investors demand transparency, consumers prefer socially responsible brands, and regulators impose mandatory reporting.
Macromics Group supports clients in transitioning to sustainable models by developing ESG strategies, assessing risks, and offering financial solutions.
Conclusion: Outlook for the Second Half of 2025
The first half of 2025 showed that markets are learning to operate in a new reality. The global economy is no longer chasing rapid growth, but adapting to volatility. Key focus areas are technology, sustainability, and smart resource management.
For businesses, this means quick adaptation, innovative thinking, and reliance on data-driven decisions. In this context, Macromics Group serves not just as an analyst but as a strategic partner.
Our recommendation: act proactively. In times of uncertainty, those who plan years ahead and use quality data will win.

Nifty Analysis EOD – June 16, 2025 – Monday🟢 Nifty Analysis EOD – June 16, 2025 – Monday 🔴
📈 Expected Follow-Through Plays Out – Bulls Eye 25K Hurdle Next
Nifty opened flat-to-positive at 24,737, briefly dipped to the day’s low of 24,703.60, and then reversed smartly to touch an intraday high of 24,967.10 by 13:40. After that, the index spent the rest of the day consolidating in a narrow 40-point band and closed at 24,940.95 intraday (adjusted close: 24,946.50), delivering a solid +227.90 point gain.
As anticipated, the 24,768–24,800 support zone provided the launchpad for further upside, confirming the bullish follow-up from Friday's recovery. The rally tested 24,967, just shy of the crucial resistance at 24,972, which remains a key watch for the next session.
🔍 However, going forward, the bulls face major challenges around 25,000–25,080. This zone has acted as a hurdle in the past and could either stall the rally or serve as a breakout trigger. Watch price behavior carefully around these levels to assess conviction.
🛡 5 Min Chart with Levels
🕯 Daily Time Frame Chart
🕯 Daily Candle Breakdown
Open: 24,732.35
High: 24,967.10
Low: 24,703.60
Close: 24,946.50
Change: +227.90 (+0.92%)
📊 Candle Structure Breakdown
Real Body: 214.15 pts → 🟢 Strong Green Candle
Upper Wick: 20.60 pts
Lower Wick: 28.75 pts
🔍 Interpretation
Opened near day’s low, closed near day’s high — classic bullish sentiment.
Small wicks show controlled buying with minimal resistance and shakeouts.
Reinforces the bulls’ momentum after Friday’s OL recovery candle.
🔦 Candle Type
💚 Bullish Marubozu–type / Bullish Continuation Candle– Often found during the middle leg of a bullish swing, signaling strong trend momentum.
📌 Key Insight
Today's price action confirmed continuation of the recovery.
Close above 24,950–25,000 in the next session could ignite fresh upside.
Rejection around 25,060–25,080 would indicate caution — stay nimble.
🛡 5 Min Intraday Chart
⚔️ Gladiator Strategy Update
ATR: 268.49
IB Range: 114.05 → Medium IB
Market Structure: ⚖️ Unbalanced
Trades:
✅ 10:20 AM – Long Triggered → Target Achieved, Trailing SL Hit (RR: 1:3.28)
📌 Support & Resistance Zones
Resistance Levels
24,972 ~ 25,000
25,060 ~ 25,080
25,102 ~ 25,125
Support Levels
24,894 ~ 24,882
24,825 ~ 24,847
24,725 ~ 24,735
24,660
💭 Final Thoughts
The market played exactly as mapped — now it’s about decision time near 25K. Will the bulls charge ahead or pause? Either way, the structure favors short-term bullishness — but profit booking pressure near resistance must be expected.
🧠 “Momentum is a gift – but without volume and conviction, it fades at resistance.”
✏️ Disclaimer
This is just my personal viewpoint. Always consult your financial advisor before taking any action.

ETHUSDT Daily: Navigating the "Deciding Area" Chart Overview:
The ETHUSDT Daily chart presents a compelling narrative of a significant uptrend, followed by a sharp correction, and now shows price approaching a critical inflection point. Key support and resistance zones, along with a crucial trendline, define the current market structure. The chart is labeled "Bullish," suggesting the analyst's long-term bias or expectation of a continuation of the prior uptrend.
1. The Prior Bullish Trend (Late 2023 - Early 2025):
Long-Term Uptrend Line (Green): From around September 2023 into early 2025, ETHUSDT exhibited a strong bullish trend, respecting a clear upward-sloping trendline (highlighted in green). Price consistently found support on this trendline, indicating robust buying pressure and a controlled ascent.
Key Resistance ($3900 to $4000): During this period, ETH encountered significant resistance around the $3900 to $4000 zone. This area represents a supply zone where sellers stepped in, preventing further upward movement on multiple attempts.
2. The Major Correction & Trendline Breakdown (Early 2025):
Sharp Downturn: In early 2025, ETHUSDT experienced a steep and aggressive correction. This bearish impulse led to a decisive breakdown below the long-term green uptrend line.
Shift in Momentum: The breach of this established trendline was a critical event, signaling a significant shift in short-to-medium term momentum from bullish to bearish.
3. Finding Support & Bounce Back:
Weekly Support ($2000 to $2200): After the breakdown, price found initial strong support in the $2000 to $2200 zone. This area had acted as a crucial pivot in previous price history, demonstrating its significance as a demand zone.
Strong Support ($1400 to $1500): Below the weekly support, the $1400 to $1500 zone is identified as "Strong support." This would be the next major demand area if the 2000−2200 level were to fail. The chart shows price briefly dipping below the 2000−2200 zone before finding a base and initiating a strong rebound.
Recent Bounce: The current price action shows a strong bounce from the lows reached after the trendline breakdown, indicating renewed buying interest and an attempt to recover.
4. The "Deciding Area" ($2900 to $3000 & Red Trendline):
Confluence of Resistance: The most critical area on the chart is the "Deciding Area," which represents a confluence of significant resistance levels:
The Former Green Trendline (now acting as resistance): What was once a strong support trendline has now likely flipped to become a resistance trendline (implied by the red line, which is parallel or an extension of the green line). Price often retests broken trendlines before continuing in the new direction.
Horizontal Resistance Zone ($2900 to $3000): This grey box aligns with previous support/resistance levels and now acts as a key overhead supply zone.
Current Price Engagement: Price is currently approaching the lower boundary of this "Deciding Area." This zone will determine the immediate future direction of ETH.
Potential Scenarios:
Bullish Continuation (Breakout): If ETHUSDT can successfully break above the "Deciding Area" ($2900 to $3000 zone and the red trendline) with strong volume, it would signal a significant shift in buying conviction. The next logical target would be the "Key Resistance $3900 to $4000" area, and potentially a retest of its all-time highs. The current bullish arrow on the chart suggests this is the anticipated move if the "Deciding Area" is breached.
Bearish Rejection (Reversal): A strong rejection from the "Deciding Area" could see ETHUSDT consolidate or retrace back towards the "Weekly Support $2000 to $2200" zone. A failure to hold this support could then lead to a test of the "Strong Support $1400 to $1500."
Conclusion:
ETHUSDT is at a pivotal point, engaging with a highly significant "Deciding Area" that combines both horizontal and trendline resistance. The ability of the bulls to push through this zone will be crucial for determining whether the rally from the recent lows can continue towards prior highs or if ETH will face another period of consolidation or deeper correction. Traders should closely monitor price action and volume at these critical levels for confirmation of the next directional move.
Disclaimer:
The information provided in this chart is for educational and informational purposes only and should not be considered as investment advice. Trading and investing involve substantial risk and are not suitable for every investor. You should carefully consider your financial situation and consult with a financial advisor before making any investment decisions. The creator of this chart does not guarantee any specific outcome or profit and is not responsible for any losses incurred as a result of using this information. Past performance is not indicative of future results. Use this information at your own risk. This chart has been created for my own improvement in Trading and Investment Analysis. Please do your own analysis before any investments.

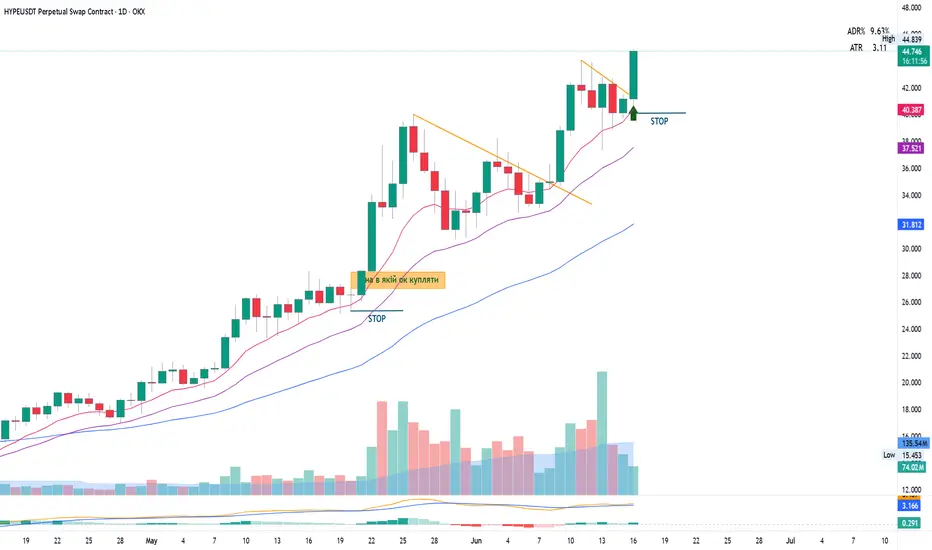
Breakout dayGood setup, good chart.
Surfing 10 and 20 ema`s (1D).
Seems like a breakout day.
Stop below 1D low.
Target ? Sky is a limit )
BTCUSDT Daily: Analyzing Key Support & ResistanceChart Overview:
BTCUSDT Chart indicates the price action from a bearish phase into a significant bullish reversal and subsequent consolidation. Key price levels, market structure shifts, and Fibonacci retracement zones are highlighted, offering potential areas of interest for traders.
1. The Bearish Phase & Breakdown (February - April):
• Initial Downtrend: The price initially depicts a downtrend characterized by a series of lower highs and lower lows, indicating strong bearish control.
• "Break Down": In late February/early March, price decisively broke below a significant support level (indicated by the "Break Down" label). This confirmed the continuation and strength of the bearish momentum, pushing BTCUSDT to lower lows around the $76,000 region.
2. The Market Structure Change (Late April - Early May):
• Trend Reversal: Following the lows in April, we observe a strong bullish impulse. This rally culminated in price breaking above a critical resistance zone (highlighted by the upper grey box labeled "Market Structure Change").
• Significance: This "Market Structure Change" is a pivotal event. It signifies a shift from bearish control (lower highs/lows) to bullish dominance (higher highs/lows), as previous resistance becomes potential support (a "flip" level). This is often the first major sign of a trend reversal.
3. The Bullish Impulse & All-Time High (May - Early June):
• Strong Uptrend: After the market structure change, BTCUSDT experienced a powerful bullish move, establishing new higher highs.
• "All Time High at $112,000": The price reached a new all-time high around $112,000 (specifically labeled as 111,999.0). This peak marks the top of the measured bullish impulse, which serves as the anchor point for the subsequent Fibonacci retracement.
4. Current Consolidation & Fibonacci Retracement (June - Present):
• Pullback from ATH: Following the new all-time high, BTCUSDT has pulled back and entered a period of consolidation, exhibiting a ranging behavior.
• Fibonacci Retracement: A Fibonacci retracement tool has been applied from the significant swing low (around $93,389.7, which is the 1.0 Fib level relative to the ATH) to the "All Time High." This tool helps identify potential support levels where price might find buyers during a pullback.
o "Daily Immediate Support": This area, approximately between $102,694.4 (0.5 Fib) and $100,498.5 (0.618 Fib), has acted as strong immediate support. Price has bounced from this zone multiple times, confirming its significance. The 0.618 Fibonacci level is often referred to as the "Golden Ratio" and is a highly watched retracement level for potential reversals or strong support.
o "Daily Key Support": This deeper support zone, around $93,389.7 (which aligns with the 1.0 Fib of the previous swing and the prior "Market Structure Change" area), represents a critical level. If the "Daily Immediate Support" fails, this zone would be the next major test for bullish continuation. Its alignment with the previous market structure change adds to its importance as a "flip" level (former resistance turned support).
• "Daily Target": The label "Daily Target" is positioned near the previous highs/resistance. In the current context of consolidation and pullback, this area now acts as a key resistance zone that bulls would need to overcome to resume the uptrend towards new all-time highs. It represents the immediate bullish objective.
Potential Scenarios:
• Bullish Continuation: If BTCUSDT continues to hold above the "Daily Immediate Support" (green zone) and then breaks above the "Daily Target" resistance with conviction, it would signal a likely continuation of the uptrend towards new all-time highs above $112,000.
• Deeper Retracement: A breakdown below the "Daily Immediate Support" would likely lead to a test of the "Daily Key Support" (lower grey zone). A strong bounce from this level would still keep the bullish structure intact for the larger timeframe.
• Trend Invalidaton/Reversal: A decisive break below the "Daily Key Support" (lower grey zone / 1.0 Fib of the prior swing) would be a significant bearish development, potentially invalidating the recent bullish market structure and indicating a deeper correction or even a reversal of the current uptrend.
Conclusion:
BTCUSDT is currently in a consolidation phase after a strong rally to new all-time highs. The immediate focus is on whether the "Daily Immediate Support" holds. Traders should closely monitor price action around both the immediate and key support zones, as well as the "Daily Target" resistance, for clues on the next directional move. Volume confirmation for any breakouts or breakdowns will be crucial.
Disclaimer:
The information provided in this chart is for educational and informational purposes only and should not be considered as investment advice. Trading and investing involve substantial risk and are not suitable for every investor. You should carefully consider your financial situation and consult with a financial advisor before making any investment decisions. The creator of this chart does not guarantee any specific outcome or profit and is not responsible for any losses incurred as a result of using this information. Past performance is not indicative of future results. Use this information at your own risk. This chart has been created for my own improvement in Trading and Investment Analysis. Please do your own analysis before any investments.

Bank Nifty Weekly Insights: Key Levels & TrendsBank Nifty ended the week at 55,527.35 with a loss of -1.86%
Key Levels for the Upcoming Week
🔹 Price Action Pivot Zone:
The critical range to monitor for potential trend reversals or continuation is 55,410 to 55,645
🔹 Support & Resistance Levels:
Support Levels:
S1: 55,058
S2: 54,588
S3: 54,119
Resistance Levels:
R1: 56,000
R2: 56,474
R3: 56,947
Market Outlook
✅ Bullish Scenario: A sustained move above 55,645 could trigger buying momentum, potentially driving Bank Nifty towards R1 (56,000) and beyond.
❌ Bearish Scenario: If the index falls below 55,410, selling pressure may increase, pulling it towards S1 (55,058) and lower levels.
Disclaimer: lnkd.in
