USOIL Remains Bullish Amid Geopolitical Tensions and Steady Fed USOIL – Bullish Outlook Amid Geopolitical and Policy Factors
The ongoing escalation in the Middle East, combined with Jerome Powell's stance on holding interest rates steady, continues to support bullish momentum across commodities, including oil.
Technical Outlook:
USOIL remains bullish as long as it trades above 72.72 and more firmly above 70.40, with upside potential toward 77.30 and 79.50. If bullish momentum persists, a further extension to 84.14 is possible, supported by geopolitical risks.
A bearish shift is only likely if significant de-escalation or negotiations between Israel and Iran take place.
Key Levels:
• Pivot Point: 72.90
• Resistance: 77.29, 79.50, 84.10
• Support: 66.87, 63.52, 59.00
Trend Outlook:
Bullish while price holds above 68.53
Pivot Points

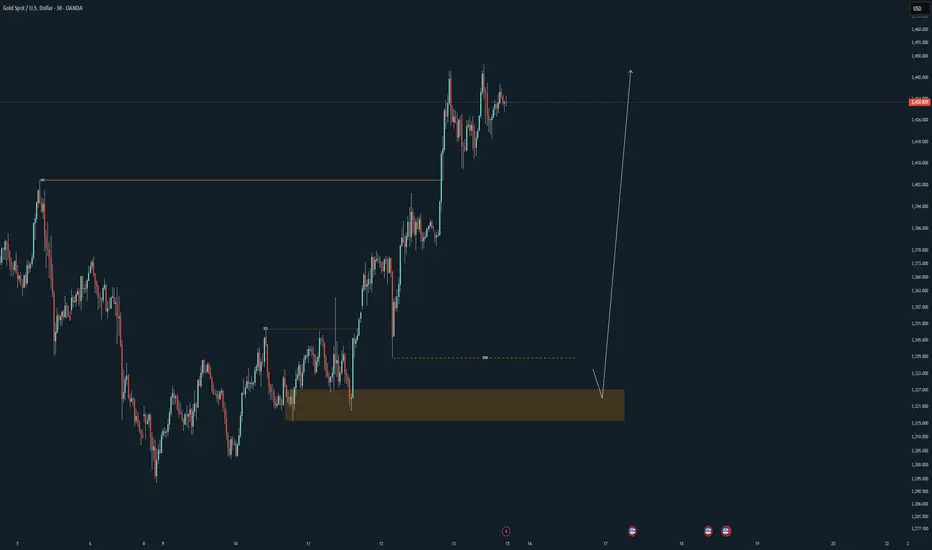
Gold weekly outlookFib zones for buys and sells as well as the regression trend channel.
I suspect Gold will reverse to the upside soon, possibly once the Gap is filled

Block Inc Stock Quote | Chart & Forecast SummaryKey Indicators On Trade Set Up In General
1. Push Set Up
2. Range Set Up
3. Break & Retest Set Up
Notes On Session
# Block Inc Stock Quote
- Double Formation
* (A+ Set Up)) At 85.00 USD | Completed Survey
* (2nd Entry Area)) + Anchored VWAP - *A+ | Subdivision 1
- Triple Formation
* (P1)) / (P2)) & (P3)) | Subdivision 2
* (TP1) = a / Long Consecutive
* (TP2) = b / Short Consecutive | Subdivision 3
* Daily Time Frame | Trend Settings Condition
- (Hypothesis On Entry Bias)) | Regular Settings
- Position On A 1.5RR
* Stop Loss At 67.00 USD
* Entry At 61.00 USD
* Take Profit At 52.00 USD
* (Downtrend Argument)) & No Pattern Confirmation
* Ongoing Entry & (Neutral Area))
Active Sessions On Relevant Range & Elemented Probabilities;
European-Session(Upwards) - East Coast-Session(Downwards) - Asian-Session(Ranging)
Conclusion | Trade Plan Execution & Risk Management On Demand;
Overall Consensus | Sell

TONUSDT On the @TONUSDT chart, price is currently making a corrective move after reacting to the key support at 2.800. It may rise toward the 3.230 resistance and potentially break higher with a pullback to continue upward. However, if the 2.800 support fails, a deeper drop could follow. ⚠️📉
Resistances:
• 3.230 💥
• 3.371 🔼
• 3.656 🔼
• 3.948 🚀
Supports:
• 2.910 🛡️
• 2.800 🔻
⚠️Contorl Risk management for trades.

CL ready for new move upBased on time fib and Feigenbaum constants, CL is closing in on the bottom for this swing, expected within marked timezone. The swing highs/lows follows the Feigenbaum projections for the last few swings. I expect a dip below $57 before a new run higher, at least to $72-73.

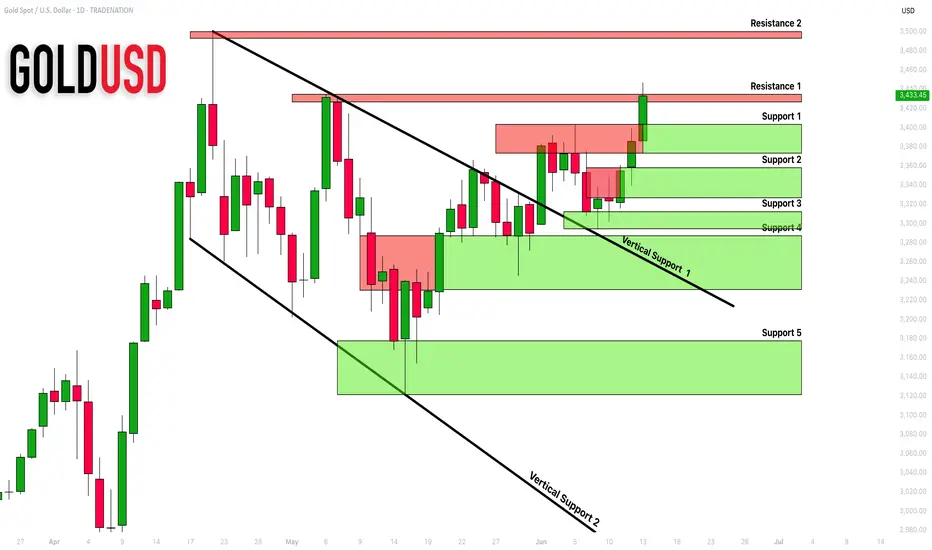
GOLD (XAUUSD): Support & Resistance Analysis For Next Week
Here is my latest structure analysis and
important supports & resistances for GOLD XAUUSD
for next week.
Consider these structures for pullback/breakout trading.
❤️Please, support my work with like, thank you!❤️
I am part of Trade Nation's Influencer program and receive a monthly fee for using their TradingView charts in my analysis.
Nifty Analysis EOD – June 13, 2025 – Friday 🟢 Nifty Analysis EOD – June 13, 2025 – Friday 🔴
🕊️ Gap-Down on Geopolitical Tension – Buyers Step In at Crucial Support
Nifty opened with a massive gap-down of 415 points at 24,473 triggered by overnight geopolitical tensions — testing a crucial swing low from May 22. Interestingly, the market formed an OL (Open = Low) pattern and staged a powerful 281-point intraday recovery, closing near the day’s high at 24,718.60.
While the adjusted close still reflects a −0.68% drop, the price action was dominantly bullish. The strong bounce from the 24,460–24,520 demand zone — a region that had acted as a reversal zone multiple times earlier — reaffirms its significance.
🧭 If global cues stabilize or turn positive, this could pave the way for a bounce back toward 25,000. But if Friday’s low is breached, sentiment damage may deepen further. For now, intraday opportunities are preferable over positional plays, as uncertainty persists.
📝 A reminder from the May 22 note:
“Is the retracement run finished? Technically, YES. A bold call, but unless global headwinds reappear, today’s low must sustain.”
Nifty has once again honored this level — but the coming sessions will determine whether this bounce was genuine or temporary.
🛡 5 Min Chart with Levels
🕯 Daily Time Frame Chart
🕯 Daily Candle Breakdown
Open: 24,473.00
High: 24,754.35
Low: 24,473.00
Close: 24,718.60
Net Change: −169.60 (−0.68%)
📊 Candle Structure Breakdown
Real Body: 245.60 pts → 🟢 Strong Green Candle
Upper Wick: 35.75 pts
Lower Wick: None (OL Formation)
🔍 Interpretation
Despite the gap-down, bulls took control right from the open.
The absence of a lower wick signals firm intraday confidence.
Closing near the high reinforces the buying strength, even on a net down day.
🔦 Candle Type
💚 Bullish Marubozu–like (OL) Candle– Represents a strong intra-session reversal, where buyers dominated from the very first tick.
📌 Key Insight
Price respected the 24,460–24,520 zone, once again validating it as key support.
If the next session crosses and sustains above 24,750–24,770, a short-term reversal confirmation could follow.
However, a breakdown below 24,473 may renew bearish pressure.
🛡 5 Min Intraday Chart
⚔️ Gladiator Strategy Update
ATR: 269.05
IB Range: 145.05 → Medium IB
Market Structure: Balanced
Trades:✅ 10:20 AM – Long Triggered → Target Achieved, Trailing SL Hit (RR: 1:1.7)
📌 Support & Resistance Zones
Resistance Levels
24,725 ~ 24,735
24,825 ~ 24,847 (Fibonacci 0.5 retracement level)
24,882 ~ 24,894
24,972 ~ 25,000
25,060 ~ 25,080
Support Levels
24,660
24,640 ~ 24,625
24,420
24,365 ~ 24,330
24,245 ~ 24,220
💭 Final Thoughts
Friday’s session was a battle between fear and resilience — and bulls showed up just in time. The key test ahead: can the index reclaim 25K or will the bounce fade away?
🧠 “Great rebounds are born from great fear — but follow-through is what separates noise from reversal.”
✏️ Disclaimer
This is just my personal viewpoint. Always consult your financial advisor before taking any action.

15.06.2025Gold has recently dazzled markets, surging past $3,400 per ounce, propelled by a potent mix of geopolitical tension and a softer U.S. dollar. Key levels to watch for the next week Support at 3380, Resistance at 3460. the Renewed Middle East tension could drive the price to the new highs at 3660 on the downside fail of 3380 will bring the price back to 3260 .

USDJPY| Bull vs Bear at Key ZoneUpdated the chart and noticed both bullish and bearish order blocks near current price — classic tug-of-war setup, and USDJPY does this often.
Structure is still developing, and the direction will be confirmed through how price reacts on the entry timeframes. Whichever side mitigates first with intent gives the trade.
Until then, it’s observation mode — watching closely and letting price reveal the path.
— Inducement King 👑
Bless Trading!

USDJPY| Bearish Structure in FocusUSDJPY broke a major lower high on the 4H, creating new external liquidity that has yet to be swept. This shift opened the door for potential bearish continuation.
On the 30-minute, I confirmed bearish intent with a major low taken. Structure aligns, but patience is key — I’m only interested in entries within premium pricing.
Now watching for buy-side liquidity to be swept into my marked order block. That reaction will be the signal for possible downside continuation.
Setup is clear. Execution comes with precision.
— Inducement King 👑
Bless Trading!

Let’s break down what's currently happening in the GBP/USD.GBP/USD Analysis in a Simple and Beginner
Let’s break down what's currently happening in the GBP/USD market, in a way that even someone without any trading experience can grasp easily.
At the moment, the market attempted to break out on the buy (upside), but it faced rejection, meaning it tried to go higher but couldn’t sustain that move and started falling down.
As the price dropped, it reached a point where a bullish engulfing pattern had previously formed this is a special pattern in trading which often signals a potential strong buying opportunity.
Now, here’s the key point:
📍 If the market comes back down to this engulfing buy zone, there's a high probability that it will bounce back up strongly from there think of it like a spring that’s been compressed and is ready to launch upward.
On the other hand:
📍 If the market doesn’t come down and instead continues moving upward, then we already have a bearish engulfing pattern waiting at a higher level. This is a zone where the market could face resistance and fall sharply again.
So what should you do?
✅ Be patient — let the market come to these important engulfing levels.
✅ Don’t rush into trades. Let the price touch these zones and then observe the reaction.
These engulfing zones are like magic they often predict powerful movements. Wait for the price to reach the level, and then watch the magic unfold.
Even if you're new to trading, this kind of analysis helps you understand when and where the market might turn without needing complicated indicators.
DYOR! Not Financial Advice.

NAS100\ Bullish Play DevelopingNasdaq holds a strong bullish structure on the 4H, so I moved down to the 15-minute for a cleaner bird’s-eye view of price action. Liquidity was swept directly into a refined order block — a precise tap that validated the zone.
Price is now hovering around a 5-minute OB. Just observing and letting the market unfold.
Discipline and patience — that’s where the edge is.
— Inducement King 👑
Bless Trading!

GBPUSD| Bullish Structure HoldingGBPUSD continues to map out a bullish structure. While higher timeframe liquidity remains untouched, I’m anticipating a potential continuation on the lower timeframes.
Refined the 30-minute structure and confirmed bullish intent is intact. Now focused on price taking short-term liquidity and mitigating into the marked order block before considering any execution.
The setup is developing — staying patient and letting price come to me.
— Inducement King 👑
Bless Trading!

GBPJPY| Bullish Shift in ProcessGBPJPY broke its major lower high on the 4H, signaling a shift in directional intent to the upside. While external liquidity remains intact, I’m monitoring for a potential continuation setup.
On the 30-minute timeframe, price broke a significant high and internal structure is now aligned with bullish order flow. I’ve marked a near-term zone where price may pull back into — specifically watching for a sweep of short-term liquidity within an internal order block.
No rush. Just waiting for price to offer a high-probability entry aligned with refined structure and flow.
— Inducement King 👑
Bless Trading!

XAUUSD| Bullish Momentum Building with CLean StructureGold continues to show strong bullish momentum, with price steadily climbing and maintaining upward pressure.
I dropped to the 30-minute chart to refine structure, and the bullish narrative remains intact.
At this point, I’m allowing price to develop — waiting patiently for a potential liquidity sweep that aligns with my criteria.
No chasing, no guessing — just reading the market and executing when the story aligns.
Refined structure. Momentum confirmed.
Patiently waiting to act — as always, precision is key.
— Inducement King 👑
Bless Trading!
EU Loading the Next Leg Up| Bullish Bias in MotionEU gave that clean 4H high break — strong bullish intent locked in.
Zoomed into the 30M and spotted that refined structure doing what it does.
Now just sitting tight, waiting on market open to see if price wants to bless the kid with that next leg up.
High timeframe bias is bullish.
Mid-timeframe structure aligned.
It’s patience time — sniper mentality 🧠🎯
Bless Trading!

Federal Realty Trust Quote | Chart & Forecast SummaryKey Indicators On Trade Set Up In General
1. Push Set Up
2. Range Set Up
3. Break & Retest Set Up
Notes On Session
# Federal Realty Trust Quote
- Double Formation
* (Reversal Argument)) At 120.00 USD | Completed Survey
* (A+ SIgnal)) - *Swing Low | Subdivision 1
- Triple Formation
* (P1)) / (P2)) & (P3)) | Subdivision 2
* (TP1) = a / Long Consecutive
* (TP2) = b / Short Consecutive | Subdivision 3
* Daily Time Frame | Trend Settings Condition
- (Hypothesis On Entry Bias)) | Regular Settings
- Position On A 1.5RR
* Stop Loss At 87.00 USD
* Entry At 95.00 USD
* Take Profit At 105.00 USD
* (Neutral Argument)) & No Pattern Confirmation
* Ongoing Entry & (Neutral Area))
Active Sessions On Relevant Range & Elemented Probabilities;
European-Session(Upwards) - East Coast-Session(Downwards) - Asian-Session(Ranging)
Conclusion | Trade Plan Execution & Risk Management On Demand;
Overall Consensus | Neutral

AAVEUSDT 📊The current price BINANCE:AAVEUSDT is trading in a range between 275 and 240 dollars, and it’s likely we’ll see a fake breakout to 300 dollars. After this move, the price is expected to correct to 240 dollars and then head for a bigger move toward 320 dollars and higher.
📈If the 240-dollar level breaks, the next support levels at 210 and 175 dollars should be watched.
🔼Support Levels: 240, 210, 175 dollars
🔽Resistance Levels: 275, 300, 320 dollars

#XAUUSD[GOLD]:+2200 Pips Big Move! | Setupsfx_|Gold is currently accumulating in smaller timeframes, which suggests it’s in the early stages of a significant move. It’s possible that the price will reverse from either of the entry zones. There are three take-profit areas you can target, but only if they align with your view. This is an educational post, so please don’t blindly follow it – do your own analysis.
Like and comment for more!
Team Setupsfx_

Bull Trap or Just the Beginning? All Eyes on 103kOnce we cleared the 109k ATH, I began tracking this new structure (in blue). Considering the current macroeconomic backdrop, it’s starting to make a lot more sense.
There’s plenty of noise about this being the biggest bull run in recent times, but looking at the chart, FVGs left behind, lack of volume commitment, and inefficient price action… are we actually gearing up for one of the largest bear markets we’ve seen instead?
You really don’t want to see a weekly close below 103k.

XAUUSD BreakdownHere we are waiting for the price to take liquidity at 3447.5 then test to our supply zone to trade to the demand zone at 3370.7-3339.5 .
i will inform in the group before we enter the trade .
Please folow to support me !

Caught EU clean today. Waited patiently for that textbook 30M liquidity sweep, then stalked the LTF entry like a sniper. No rushing—just letting price do its thing until it stopped running. Then we pounced. 💥
Execution was sharp. Setup was smooth.
This is how we trade over here—precision, patience, and purpose.
📉 Stay tuned for the breakdown and upcoming analysis.
Would love to hear y’all thoughts on this one 👀👇
#SMC #Forex #InducementKing #EUTrade #SmartMoneyFlow
Bless Trading!

XAUUSD(GOLD): +1874 PIPS Target| Touching $3600? Gold experienced a significant price surge, driven by the ongoing conflict between Iran and Israel. This heightened uncertainty among global investors led to a price touch of $3445. The current price is accumulating, and we anticipate a strong bullish distribution in the near future. Please prioritise accurate risk management during trading.
Good luck,
Team Setupsfx_
