Everybody loves Gold Part 2A good start to Gold Journey
In Part 2, we highlight a cluster of levels around close of Week 21. Price could however gap up or down and that will determine next moves.
At the moment though, we expected price to follow the arrow path for a down week.
Pivot Points

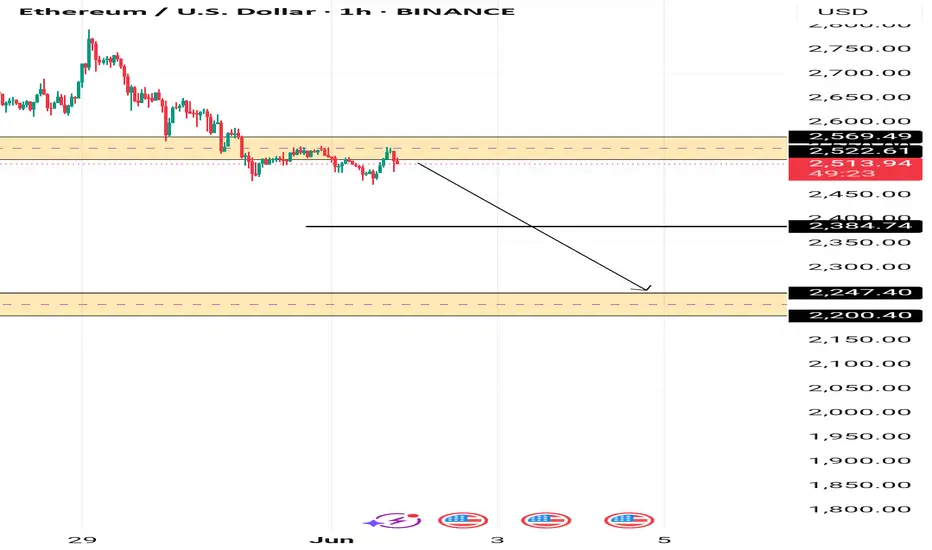
ETHERUEM PIVOT AREAETHEREUM is currently under our pivot area between 2522.21 and 2569.69. with bears in control for the moment.
If the price fails to break above this area we could see 2384 and 2247 as next targets
XUSDT Reversal Point - Buying OpportunityIn the upcoming week, starting from June 2nd, I anticipate a price drop to 0.00006388. This level could serve as a potential reversal point, but only if the price reaches it within the current week. Please note that this price level is valid only for one week; after that, the chart conditions and traders' behavior must be re-evaluated

British American Tobacco Stock Quote | Chart & Forecast SummaryKey Indicators On Trade Set Up In General
1. Push Set Up
2. Range Set up
3. Break & Retest Set Up
Notes On Session
# British American Tobacco Stock Quote
- Double Formation
* (Diagonal) - (P1)) - *90.00 GBP Long Support | Completed Survey
* (P2)) - *106.00 GBP | Subdivision 1
- Triple Formation
* 12345 Wave Feature & Lower Band Set Up | Subdivision 2
* (TP1) | Subdivision 3
* Daily Time Frame | Trend Settings Condition
- (Hypothesis On Entry Bias)) | Indexed To 100
- Position On A 1.5RR
* Stop Loss At 135.00 GBP
* Entry At 140.00 GBP
* Take Profit At 148.00 GBP
* (Uptrend Argument)) & No Pattern Confirmation
* Ongoing Entry & (Neutral Area))
Active Sessions On Relevant Range & Elemented Probabilities;
European-Session(Upwards) - East Coast-Session(Downwards) - Asian-Session(Ranging)
Conclusion | Trade Plan Execution & Risk Management On Demand;
Overall Consensus | Buy

De la Rue Stock Quote | Chart & Forecast SummaryKey Indicators On Trade Set Up In General
1. Push Set Up
2. Range Set up
3. Break & Retest Set Up
Notes On Session
# De la Rue Stock Quote
- Double Formation
* (Diagonal) - *77.00 GBP - Uptrend Bias On Entry Support | Completed Survey
* (P1)) - *100.00 GBP - *Retest Area | Subdivision 1
- Triple Formation
* 50 EMA - *Upper & Lower Band | Subdivision 2
* (TP1) | Subdivision 3
* Daily Time Frame | Trend Settings Condition
- (Hypothesis On Entry Bias)) | Regular Settings
- Position On A 1.5RR
* Stop Loss At 123.00 GBP
* Entry At 128.00 GBP
* Take Profit At 137.00 GBP
* (Uptrend Argument)) & No Pattern Confirmation
* Ongoing Entry & (Neutral Area))
Active Sessions On Relevant Range & Elemented Probabilities;
European-Session(Upwards) - East Coast-Session(Downwards) - Asian-Session(Ranging)
Conclusion | Trade Plan Execution & Risk Management On Demand;
Overall Consensus | Buy

TSLA (Daily) Elliot Wave 3 UnderwayTSLA appears to still be printing a motif wave 3 after finding a bottom at the $208 high volume support node. Fib extension targets suggest we have much higher to go including a new all time high.
Upside resistance target sits just below $413 in the HVN.
Downside targets may test the previous swing high $284
Safe trading

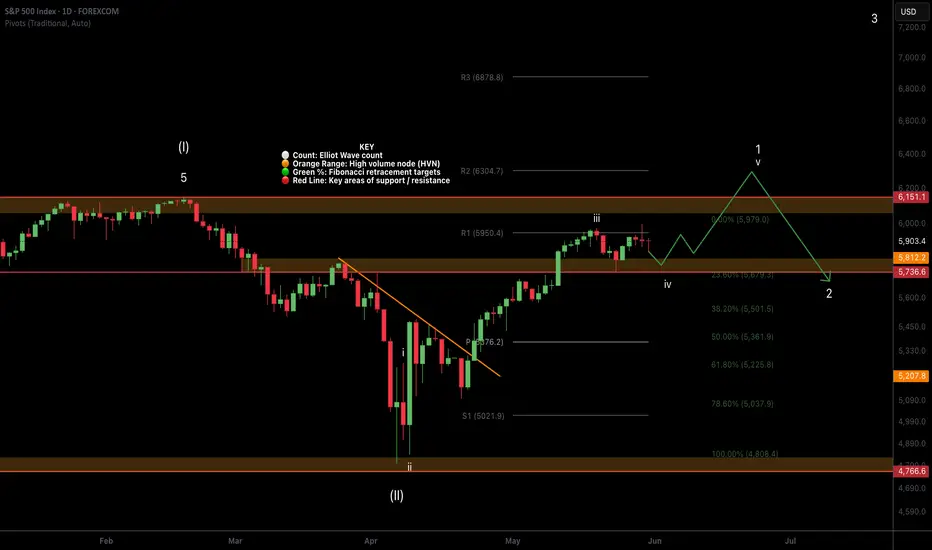
SPX500 (Daily) Elliot wave 4 underwaySPX appears to be printing a wave 4, potentially a triangle giving the proximity to the all the time high. Triangles are a motif wave ending pattern with a thrust up afterwards, typically a poke above the previous all time high before retracing trapping retail with FOMO.
Wave 2 is expected to retrace to the bottom of the triangle / wave 4 currently the high volume node support and .236 Fibonacci retracement at $5680
Safe trading
ETH (Daily) Holding up significantly wellETH is holding up its motif wave 1 rally significantly appearing to have completed an ending diagonal for wave 5 after finding a bottom at the major support high volume node (HVN).
Wave 2 is expected to retrace to the S1 pivot, 61.8 Fibonacci retracement and HVN at $1930 but may be front run at the daily pivot and wave 4 bottom $2300.
Safe trading

BTC (Daily) Elliot Wave 2 UnderwayBTC appears to have completed a motif wave (1) poking above all time high after printing a triangle for wave 4. Triangles are an ending pattern with a final thrust up afterwards typically breaking all time highs before reversing in wave 2, selling into retail FOMO.
Wave 2 has a $92k target at 0.5 Fibonacci retracement and high volume support node.
Wave 3 should be a powerful move up taking price way into all time high.
Safe trading

XRP (Daily) Complex Correction WXYXZXRP appears to have a complex correction underway with a series of ABCs in a descending channel after reaching all time high.
Price is just above the 61.8 Fibonacci retracement and high volume support node which is likely to test at $1.95.
Analysis is invalidated if price breaks above wave X swing high.
Ultimately it is trapped in a large range.
Safe trading

SUI (Daily) Elliot wave ii underwaySUI appears to have completed a motif wave (1) with an ending diagonal after finding a bottom at the major support high volume node (HVN) macro wave 4.
Wave 2 has not retraced as deep as other alt coins showing strength in the move up. The downside target is the HVN it has just tested at the 0.382 Fibonacci Retracement $2.95.
Wave 3 should be a powerful move up taking price into all time high.
Failure to hold this support could see price heading back to fresh lows and testing the $1.6 HVN once more.
Safe trading

Fet (Daily) Elliot Wave ii underway after ending diagonalFetch appears to have completed a motif wave (1) with an ending diagonal after finding a bottom at the major support high volume node (HVN) macro wave 4.
Wave 2 has not retraced as deep as other alt coins showing strength in the move up. The downside target is just above the wave (1) swing high, the 0.618 Fibonacci Retracement.
Wave 3 should be a powerful move up taking price into all time high.
Failure to hold this support could see price heading back to fresh lows and testing the $0.35 HVN once more.
Safe trading

SOL Local Elliot Wave ii UnderwaySolana appears to have completed a motif wave 1 after finding a bottom at the major support high volume node (HVN) macro wave 4.
Wave 2 has not retraced as deep as other alt coins showing strength in the move up. The downside target is the HVN at $140 at the 0.5 Fibonacci Retracement.
Wave 3 should be a powerful move up taking price into all time high.
Failure to hold this support could see price heading back to fresh lows and testing the $90 HVN once more.
Safe trading

ONDO (Daily) Elliot Wave ii UnderwayONDO appears to have completed a leading diagonal for wave 1 after finding a bottom at the major support high volume node (HVN).
Wave 2 has retraced to the expected alt coin Golden Pocket at the 78.6% retracement tapping high volume node.
The descending resistance line has been tested as support leaving a dragonfly doji but does not look strong enough to be the bottom yet.
Wave 3 should be a powerful move up.
This analysis is invalidated below macro wave 2 -$0.65
Safe trading

HBAR (Local) Elliot Wave ii UnderwayHBAR appears to have completed a leading diagonal for wave 1 after finding a bottom at the major support high volume node (HVN).
Wave 2 has retraced the expected 61.8% Fibonacci but alt coins have their own Golden Pocket at the 78.6% retracement which aligns with the S1 pivot and high volume node.
The descending resistance line has been tested as support leaving a doji but does not look strong enough to be the bottom yet.
Wave 3 should be a powerful move up.
This analysis is invalidated below macro wave 4 -$0.12556
Safe trading

EURUSD: Detailed Support & Resistance Analysis For Next Week
Here is my latest structure analysis
and important supports and resistances for EURUSD
for next week.
Consider these structures for pullback/breakout trading.
❤️Please, support my work with like, thank you!❤️
I am part of Trade Nation's Influencer program and receive a monthly fee for using their TradingView charts in my analysis.

BTC Breakdown Confirmed – Time to Buy the Dip or Bail Out? 📉 Bitcoin has officially broken out of its bullish channel.
We are no longer in an uptrend – the structure now signals a **downtrend or sideways consolidation**.
🟢 My Buy Entry Zones:
- First Buy: $104,306
- Second Buy: $98,111
- Third Buy: $93,672
- Last Buy: $89,061
🎯 Target Shorts are marked on the chart – short-term resistance zones.
🚨 Final Stop Loss (Buy Setup): $74,189
I’m dollar-cost averaging into these zones with strong risk management.
Do you think BTC will bounce before $90K?
👇 Drop your thoughts and like if you're buying the dip!

BITCOIN READY TO EXPLODE – OR REJECT? Key Levels You Can’t Ignoby @TradeWithMky – where altcoins speak louder than Bitcoin!
📊 Weekly BTC/USDT Outlook – The chart says it all:
We just tapped ATH resistance and printed a red candle at a critical level.
Is this a bullish retest or a dead-cat bounce before major correction?
🟢 Key Buy Levels:
First Entry: $104,510 ✅
Second Entry: $103,702
Third Entry: $98,385
Fourth Entry: $93,529 & $89,137
🛑 Stop Loss: $78,516
🔍 Support Zone: Still strong.
📈 Fibo Targets:
0.618 → $112,180
1.0 → $135,441
1.618 → $172,928 (next blow-off top?)
💥 Expect major volatility in the coming weeks.
If this setup plays out, we might witness a legendary breakout. Stay sharp!
—
🔁 Like & Repost if you caught this move early!
💬 Drop your thoughts below – bull trap or launchpad?
#Bitcoin #BTCUSDT #CryptoAnalysis #Altseason #TradeWithMky #PricePrediction #CryptoBreakout #TechnicalAnalysis #FibLevels

SPX500 (S&P 500 Index) – Smart Money + Fibonacci Liquidity Sweep📅 Chart Timestamp: May 31, 2025 – 4H Timeframe
📈 Current Price: 5,902.26
📊 Volume (Recent Candle): 64.95K
🧠 Technical Breakdown
🔺 Premium Zone Rejection
Price has sharply rejected the 5,995–6,050 area — a key premium supply zone aligned with the Fibonacci 1.0–1.236 extension.
This rejection occurred after a weak internal high was formed, showing signs of exhaustion and liquidity grab behavior.
📉 Market Structure
Multiple Break of Structure (BOS) and Change of Character (CHoCH) confirm a short-term bearish market structure.
Price has begun forming lower highs and is now in a distribution phase.
📏 Key Fibonacci & Smart Money Levels
0.786 Fib Retracement (5,804) → Recently tested; acted as a short-term support but broken.
Equilibrium Zone (5,443.75) → Critical price magnet. Price is projected to gravitate toward this zone as part of a liquidity sweep and reaccumulation.
Discount Zone (below 5,300) → Stronger support if equilibrium fails. Could serve as a long-term buying opportunity.
🌀 Expected Price Path (Yellow Projection)
Short-term downside continuation into 5,560–5,440.
Likely to form a double-bottom or mitigation structure at equilibrium.
Reversal potential targeting 6,200–6,300 (1.236–1.382 extension) before next macro correction.
📈 Probability Framework
Scenario Description Probability Rationale
📉 Pullback to Equilibrium Price revisits 5,443.75 75% Confluence of Smart Money FVGs + Fib levels + BOS indicates liquidity resting below
🔁 Reaccumulation at EQ Reversal from 5,440–5,500 65% Price often reacts to equilibrium in a bullish uptrend continuation
📈 Rally to 6,200+ Price takes out weak highs and extends 50% Depends on macro sentiment improving + liquidity expansion
🧨 Break below EQ into Discount Price collapses toward 5,300 30% Only if macro deterioration accelerates (Fed surprise, global contagion)
🧠 Macro Risk & Fundamental Context (as of May 31, 2025)
🏦 Federal Reserve
Market is pricing in no rate cut in June, but increased odds (65–70%) of a cut in July.
Sticky inflation + slowing job growth creates an uncertain macro narrative.
💵 Liquidity & Risk Sentiment
Bond market volatility (MOVE Index) remains elevated → signaling stress in interest rate pricing.
VIX is stable near 12–14 range → complacency risk if volatility spikes.
Global liquidity has tightened in EMs due to dollar strength, though US equities remain buoyed by AI & tech.
📉 Earnings + Breadth
Earnings season was mixed; top-heavy performance (few stocks driving index).
Weak market breadth suggests a correction is healthy or overdue.
⚠️ Risk Factors to Monitor
Surprise Fed policy pivot (hawkish).
Geopolitical escalations (Middle East, Taiwan).
Sudden rise in VIX or credit spreads.
Bearish divergence between index and market breadth indicators.

Key Levels for the Month 06/2025 ∷Gold∷🐍 Key Levels Overview for the Month 🐍
__________________________
Trend Base Lines
3112🐂🐂3259
3268🏛🏛3460
3370🐻🐻3703
__________________________
Resistances🔀
3082
3169
3368
3417
3448
3473
3510
3564
3634
3713
3883
4049
Mids∷∷∷
2995
3256
3281
3309
3362
3390
3460
3717
Supports🔀
3552
3386
3330
3250
3206
3122
3105
3086
2908
2821

XAUUSD: Trend in 15 Min timeframevery important levels for GOLD,
Please pay special attention to the colored levels.
>>>>>>>>>>>>>>>>>>> very sensitive <<<<<<<<<<<<<<<<<<<<<<<<
Be careful
BEST
MT

GBPAUD: SWING trend in weekly time framePlease pay special attention to the accurate trend, and very accurate colored levels.
Be careful
BEST
MT

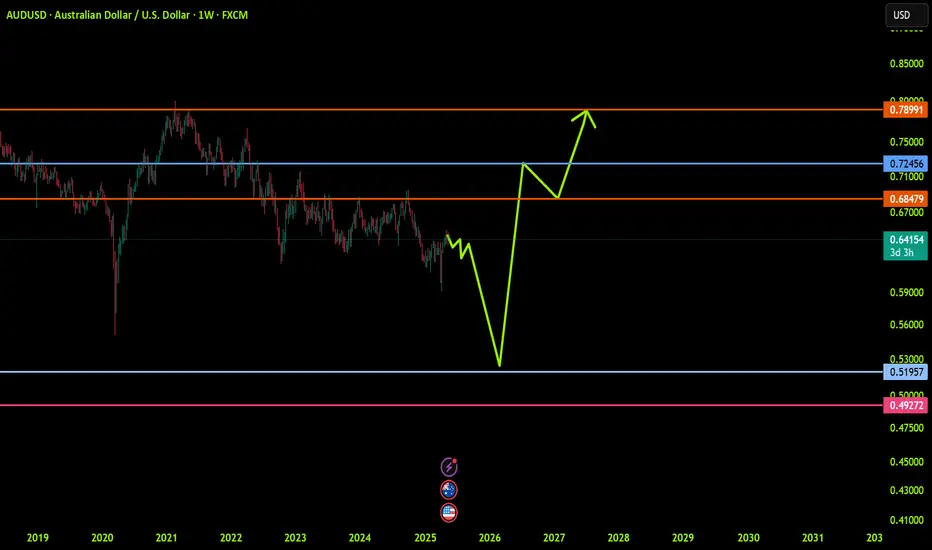
AUDUSD: Trend in weekly time framePlease pay special attention to the accurate trend, and very accurate colored levels.
Be careful
BEST
MT