GBP/AUD For Bullishwait for pull-back near by entry point and then go long
general trend is up trend
have fun :)
Pivot Points

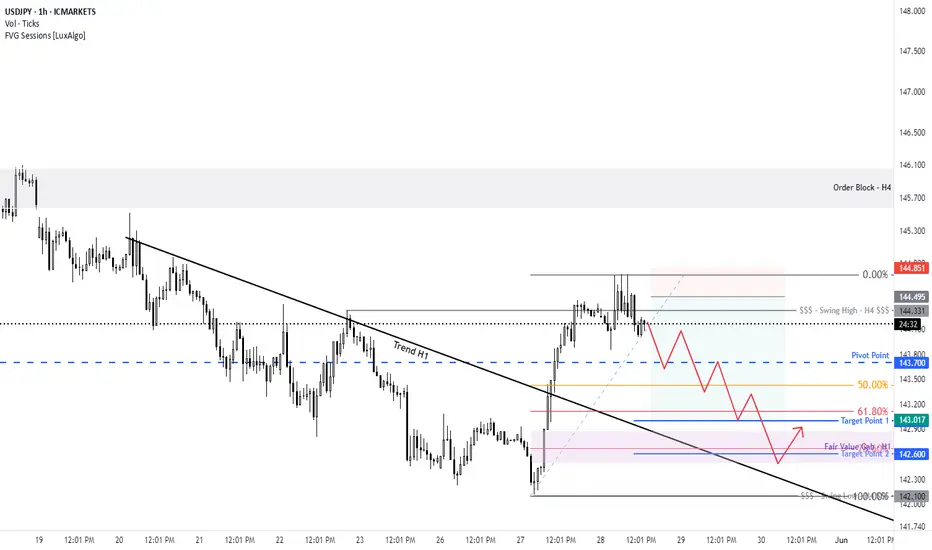
USD/JPY PIVOT AREA INTRADAYThe USD/JPY pair strongly reversed all the previous sessions gains and now is at our pivot area shown with a possible continuation of the bearish pressure .
The break of our pivot could target 142.79 and 141.79 as next possible targets.
However if the price holds above then 145.12 and 146.11 will be what the bulls aim for.

Nifty Analysis EOD – May 29, 2025 – Thursday🟢 Nifty Analysis EOD – May 29, 2025 – Thursday 🔴
Tricky Expiry Day Rollout… Catch or Caught?
🗞 Nifty Summary:
Nifty opened with a gap-up of 88 points at 24,846, making a quick move to 24,889.70—but the bulls couldn’t hold for long. By 10:30, the key support zone at 24,800–24,768 was breached, dragging the index to an intraday low of 24,677.30.
Just when things seemed to be settling into a narrow expiry-day range, a sharp 65-point spike in 3 minutes surprised both sides—creating a mean-reversion V-shape move right back to VWAP and BC levels.
The real twist? A sudden domino-effect breakout at 15:00, marking a fresh high of 24,892.60 and closing at 24,880.85, nearly at the day’s peak.
⏪ Yesterday’s Note Recap:
"Most probable scenario: range-bound day between 24,660 and 24,882... Tricky expiry day."✔️ Spot on. Nifty respected the projected boundaries almost precisely.
🛡 5 Min Chart with Patterns and Levels
📈 Intraday Walk:
09:15 – Gap-up start, optimism in the air.
10:25 – Support at 24,800–24,768 tested and breached.
10:29 – IB Low Break and Day’s low at 24,677.30, bears step in.
12:38 – Surprise spike of 65 points in 3 min
Midday – Consolidation around VWAP and BC levels.
15:00 – Final push leads to breakout above day high → 24,892.60.
Close – Ends at 24,880.85, just below the day high.
🔍 Chart Observations:
✅ Inverse Head & Shoulders pattern formed around 24,768 on the 5-min chart—target achieved.
📦 Box Consolidation Zone repeated from yesterday and respected.
⚠️ Volatility spikes despite being an expiry day—tricky traps for both sides.
🛡 5 Min Chart with Patterns
🕯 Daily Time Frame Chart
🕯 Daily Candle Breakdown:
Open: 24,825.10
High: 24,892.60
Low: 24,677.30
Close: 24,833.60
Change: +81.15 (+0.33%)
Candle Structure:
Real Body: +8.50 pts → Tiny green body
Upper Wick: 59.00 pts
Lower Wick: 147.80 pts
Interpretation:A classic Hammer-like candle, showing strong intraday buying from lower zones. Although bulls couldn’t extend gains, they clearly defended 24,700 levels well.
🔔 Pattern Insight:
Outside Bar pattern on Daily → Often a bullish reversal sign
Bullish confirmation comes above 24,890+
Breakdown below 24,677 would invalidate the bullish signal
🛡 5 Min Intraday Chart
⚔️ Gladiator Strategy Update:
ATR: 291.38
IB Range: 110 → Medium
Market Structure: Balanced
Total Trades: 1
🕐 10:25 AM – 1st trade triggered→ Trailing SL hit at 1:3 risk-reward
🧱 Support & Resistance Levels:
Resistance Zones:
24,882
24,894
24,920
24,972 ~ 25,000
25,062 ~ 25,070 (5th rejection!)
25,116 ~ 25,128
25,180 ~ 25,212
25,285 ~ 25,399
Support Zones:
24,820
24,768 ~ 24,800
24,737 ~ 24,727
24,700
24,660
24,640 ~ 24,625
24,590
24,530 ~ 24,480
24,460
🧭 What’s Next?
Above 24,890 → May trigger short-covering rally toward 25,000, 25,065, and 25,116 levels.
Below 24,677 → Expect downside toward 24,625, 24,590, and possibly 24,530.
With expiry behind, volatility may remain elevated tomorrow as new series begins.
📌 Bias: Mild bullish, but needs confirmation above 24,890.
🧠 Final Thoughts:
“Markets don’t trap you; your bias does.”Stay sharp. Today was a day full of whipsaws—but also full of lessons.
✏️ Disclaimer:This is just my personal viewpoint. Always consult your financial advisor before taking any action.

Naked trading yellow brick roadJust follow the yellow brick road. An idea based on trends, support and a little psychology.

Nifty Analysis & Trade Plan for Friday, 30th MayHere in this video we have discussed and analyze Nifty current trend, and made a trade plan for Friday, 30th May

AUD/CAD For Bullish as pull-backyou can go long now
or
wait for pull-back near by entry point and then go long
general trend is up down
current phase is pull-back
your confirmation will be break current resistance and then come back for retest and go to targets
have fun :)

XAUUSD - Will Gold Continue to Fall?!Gold is trading in its ascending channel on the 1-hour timeframe, between the EMA200 and EMA50. I expect the direction ahead for gold to be bullish and if it breaks the downtrend line, we can look for buying opportunities.
The U.S. dollar rose following a decision by the United States Court of International Trade to revoke tariffs imposed by Donald Trump. Since the Trump administration, there have been continual developments regarding tariffs, and this latest ruling, which blocks Trump’s retaliatory tariffs, has stirred uncertainty and confusion over its legal validity. The ruling also triggered a correction in gold’s upward trend.
According to the U.S. Constitution, the power to impose tariffs officially resides with Congress. However, since 1962, much of this authority has been delegated to the executive branch. Courts have historically upheld this delegation to the president, but this recent judgment casts doubt on the legitimacy of such executive powers.
The pressing question now is whether Trump can circumvent the ruling. Could he potentially ignore it or take counteraction? Any move by Trump in response would undoubtedly ripple through the financial markets.
Goldman Sachs has characterized the court’s decision as a new obstacle for Trump’s trade strategy, though it notes the ruling only applies to part of the tariffs.Analysts at the firm believe Trump may find legal or procedural means to work around the court’s decision, possibly introducing new strategies to maintain his tariff agenda.
Citing customs data, ING commodity analysts Warren Patterson and Ewa Manthey reported that despite record-high prices, China’s gold imports reached their highest level in eleven months last month. Since the beginning of the year, gold prices have surged by more than 20%.
Total gold imports climbed to 127.5 metric tons, marking a 73% increase from the previous month. This sharp rise followed the People’s Bank of China’s issuance of new import quotas to select commercial banks in April. With a year-to-date gain exceeding 20%, gold hit an all-time high of $3,500 per ounce in April. Key drivers of this rally include geopolitical risk and sustained purchases by central banks.
In the broader metals sector, China’s refined copper production in April reached a new monthly record, rising 9% year-on-year to 1.25 million metric tons, even as processing fees remained low. Meanwhile, lead production declined by 1% from the previous year to 664,000 tons, while zinc output edged up by 0.3% to 576,000 tons.
According to the International Aluminium Institute, global aluminum production in April remained flat compared to the prior month, averaging 201,100 metric tons per day. However, on a year-over-year basis, output increased by 2.24%.

USD/JPY Long-Term Bullish Swing Idea
Sentiment-based swing
Price has reached a key support zone, previously acting as a major turning point. The market has shown clear signs of bullish rejection at this level, suggesting a potential trend reversal. This setup provides a strong basis for a long trade.

US500 - Will the stock market reach ATH?!The index is above the EMA200 and EMA50 on the four-hour timeframe and is trading in its ascending channel. I expect the index to continue moving, and on the other hand, if the index declines towards a certain zone, you can also look for the next S&P long positions with a risk-reward ratio.
Yesterday, a U.S. federal court halted the implementation of President Trump’s “Freedom Day” tariffs. The U.S. Court of International Trade ruled that these tariffs exceeded the legal authority granted to the president and unanimously decided to revoke them. Nonetheless, Trump still retains the right to appeal the ruling.
Following the court’s decision, President Trump promptly filed an appeal. In response, the White House issued a statement asserting, “The decision on how to handle a national emergency should not fall into the hands of unelected judges.”
Meanwhile, the market reacted strongly to Nvidia’s latest financial report. The company’s stock surged by as much as 5.8% in after-hours trading, before settling at a 4.8% gain compared to the previous day.
This bullish movement reflects investors’ confidence in Nvidia’s continued strong performance.
Nvidia is actively expanding into new markets, including the Middle East—an indication that the company is poised for sustained growth even if its presence in China is constrained.
The rally in Nvidia’s stock didn’t just lift semiconductor companies; broader markets followed suit. The S&P 500 index climbed to 6,005.75 points, representing a 1.7% increase from the prior session.
According to the company’s announcement, Nvidia posted $44.1 billion in revenue for the first quarter of fiscal year 2026, marking a 69% increase year-over-year and slightly surpassing analysts’ expectations. Revenue from data center operations rose 73% to reach $39.1 billion.
CEO Jensen Huang stated: “Our Blackwell NVL72 AI supercomputer—designed for reasoning and acting as a ‘thinking machine’—is now being mass-produced by system builders and cloud service providers.” He added, “There is enormous global demand for Nvidia’s AI infrastructure. Over the past year alone, AI inference token generation has grown tenfold. As AI agents become mainstream, the demand for AI compute will continue to surge.”
A Reuters poll now projects that the S&P 500 will reach 5,900 by the end of 2025—down from the 6,500 level forecast in February. Similarly, the Dow Jones index is expected to close 2025 at 43,708, compared to the previous projection of 47,024 from the February survey.
Separately, the Federal Deposit Insurance Corporation (FDIC) reported that the increase in U.S. bank profits was largely driven by growth in noninterest income. Bank earnings in the first quarter of 2025 rose by 5.8%, reaching $70.6 billion. While overall asset quality remains favorable, the commercial real estate loan portfolios continue to show signs of weakness. The number of “problem banks” declined by three, bringing the total down to 63. The banking industry also reported a slowdown in lending growth; the annual loan growth rate for the first quarter was just 3%, down from the pre-pandemic average of 4.9%.

ETH NEW UPDATE (12H)This analysis is an update of the analysis you see in the "Related publications" section
This analysis is still valid.
Ethereum has a liquidity pool above the chart, and just behind that pool, there is a fresh order block.
After sweeping the liquidity pool and hitting this order block, the price is expected to drop toward the flip zone.
For risk management, please don't forget stop loss and capital management
When we reach the first target, save some profit and then change the stop to entry
Comment if you have any questions
Thank You

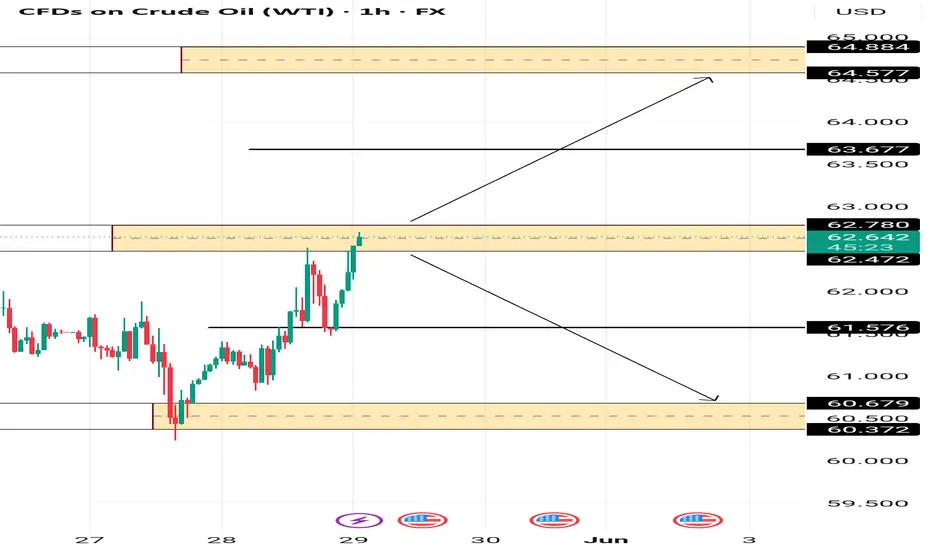
US CRUDE OIL PIVOT AREAUS OIL has formed a good base of support after the decent decline in the previous weeks.
The break of our intraday pivot area could keep the Bullish bias with targets of 63.67 and 64.57 in the near sight.
However failure to break above could bring prices down to 61.57 and 60.67
DOG Main Trend. Reversal Zones 05/29/2025Logarithm. Time frame 3 days. The chart shows key reversal zones in the horizontal channel, and when exiting it. For clarity, percentages are shown from the skin reversal zone. This is convenient for understanding the risk and potential profit in long and short work. You can also work in spot from long, from key zones (more relevant, as margin trading on assets of such liquidity, is extremely destructive, due to price slippage under the market, but already on such assets by a huge percentage, for your liquidation (accumulation of liquidity-benefit of gambling addicts in general).
Now the price has hit the resistance of the internal channel, that is, the zone of the “main liquid” price movement. From the reversal, local profit is significant, therefore, when working, observe risk management and wait for a breakthrough of this resistance level (you can place a trigger order), or wait for a rollback (if there is one), for example, to the median of the channel.
The horizontal channel itself is reformatted into a potential “microphone” (what was half a year ago on bitcoin, with resistance to the 72 thousand zone, and liquidity collection 53-58).

NZDCAD Selling Trading IdeaHello Traders
In This Chart nzdcad HOURLY Forex Forecast By FOREX PLANET
today NZDCAD analysis 👆
🟢This Chart includes_ (NZDCAD market update)
🟢What is The Next Opportunity on NZDCAD Market
🟢how to Enter to the Valid Entry With Assurance Profit
This CHART is For Trader's that Want to Improve Their Technical Analysis Skills and Their Trading By Understanding How To Analyze The Market Using Multiple Timeframes and Understanding The Bigger Picture on the Charts

GBPAUD buy Trade IdeaHello Traders
In This Chart GBP/AUD 4 HOURLY Forex Forecast By FOREX PLANET
today GBP/AUD analysis 👆
🟢This Chart includes_ (GBP/AUD market update)
🟢What is The Next Opportunity on GBP/AUD Market
🟢how to Enter to the Valid Entry With Assurance Profit
This CHART is For Trader's that Want to Improve Their Technical Analysis Skills and Their Trading By Understanding How To Analyze The Market Using Multiple Timeframes and Understanding The Bigger Picture on the Charts

Will EURCAD rise from a strong Support LevelHello Traders
In This Chart EURCAD HOURLY Forex Forecast By FOREX PLANET
today Gold analysis 👆
🟢This Chart includes_ (EURCAD market update)
🟢What is The Next Opportunity on EURCAD Market
🟢how to Enter to the Valid Entry With Assurance Profit
This CHART is For Trader's that Want to Improve Their Technical Analysis Skills and Their Trading By Understanding How To Analyze The Market Using Multiple Timeframes and Understanding The Bigger Picture on the Charts

MercadoLibre Inc Stock Quote | Chart & Forecast SummaryKey Indicators On Trade Set Up In General
1. Push Set Up
2. Range Set up
3. Break & Retest Set Up
Notes On Session
# MercadoLibre Inc Stock Quote
- Double Formation
* (Upper Band)) #1 - *4% Settings Condition | Completed Survey
* Entry & Retest At 0.5 Retracement Area | Subdivision 1
- Triple Formation
* (EMA Settings))
* 100 EMA - *Support & Resistance | Subdivision 2
* (TP1) | Subdivision 3
* Daily Time Frame | Trend Settings Condition
- (Hypothesis On Entry Bias)) | Indexed To 100
- Position On A 1.5RR
* Stop Loss At 156.00 USD
* Entry At 165.00 USD
* Take Profit At 180.00 USD
* (Ranging Argument)) & No Pattern Confirmation
* Ongoing Entry & (Neutral Area))
Active Sessions On Relevant Range & Elemented Probabilities;
European-Session(Upwards) - East Coast-Session(Downwards) - Asian-Session(Ranging)
Conclusion | Trade Plan Execution & Risk Management On Demand;
Overall Consensus | Buy

Nifty Analysis EOD – May 28, 2025 – Wednesday🟢 Nifty Analysis EOD – May 28, 2025 – Wednesday 🔴
Consolidation at the bottom—ready to blast? Or more of the same tomorrow?
📊 Nifty Summary:
Nifty opened mildly higher at 24,832.50, only to spend the entire session grinding within a narrow 127-point range. Most of the action stayed trapped in a 60-point box, giving day traders a frustratingly sideways experience. Attempts to break the range failed, and the index closed at the day's lower edge, continuing the consolidation near key support zones.
🔍 Intraday Walk:
Nifty opened with a small positive bias but failed to find follow-through.
For the major part of the day, price action remained boxed in a tight range—ideal only for scalpers and option writers.
An attempted breakout was seen, but the index quickly fell back into the consolidation zone.
Triangle breakout on 5-min chart came late (3:00 PM), with no time for validation.
Closed near day’s low at 24,752.45, just above crucial support.
🛡 5 Min Chart with Patterns
🛡 5 Min Chart with Patterns and Levels
🔎 Chart Observations:
🔸 Mini M-Pattern formed twice on 5-min chart at key level—adds to bearish caution.
🔸 Box consolidation zone repeated from yesterday’s range.
🔸 Symmetrical Triangle seen on 5-min chart broke on the downside at 15:00—too late to act but worth noting.
🔸 Yesterday’s low stayed protected, though price closed weak.
🔸 Volatility dried up ahead of monthly expiry—expect positioning tomorrow.
🕯 Daily Time Frame Chart
📉 Daily Candle Breakdown:
Open: 24,832.50
High: 24,864.25
Low: 24,737.05
Close: 24,752.45
Change: −73.75 (−0.30%)
Candle Structure:
Real Body: 80.05 pts (Red candle)
Upper Wick: 31.75 pts
Lower Wick: 15.40 pts
Interpretation:
Small-bodied candle with short wicks on both ends—a Bearish Spinning Top, hinting at indecision but with a slight bearish bias.
Inside Bar formation – breakout watch on either side.
🧠 Key Insight:
The market is digesting the recent downside with sideways consolidation. If bulls fail to protect 24,700, deeper cuts could follow. On the flip side, a break above 24,882 could trigger short-covering ahead of expiry.
🛡 5 Min Intraday Chart
⚔️ Gladiator Strategy Update:
ATR: 299.84
IB Range: 121.2 → Medium
Market Structure: Balanced
Total Trades: 0
❌ No valid triggers today – system stayed out due to tight range and lack of momentum.
📌 Support & Resistance Levels:
🔺 Resistance Zones:
24,768 ~ 24,820
24,882
24,894
24,920
24,972 ~ 25,000
25,062 ~ 25,070 (Rejected for 5th time!)
25,116 ~ 25,128
25,180 ~ 25,212
25,285 ~ 25,399
🔻 Support Zones:
24,737 ~ 24,727
24,700
24,660
24,640 ~ 24,625
24,590
24,530 ~ 24,480
24,460
🔮 What’s Next?
Scenario 1 – Breakdown:If 24,700 breaks and sustains, Nifty may head towards 24,589 → 24,500 → 24,461.
Scenario 2 – Breakout:If 24,882 breaks and sustains, Nifty can test 24,920 → 24,972 → 25,000 → 25,065 → 25,116 → 25,180.
📍 Most probable scenario:Expecting a range-bound day between 24,660 and 24,882, typical of Monthly expiry sessions. However, if short covering triggers, the day could flip into a trend day.
⛔ Caution: Tomorrow is a tricky expiry day—stay nimble, follow strategy, and respect levels!
🧘 Final Thoughts:
"The calm before the storm often wears the mask of boredom. When the market sleeps, prepare for the wake-up call."
✏️ Disclaimer:This is just my personal viewpoint. Always consult your financial advisor before taking any action.


CAD/JPY For Bearish as pull-backyou can go short now
general trend is up trend
current phase is pull-back
have fun :)

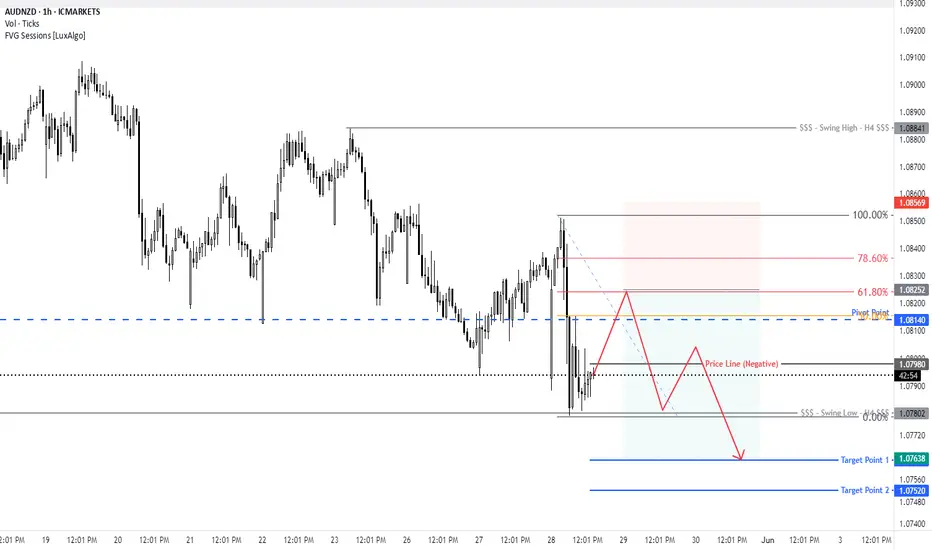
AUD/NZD For Bearishwait for pull-back near by entry point and then go short
general trend is down trend
have fun :)
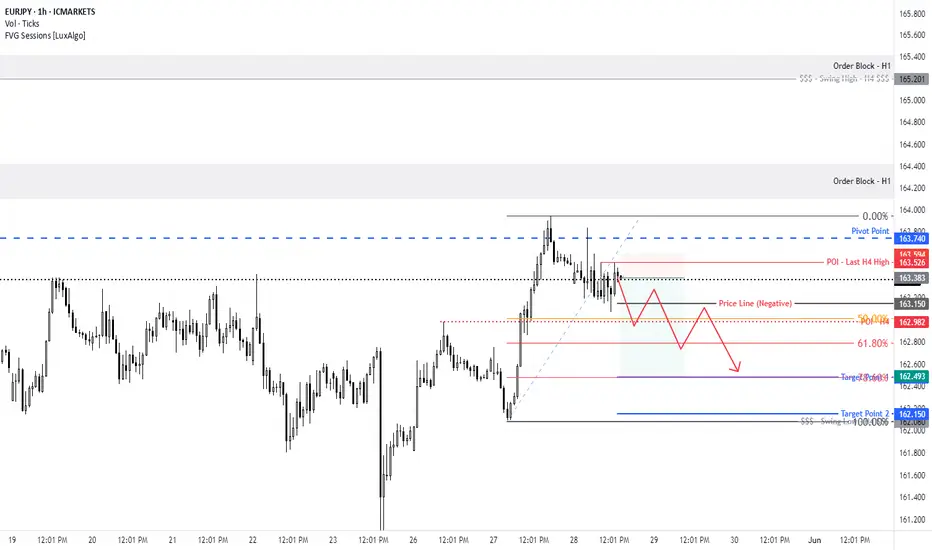
EUR/JPY For Bearish as pull-backyou can go short now
general trend is up trend
current phase is pull-back
have fun :)