GBP/CAD For Bullishwait for break the current resistance and go bullish with retest that area
general trend is up trend
have fun :)
Pivot Points

NZD/USD For Bullishyou can go long now
or
wait for pull-back near by entry point and then go long
general trend is up trend
have fun :)

Woolworths Group Ltd Stock Quote | Chart & Forecast SummaryKey Indicators On Trade Set Up In General
1. Push Set Up
2. Range Set up
3. Break & Retest Set Up
Notes On Session
# Woolworths Group Ltd Stock Quote
- Double Formation
* (A+ Set Up)) - *14% Settings Condition | Completed Survey
* Wave Feature - *ABC Entry & Retest | Subdivision 1
- Triple Formation
* (Anchored VWAP)) - *Upper Band #1 | Subdivision 2
* (TP1) | Subdivision 3
* Daily Time Frame | Trend Settings Condition
- (Hypothesis On Entry Bias)) | Indexed To 100
- Position On A 1.5RR
* Stop Loss At 102.00 AUD
* Entry At 99.00 AUD
* Take Profit At 94.00 AUD
* (Ranging Argument)) & No Pattern Confirmation
* Ongoing Entry & (Neutral Area))
Active Sessions On Relevant Range & Elemented Probabilities;
European-Session(Upwards) - East Coast-Session(Downwards) - Asian-Session(Ranging)
Conclusion | Trade Plan Execution & Risk Management On Demand;
Overall Consensus | Neutral

BTC/USDT Technical Analysis, 2025-05-27 20:15 UTCBTC/USDT Technical Analysis, 2025-05-27 20:15 UTC
24h Change: +0.40% | Key Trend: Neutral to Weak Downtrend
MACD: Bearish crossover but histogram shows minor bullish divergence (recent upticks).
Trend Strength Index: Fluctuating between weak downtrend and recovery attempts.
Momentum:
RSI: 38.9 (approaching oversold, but no strong reversal signal).
Volume: Declining vs. 20-period avg (~0.2x), suggesting low conviction in moves.
Volatility:
ATR: 134.36 moderate volatility; range-bound action likely.
Price Action:
Candlestick Patterns: Recent Inside Bar and Bearish Engulfing, indicating indecision.
Support/Resistance:
Support: $109,500–109,600 (Bollinger Lower Band).
Resistance: $110,200–110,400 (previous highs, 20-period SMA).
Order Book:
Thin liquidity near current price (bid/ask spread: 0.01 USDT).
Large sell orders stacked at $109,881.76+, suggesting overhead supply.
Short-term (1–4h): Neutral/Slightly Bearish
Price may retest $109,500 support. A break below could target $109,000.
Reversal potential if RSI dips below 30 (oversold) and volume picks up.
Scalpers: Watch for rejection at $110,000 or bounce off $109,500.
Swing Traders: Wait for confirmation (close above $110,200 or below $109,300).
Risk Note: Low volume + Doji/Inside Bars = False breakout risk.

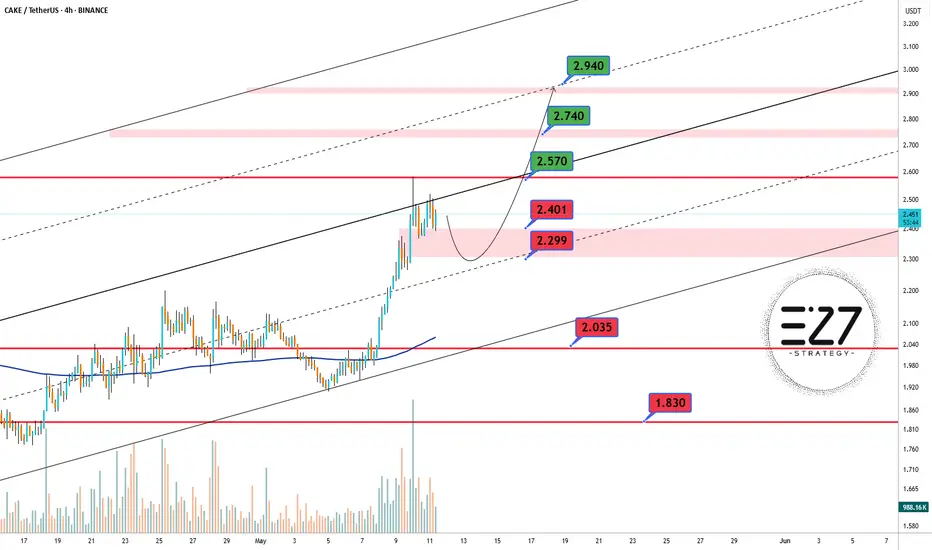
CAKEUSDT Pump📊 On the 4H BINANCE:CAKEUSDT chart, price has broken above the mid-term channel resistance and is currently pulling back. If the support zone holds, there’s potential for continuation toward higher resistance levels. A bullish reaction from the 2.299 USDT area could validate the next leg up.
🔄 If the correction deepens, the highlighted pink zone offers a strong re-entry opportunity. Key targets on the upside include 2.570, 2.740, and potentially 2.940 USDT if momentum continues.
✅ Key Support Levels:
🟥 2.401 USDT
🟥 2.299 USDT
🟥 2.035 USDT
🟥 1.830 USDT
🚫 Key Resistance Levels:
🟩 2.570 USDT
🟩 2.740 USDT
🟩 2.940 USDT
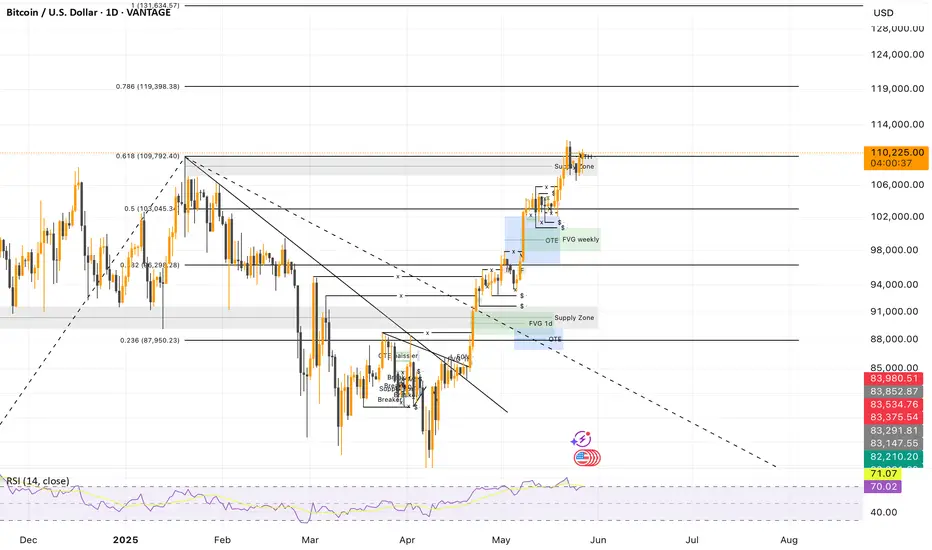
BTC/USD – 1D Analysis
1️⃣ Market Structure
BTC remains ultra bullish. A new high was hit last week at 112K.
Since then, price is consolidating slightly around 110K with no major weakness showing.
2️⃣ Key Levels
📍 Main support: 108K (previous ATH)
🎯 Current resistance: 112K
🧭 Fibo extensions: targets projected at 130K–135K
3️⃣ Context & Momentum
🏦 Institutional interest remains strong
💵 Weakening USD = bullish for BTC
⚖️ Overall sentiment still favors upside despite market caution
4️⃣ Scenarios to watch
📈 Bullish: Break above 112K could trigger a run to 130K+
📉 Bearish: Break below 108K may open room for a retest of 103–100K
✅ Conclusion
BTC is gearing up for the next leg. As long as 108K holds, the bias stays bullish.
📆 This week could be the one that triggers the breakout.
GBP/CHF For Bullishwait for pull-back near by entry point and then go long
general trend is up trend
have fun :)

EUR/CHF For Bullish as pull-backwait for pull-back near by entry point and then go long as pull-back
general trend is down trend
current phase is pull-back
have fun :)

Nifty Analysis EOD – May 27, 2025 – Tuesday🟢 Nifty Analysis EOD – May 27, 2025 – Tuesday 🔴
Another day, another 25K fight. Bulls tried hard, but bears had the final say — what about tomorrow?
📊 Nifty Summary:
The market opened with a slight gap-down of 38 points at 24,958. Within just 10 minutes, Nifty slid 207 points below the previous day’s low, diving into the 24,768–24,800 zone. It briefly halted around 24,737 — marking the first low of the day — and then suddenly reversed sentiment with a rapid 295-point rally within 45 minutes, breaking CPR, PDH, and even touching the previous week’s high. However, this strength didn’t last long. Gradually, Nifty fell back toward VWAP, broke below the current day low, and formed a new low at 24,704. It eventually closed at 24,826 — above the 24,768–24,800 support zone but below the PDL.
The rally between 24,768 and 25,062 was surprising in both speed and size. It didn't feel like short-covering or fresh buying, but it certainly caught many traders off-guard and likely led to position adjustments.
🛡 5 Min Chart with levels
📉 Intraday Walk:
🔻 Sharp fall within first 10 mins: 24,958 → 24,737
🔼 Sudden spike: 24,737 → 25,062 (rally of 295 points in 45 mins)
🔻 Gradual drop back to VWAP and beyond
🧭 Final dip: new low of 24,704 before recovery
✅ Closed at 24,826 — still above a key support zone
🧠 Key Observations:
Today's low (24,704) aligns near the 0.618 Fibonacci retracement from swing low to PDH — suggesting a potential end to the 3-day retracement phase if it holds.
Fair Value Gap (FVG) from May 22–26 is now filled, suggesting fresh buying interest may re-emerge.
But... closing below PDL (24,900) is a concern and hints at continued pressure.
It’s the fifth day of rejection from the 25,062–25,070 supply zone — a major wall to breach.
🕯 Daily Time Frame Chart
📉 Daily Candle Breakdown:
Open: 24,956.65
High: 25,062.90
Low: 24,704.10
Close: 24,826.20
Change: −174.95 (−0.70%)
🔍 Candle Structure
Real Body: Red (130.45 points) — signifies selling pressure
Upper Wick: 106.25 points — resistance near high
Lower Wick: 122.10 points — buyers tried to fight back➡️ Resembles an Inverted High-Wave Candle: signals indecision with bearish bias
Price volatility was intense. Bulls showed strength mid-day, but bears had better endurance. This candle may lead to further weakness unless buyers reclaim 25,063 quickly.
🛡 5 Min Intraday Chart
🥷 Gladiator Strategy Update
ATR: 314.6
IB Range: 178.7 (Medium)
Market Structure: Imbalanced
🎯 Trade Highlights:
🟥 9:20 Short Trigger → No trade (unfavourable R:R, System not Allow)
🟩 11:30 Long Trigger → SL Hit
🟥 14:20 Short Trigger → SL Hit
📉 Total Trades: 2 (Both hit SL)
Tough day for the system — range extremes and sudden reversals ruled the game.
📌 Support & Resistance Levels
📈 Resistance Zones:
• 24,882 ~ 24,895
• 24,920
• 24,980 ~ 25,000
• 25,062 ~ 25,070 (5th rejection!)
• 25,116 ~ 25,128
• 25,180 ~ 25,212
• 25,285 ~ 25,399
📉 Support Zones:
• 24,768 ~ 24,820
• 24,660
• 24,640 ~ 24,625
• 24,590
• 24,530 ~ 24,480
• 24,460
📌 What’s Next?
If 24,704 holds, bulls may attempt a bounce again.
A close above 25,063 would restore bullish sentiment.
But if 24,700 breaks, we may see deeper correction into lower support zones.
💬 Final Thoughts:
"Market will teach you humility every time you think you've figured it out."Today’s sudden rally followed by a deeper fall reminds us how quickly sentiment can shift. Trade with levels, respect zones, and keep adapting — that’s the only constant.
✏️ Disclaimer:
This is just my personal viewpoint. Always consult your financial advisor before taking any action.

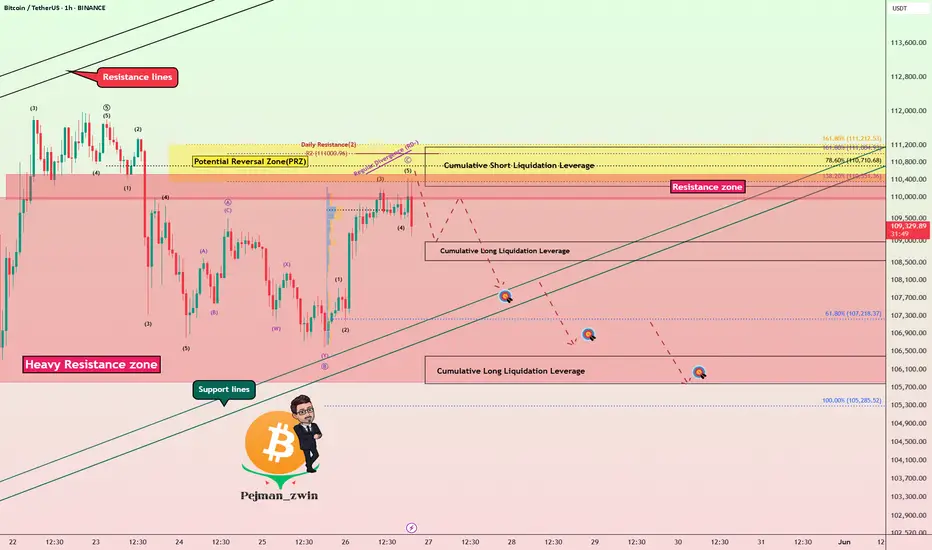
Bitcoin Bounce on Trump Tariff Delay – Short Setup Still Valid!Bitcoin ( BINANCE:BTCUSDT ) started to fall as I expected in the previous idea , and declined near the Support lines .
Bitcoin started pumping after the news that " US President Trump agreed to postpone 50% EU tariffs until July 9th ." Do you think this pumping of Bitcoin will continue?
Bitcoin is trading in a Heavy Resistance zone($110,000-$105,800) near the Potential Reversal Zone(PRZ) .
From the Elliott Wave theory perspective , Bitcoin appears to be in corrective waves , which is why I am labeling this idea as a ''Short''. The corrective waves structure is of the Expanding Flat(ABC/3-3-5) type.
I expect Bitcoin to attack the Support lines once again, and if these lines are broken, it will decline to the Targets I have indicated on the chart.
Notes :
MicroStrategy bought another 4,020 Bitcoins, but it didn't have much of an impact on the market.
If the Bitcoin price falls back below $109,000, about $185 million in long Bitcoin positions will be liquidated . = Attractive for exchanges
Bitcoin 2025 Conference to be Held in Las Vegas, Tuesday-Thursday = Could Cause Market Excitement .
Note: If Bitcoin touches $112,080, we should expect more pumping.
Please respect each other's ideas and express them politely if you agree or disagree.
Bitcoin Analyze (BTCUSDT), 1-hour time frame.
Be sure to follow the updated ideas.
Do not forget to put a Stop loss for your positions (For every position you want to open).
Please follow your strategy and updates; this is just my Idea, and I will gladly see your ideas in this post.
Please do not forget the ✅' like '✅ button 🙏😊 & Share it with your friends; thanks, and Trade safe.
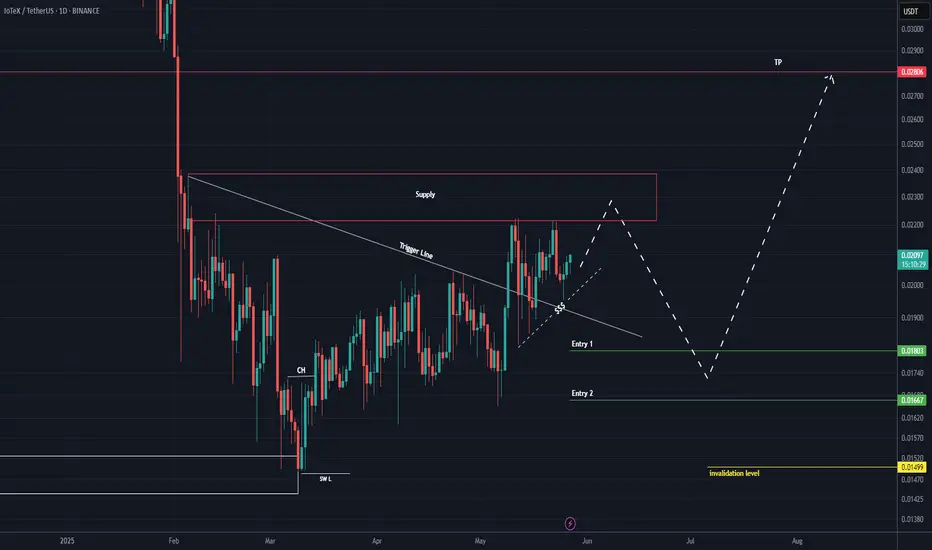
IOTX buy/long setup (1D)An important trigger line has been broken, and the price has been moving sideways for a while.
There is also a bullish CH on the chart.
It is expected that the price will make a pullback to the support zone and then move toward the supply zones higher on the chart. We are looking for buy positions at the entry points.
A daily candle closing below the invalidation level will invalidate this analysis.
For risk management, please don't forget stop loss and capital management
When we reach the first target, save some profit and then change the stop to entry
Comment if you have any questions
Thank You
XRPUSDT 4H | Untested Demand Zone RevisitIn this 4-hour chart analysis of XRPUSDT, I’m focusing on a clear and well-defined untested demand zone between 2.05–2.13 USDT . Unlike the first demand zone (already tested and played out), this second zone has not been retested since its formation, making it a fresh area of interest for a potential long setup.
Why this matters :
Untested demand zones often act as powerful magnets for price when revisited, as they represent areas where large buy orders might be waiting to be filled. Because this zone has not been revisited yet, there’s a higher probability for a bullish reaction when price returns to it.
Key Technical Factors :
✅ The 2.05–2.13 demand zone was formed following a significant bullish impulse that created a clear break of structure to the upside.
✅ Price is currently consolidating above this demand zone and also above a potential bearish CHoCH at 2.0784 . This suggests that the bullish structure is still valid unless price breaks below 2.0784.
✅ My bullish target is 2.65 USDT , where previous highs were formed and potential liquidity exists.
✅ My stop loss is set just below the demand zone, around 2.05 , to protect against a deeper retracement or a shift in market structure.
My Thought Process :
I expect that if price returns to the demand zone, there will be a strong chance for buyers to step in and push the market higher. However, I’m aware that if price breaks below 2.0784 , it would signal a bearish CHoCH and invalidate the long scenario. Therefore, patience is key — I’ll wait for price to either test the zone and react strongly or stay above 2.0784 to keep the bullish bias intact.
Clear Trade Setup :
📌 Entry Zone : 2.05–2.13
🛑 Stop Loss : Below 2.05
🎯 Take Profit : 2.65
🧩 Invalidation : Break below 2.0784
💬 Let me know if you have a similar zone marked out or if you see a different setup! Let’s share ideas and refine our strategies together.

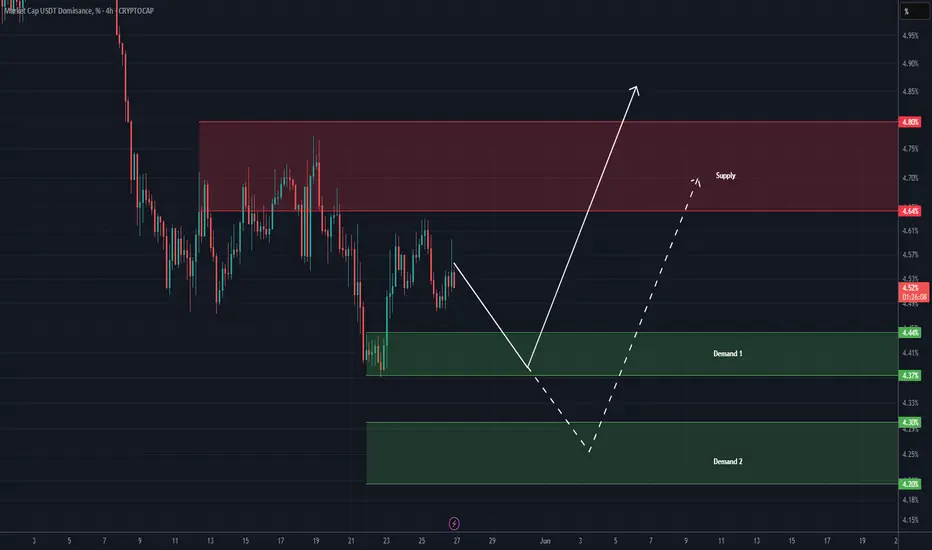
USDT DOMINANCE Update (4H) First of all you should know that "USDT Dominance" is always moving inverse of BTCUSDT .
This index is ready to retrace and bounce upward from either Demand 1 or Demand 2. Be cautious with this index and monitor it closely.
If the price gets rejected toward Demand 2, altcoins may experience some growth before undergoing another correction.
Let’s wait and see what happens.
For risk management, please don't forget stop loss and capital management
Comment if you have any questions
Thank You
NVDA - 140 Quasimodo?Well NVDA has exceeded the 120 PoC from the last year, and other than the head and shoulders developing it looks rather bullish above that 120. But I would sell 140, or at least not buy.
And if I'm buying I'd probably wait for 112. Think I will wait forever? 😂
Will update after we get some more data.

ETH weekly consolidationETH currently trading in a weekly balance range. Looking like some bullish consolidation for a major move up back to 4k. Idea may take some more time to play out, but the longer it takes, the better the move. ETH to $4000

BTC/USDT – Magical Mid-Channel Momentum Incoming!by @TradeWithMky 🐸💫
After an explosive breakout, Bitcoin is now gracefully gliding within the enchanted parallel channel of opportunity. As the price pulls back towards the 50% midline, we prepare to summon the next leg up with full momentum! 💥
The secret spell?
☄️ Wait for the price to tap the 50% line
🪄 Channel confluence + bullish structure intact
🚀 Triple-arrow formation signals high probability continuation
Let the candles dance within the rhythm of the trend – where structure meets strategy and magic meets market.
This isn’t just a chart. It’s a whisper from the market gods telling us: “Stay ready, the move is coming.”
🧙♂️ Remember:
TradeWithMky – where altcoins speak louder than Bitcoin!
#TradeWithMky #BTCUSDT #CryptoMagic #ChannelBreakout #AltcoinSeason #Bitcoin #PriceAction #TechnicalAnalysis #TrendRiding

Gold Trading Strategy for the 27thOn the 4-hour chart today, the bullish trend of gold remains intact ⭐️✨📈 ⚠️📉
The current price is facing resistance at 3365 near the previous high. Due to the excessive release of early bullish momentum, a period of adjustment is usually required 📉
However, with further news-driven stimuli this week, gold may still surge sharply 🚀
The key lies in the morning session's trend, so timing is crucial when judging the strength of bulls and bears ⏰
It is expected that gold will continue the pattern of oscillating upward movement, and pullback opportunities can be captured 📈
Resistance is at 3365, and support is at the 3320 level 🔍
Long Position Strategy:
If the gold price retracts to the 3320-3325 range, consider opening a long position 📊 Set the stop-loss at 3317, with targets at 3340-3350 🎯
If the price holds above 3320, try opening a long position 🌟 The initial target is 3345, and if 3345 is successfully broken through, further targets will be 3350-3360 ⚡️
Short Position Strategy:
When the price rises to the 3360-3365 range, try opening a short position ⚠️ Set the stop-loss at 3370, with targets at 3340-3330 📉
Gold Trading Strategies
sell@3360-3365
tp:3330-3340
buy@3320-3325
tp:3350-3360
Professional trading strategies are pushed daily 📊
Lock in precise signals amid market fluctuations 🚀
Confused about market trends? Stuck in strategy bottlenecks?
Real-time strategies serve as your "trading compass" 🌐
From trend analysis to entry/exit points, dissect market logic comprehensively
Refer now 📲
Help you move steadily forward in investments ✨
👇👇👇

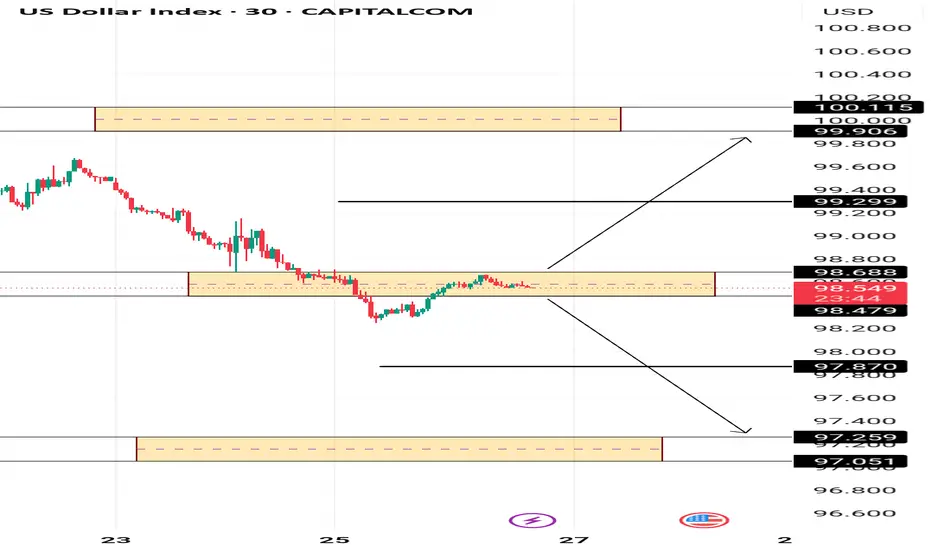
USD INDEX PIVOT AREAThe USD INDEX is currently prefering the bears as long as the pivot area holds .However abreak above could bring some strength to the index with 99.29 and 99.90 as targets.
Nifty Analysis EOD – May 26, 2025 – Monday 🟢 Nifty Analysis EOD – May 26, 2025 – Monday 🔴
Tug of War for 25K between the Bulls and Bears
📈 Nifty Summary:
The week kicked off with a 66-point gap-up, opening at 24,919, and bulls wasted no time pushing toward the much-awaited 25,000 mark, hitting an intraday high of 25,079.20. But the celebration didn’t last long—the move lacked conviction, and what followed was a sharp fall back to the day's low at 24,900.50.
From there, Nifty bounced off 24,910, climbed back to the VWAP zone, and then spent the rest of the session range-bound between 24,950 ~ 25,000, reflecting indecision and consolidation. The index closed the day just above the psychological milestone at 25,001.15, wrapping up a volatile yet directionless session.
🛡 5 Min Chart with levels
🔍 Technical Snapshot:Nifty broke above a trendline but faced resistance near 25,062 ~ 25,070—an important supply zone—and eventually slid back into the previous resistance band of 24,972 ~ 25,000, now acting as a struggle zone.
🕯 Daily Time Frame Chart
🕯 Daily Candle Breakdown
Open: 24,919.35
High: 25,079.20
Low: 24,900.50
Close: 25,001.15
Change: +81.80 (+0.33%)
Candle Structure:
✅ Real Body (Green): 81.80 pts → Mild bullish close
🔼 Upper Wick: 78.05 pts → Buying faded near highs
🔽 Lower Wick: 18.85 pts → Support around 24,900
This candle shows moderate bullish momentum, but the long upper wick tells us the bulls faced strong selling near the top. The structure suggests a "weary bull" candle—a sign of hesitation, not a reversal. Price is trying to move higher, but profit-booking near resistance is slowing the pace.
📌 Key Insight:
The trend remains upward, but momentum is weakening near key resistance.
Above 25,080 = Breakout confirmation
Below 24,900 = Possible consolidation or pause
🛡 5 Min Intraday Chart
🥷 Gladiator Strategy Update
Strategy Parameters
ATR: 314.6
IB Range: 178.7 → Medium IB
Market Structure: Imbalanced
Trade Highlights⚠️
No trades were triggered by the system today
💼 Total Trades: 0
📊 Support & Resistance Levels
🔺 Resistance Zones:•
25,062 ~ 25,070
25,116 ~ 25,128
25,180 ~ 25,212
25,285
25,399
🔻 Support Zones:
24,980 ~ 25,000
24,920
24,882 ~ 24,895
24,768 ~ 24,820
24,660
24,640 ~ 24,625
24,590
24,530 ~ 24,480
24,460
🧠 Final Thoughts:
"Markets don't lie, they whisper truth—if you're quiet enough to listen."The market is clearly respecting resistance zones, and until bulls can decisively close above 25,080, expect more choppy action near highs. Stay patient. Let structure lead your decisions.
✏️ Disclaimer ✏️
This is just my personal viewpoint. Always consult your financial advisor before taking any action.

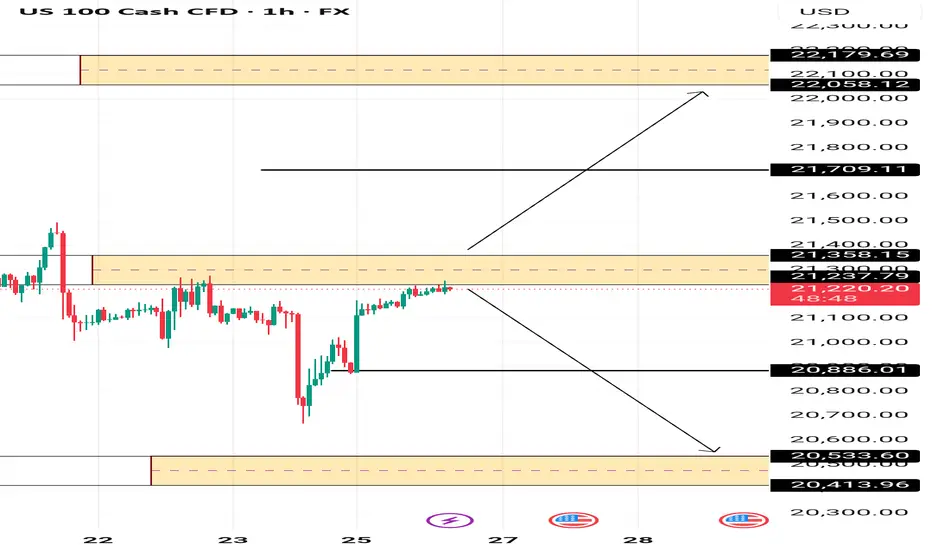
US100 PIVOT AREA The Nasdaq is currently at the pivot area between 21237 and 21385 , if the price remains below this area then 20886 and 20533 could be the next possible targets.
However a break above could trigger bullish momentum targeting 21709 and 22058
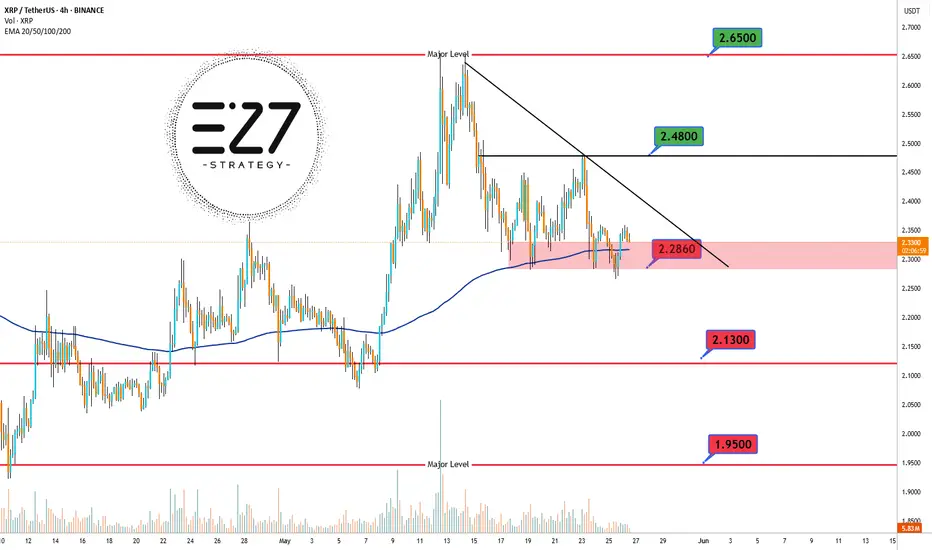
XRPUSDT The 4-hour chart of BINANCE:XRPUSDT shows that the overall trend remains bullish, but the price is currently in a corrective downward phase. 📉 At the moment, XRP is trading in a highly critical zone, right at the 2.2860 USDT support level, which aligns with the 200 EMA — often considered a dynamic support area. 🛡️ Despite this confluence, the price still sits below the descending trendline, indicating continued bearish pressure. ⚠️ If the price manages to hold this key zone and break above the trendline, a move toward the next resistance at 2.4800 USDT and potentially 2.6500 USDT could follow. 🚀 However, losing the 2.2860 support could trigger a deeper drop toward 2.1300 USDT and even 1.9500 USDT. ❗ This current level, where static support intersects with the 200 EMA, is a make-or-break zone that will likely define the short-term direction of XRP.
Support & Resistance Levels:
🔼 Major Resistance: 2.6500 USDT
🔼 Secondary Resistance: 2.4800 USDT
⚡ Dynamic Resistance (trendline): ~2.3500 USDT
🔽 Key Support (current price level): 2.2860 USDT
🔽 Secondary Support: 2.1300 USDT
🔽 Major Support: 1.9500 USDT
BITCOIN BREAKING POINT – Are You Ready for the Next Leg? 🔥 Bitcoin just tagged the previous ATH resistance and is eyeing that juicy 0.618 Fib Extension at $112,180.
But hold on—this isn’t just another breakout… this is structure-breaking territory.
📌 Key Levels to Watch:
💣 ATH Resistance: Retest in progress. A clean breakout here could shift the macro sentiment for good.
🎯 Fib Extension 0.618: $112,180 – first major target.
🚀 Fib Level 1: $135,441 – when disbelief turns to euphoria.
🧠 Fib Level 1.618: $172,928 – max hype zone. Can it happen this cycle?
🧠 Fundamental Nuggets You Need to Know:
✅ Spot ETFs are not just hype – real inflows are coming in daily.
🇺🇸 US Elections = Uncertainty, and Bitcoin LOVES uncertainty.
💰 Global liquidity is quietly increasing – central banks are softening. You feel it?
⚠️ RSI Watch:
Currently hovering around 67.93 – bullish but not overheated yet. Momentum still has fuel.
🧠 Closing Thoughts:
Everyone’s watching this level. Retail is cautious. Smart money is adding.
History tells us: when BTC breaks ATH, altcoins follow like wildfire.
If you're not preparing, you're reacting.
And in this market... reacting = losing.
🚨 Don’t just follow the price – follow the smart money.
🐸 Brought to you by Miracle, of the meme coin dynasty 🧙♂️
🐒 TradeWithMky – where altcoins speak louder than Bitcoin!

Global Payments Inc. Stock Quote | Chart & Forecast SummaryKey Indicators On Trade Set Up In General
1. Push Set Up
2. Range Set up
3. Break & Retest Set Up
Notes On Session
# Global Payments Inc. Stock Quote
- Double Formation
* (Upper Band)) #1 - *Midrange Entry & Retest | Completed Survey
* (Lower Band)) #2 - *Peak Velocity | Subdivision 1
- Triple Formation
* 110.00 USD - *Area Of Value | Subdivision 2
* (TP1) | Subdivision 3
* Daily Time Frame | Trend Settings Condition
- (Hypothesis On Entry Bias)) | Regular Settings
- Position On A 1.5RR
* Stop Loss At 86.00 USD
* Entry At 75.00 USD
* Take Profit At 58.00 USD
* (Downtrend Argument)) & No Pattern Confirmation
* Ongoing Entry & (Neutral Area))
Active Sessions On Relevant Range & Elemented Probabilities;
European-Session(Upwards) - East Coast-Session(Downwards) - Asian-Session(Ranging)
Conclusion | Trade Plan Execution & Risk Management On Demand;
Overall Consensus | Sell
