Bitcoin (BTC/USD) – 4H Analysis
🧱 Accumulation Just Below ATH
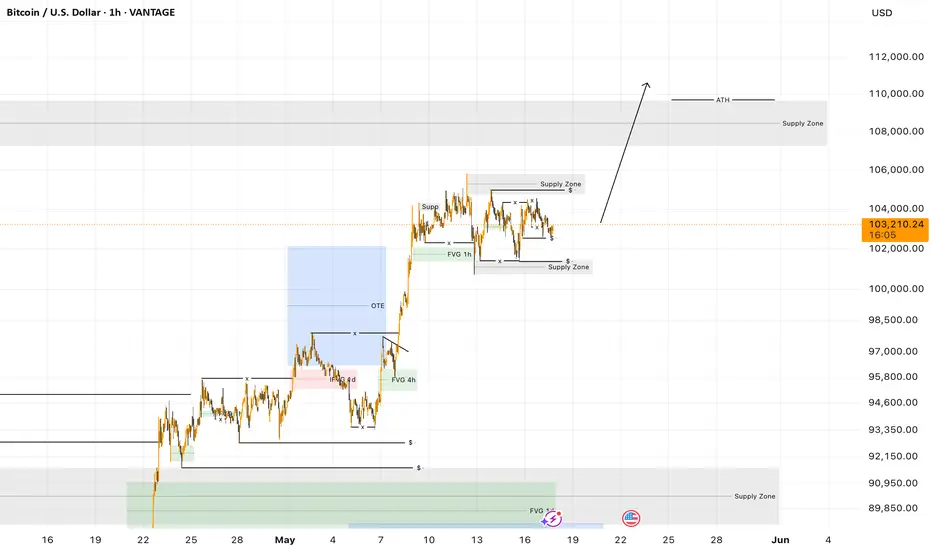
We’re currently observing a tight consolidation phase, right above the bearish OTE (from the 109K → 74K retracement), and just below Bitcoin’s all-time high.
This is a powerful signal :
📌 Price is holding strong instead of retracing.
📌 Sideways structure in a high zone = strength, not weakness.
📌 This type of accumulation near ATH often precedes an explosive breakout.
🚀 What It Suggests
This current setup implies that BTC is absorbing liquidity, building strength, and likely preparing for a significant leg up, potentially a new all-time high extension.
If the price starts breaking out with volume above the consolidation range :
🎯 110K–115K becomes short-term target zone.
🧭 130K+ possible on longer-term Fibonacci extension levels.
✅ Summary
No sign of weakness.
Consolidating at the top = bullish intent.
Next ATH breakout could be imminent.
Pivot Points
Deck pivot Deck has already had a nice pivot from the low and earnings are next week. After a quick analysis it looks like a buy to me. The stock has a strong history of revenue growth and decent operating cash flows. The balance sheet is very healthy as well. Deckers owns Hoka, Ugg, Teva and more popular brands. For a retail company, a 20% net margin is huge, this hows they have pricing power, and a brand moat. Net income has grown at a CAGR of 42% since 2017 which is insane.
My target is 234

ETH/USDTAlt Market on Watch — All Eyes on ETH ⚠️
Despite a strong start to the week, some red flags are starting to show up on the horizon.
The spotlight is on ETH — it’s the key to what’s next for the altcoin market.
In the last update, I shared altcoin levels to work from,
but right now ETH should be your primary reference.
📍 $2400 is a major zone — I’m watching for a reaction there to get aggressive on alt entries.
❌ If that zone doesn’t hold, we’re likely heading down to $2200–2100, possibly even $1900.
No need to overexpose — I’m sitting mostly in cash, waiting for clear signals.
🚫 And most importantly — this is not a short setup (yet).
Let’s wait for the new weekly open before making any big moves.

REI Buy/Long Setup (1D)REI has hit a very significant support zone.
It is expected that the buy orders entering this symbol will be sufficient to create a bullish swing wave.
As long as the demand zone holds, the price can move toward the targets.
targets: 0.02482 _ 0.02948 _ 0.03402
A daily candle closing below the invalidation level would invalidate this analysis.
Do not enter the position without capital management and stop setting
Comment if you have any questions
thank you

XAUUSD[GOLD]; Is it the beginning of the major correction? XAUUSD dropped from 3265$ to 3127$, as predicted in our previous analysis. However, after touching 3127$, the price has retraced slightly and is currently trading at 3178$. In our opinion, the price can go up to $3220 maximum and reject at that level. We need to wait and see how prices behave. Another possible entry point is at 3178$, which is the current trading price. We believe this region is good for selling because the price has struggled to break through it. Please use a proper trading plan while trading gold.
As always, this analysis doesn’t guarantee that price will move as described in the chart. Please use your own knowledge and trading plan while trading gold. Good luck and trade safely.
Want to support us? Do the following ❤️
-LIKE THE IDEA
-COMMENT YOUR VIEW
-SHARE IF YOU AGREE
Much love ❤️
Team Setupsfx_

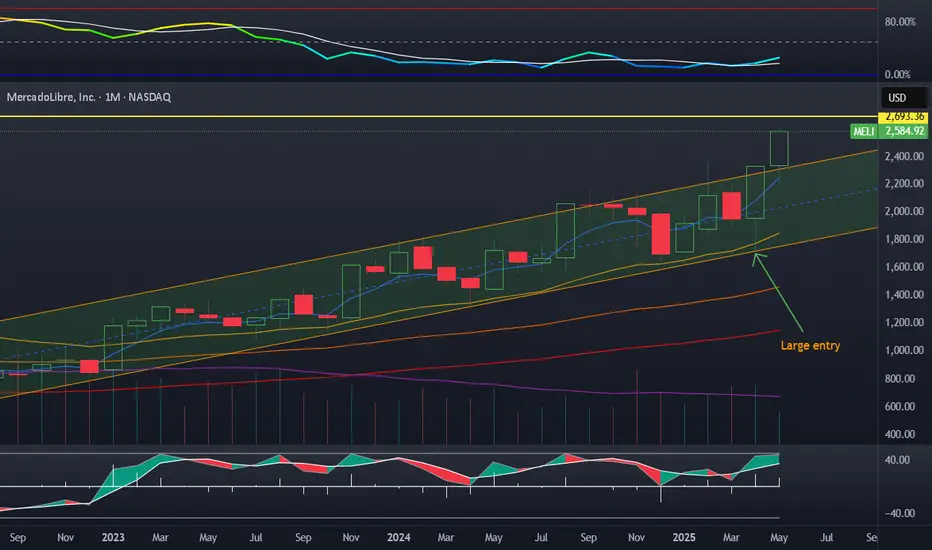
Meli breaking long term channelMeli is breaking the long term channel to the upside. This outstanding company is one of my largest holdings, I plan on holding it for life. I entered hard between 1600-1700$ when the bottom of the channel was tested. My 2700$ target approaches.
Gold seeks buyside.....I'd be interested to engage in buyside delivery if the opportunity presents it to me. The big picture seems to support the idea as the previous three Daily candles have been supported by the Daily BISI to reprice higher prices.

USDJPYIf the Daily BISI holds and supports price to push higher, then I'd be interested to engage. Price is currently at a discount relative to current Dealing Range.

$STO/USDT Bullish Setup:$STO/USDT Bullish Setup:
Price is forming a descending triangle and is now testing the upper trendline — signs of possible breakout.
🔸 Key Support Zone at 0.1100:
This level has held multiple times, showing strong buyer interest.
🔸 Upside Target:
If price breaks 0.1150 with volume, a move toward 0.1650 is likely.
🔸 Risk Level at 0.1050:
If price drops below this, setup is invalid.
$NEIRO, SEED_DONKEYDAN_MARKET_CAP:PEOPLE , ECONOMICS:BOME , $MUBARAK, NYSE:AMP , EURONEXT:CVC , CRYPTOCAP:SYRUP , TSX:FTT , CRYPTOCAP:FXS , NASDAQ:POLYX , TSX:DF , ASX:KSM , $AIXBT, $JELLYJELLY, NYSE:DAR , $LAUNCHCOIN, $HIPPO, $GRASS, SGX:BBT , $SKYAI

BTCDO Analysis | Catch the altseason! (12H)Note: This chart is tied to Bitcoin dominance and moves accordingly.
The trendlines have been lost, the price has dropped, and it has reached a support level. Such strong trends, when they come to an end, usually result in a pullback to the trendline or the broken levels.
Currently, the price may pullback to the supply zone and then enter another correction and drop, which could cause altcoins to turn green again.
Targets are marked on the chart.
A daily candle closing above the invalidation level will invalidate this analysis.
For risk management, please don't forget stop loss and capital management
Comment if you have any questions
Thank You

BTC Re - Entry - Eyes locked on Them 30M HighsPrice came back lookin' too good to ignore - clean reaction off my 100.00 Fib, tucked just below the IDM zone. That 5M order block gave me the nod, and I didn't hesitate.
Re-entered with full intent: this ain't a gamble, it's precision. Structure still bullish, liquidity aboce them 30M hghs is callin'. I'm just walkin' price to the money.
Let's see is BTC plays out how she whispered she would.
#SMC #BTCUSD #PriceAction #OrderBlock #LiquidityRun #FibMastery #5MEntry #30MTarget

BTC Update - Just as CalledPrice took off perfectly from the Order Flow / Demand Zone I mapped out in the previous post.
Bulls Launched from 103,162.58 with precision - exactly where Smart Money stepped in.
Now I'm expecting the 30M high to be taken next as price continues its momentum push.
Simple. Calculated. Controlled.
#BTC #SmartMoneyConcepts #OrderFlow #DemandZone #30MStructure #InducementPlays
#SMCPrecision

OMI - go long with Coliseum Capital Management LLCOwens and Minor
we have some technical reasons here.
1. RSI divergence on the weekly chart: 2025 Februar and April made a doubla bottom formation, with higher RSI in April
2. $6.88 is a year S1 pivot level
3. At $14.1 is a gap wacthing us, promising a 100% upside potential
Fundamental reasons:
1. The whole healthcare sector is down because US government, can be a good contrarian play for 2025 or 2026
2. This spring, Coliseum Capital management bought around 4M Shares, and now holding 31% of the company.
The share price can decline further, breaking the $6.0 level for a short period of time. But it didn't happened in the April panic. $ 5.89 can be a good stop-loss level alltough if you can handle -18% loss.
But i'm waiting for upside momentum in OMI.

Nifty Analysis EOD – May 16, 2025 – Friday🟢 Nifty Analysis EOD – May 16, 2025 – Friday 🔴
Nifty Took a Breather After a Big Bullish Day
📈 Nifty Summary
As anticipated, after Thursday’s strong breakout and euphoric rally, Nifty paused for breath today. Despite Gift Nifty indicating a 75+ point gap-up, the actual open was flat, hinting that global cues couldn't ignite further momentum.
From the start, the tone was set for a retracement-style session—every intraday rise met with selling, while dips around 24,980 continued attracting buyers, keeping the structure range-bound but supported.
The most notable observation: today’s low aligned with the 23.8% Fibonacci retracement of yesterday’s candle, which shows bulls are still in control and defending key levels. However, the recovery from the day’s low couldn’t break past the 50% retracement of the same range—signalling hesitation and exhaustion in the short term.
📊 Intraday Walk
🟢 Flat open despite positive Gift Nifty cues
⚖️ Mean-reverting price action throughout
🧲 Buying seen repeatedly near 24,980
❗Rejection seen around 50% retracement of the previous day’s candle
🔚 Closed mildly negative; a pause, not panic
🕯 Daily Candle Breakdown
Candle Type: Small-bodied candle (Doji-ish) indicating indecision
Range: Tight and narrow (117 Points) session
Key Observation: Low held above 23.8% retracement of May 15 candle
What it Implies: Bulls still holding ground, but upside conviction lacking
🎯 Gladiator Strategy Update
Strategy Parameters
ATR: 350.94
IB Range: 94.2 → ✂️ Small IB
Market Structure: ⚖️ Balanced
Trade Highlights
⚠️ 1st Short Trigger: 11:05 → No Entry Initiated
💼 Total Trades: 0
📍 Support & Resistance Levels
🟩 Resistance Zones:
25,116 ~ 25,128
25,180 ~ 25,212
25,285
25,399
25,485 ~ 25,511
🟥 Support Zones:
25,000 ~ 24,980
24,882
24,800 ~ 24,768
24,730
24,660
24,590
24,530 ~ 24,480
🔮 What’s Next?
Today was a classic breather candle after a strong impulse. If Monday opens bullish and crosses above 25,070, we could see a continuation of the uptrend. But a close below 24,950 may be the first red flag for bulls.
🧠 Final Thoughts
Markets don't rise in a straight line. Today was a healthy pause—a base-building day. As long as 24,980 holds, the bulls have the upper hand.
“A pause in trend isn’t weakness—it’s preparation.”
✏️ Disclaimer
This is just my personal viewpoint. Always consult your financial advisor before taking any action.

NZD/CHF For Bullishwait for pull-back near by entry point and then go long
general trend is up trend
have fun :)

AUD/CHF For Bullishyou can go long now
or
wait for pull-back near by entry point and then go long
general trend is up trend
have fun :)

EUR/CHF For Bullishwait for pull-back near by entry point and then go long
general trend is up trend
have fun :)

SHIB/USDTWe're seeing liquidity grabs followed by the start of a local bullish move.
Looking to enter long from the highlighted zone, but only if proper conditions and confirmations align.
🎯 Upside targets: 1765 – 1918 – 2496 points


GBP/CAD For Bearish as pull-backyou can go short now as pull-back
general trend is up trend
current phase is pull-back
have fun :)

GBP/NZD For Bearish as pull-backwait for pull-back near by entry point and then go short
general trend is up trend
current phase is pull-back
have fun :)

AUD/NZD For Bearish as pull-backwait for pull-back near by entry point and then go short
general trend is up trend
current phase is pull-back
have fun :)

NZD/USD For Bullishwait for pull-back near by entry point and then go long
general trend is up trend
have fun :)
