AUD/CAD For Bullishwait for pull-back near by entry point and then go long
general trend is up trend
have fun :)
Pivot Points

NZD/CAD For Bullishyou can go long now
or
wait for pull-back near by entry point and then go long
general trend is up trend
have fun :)

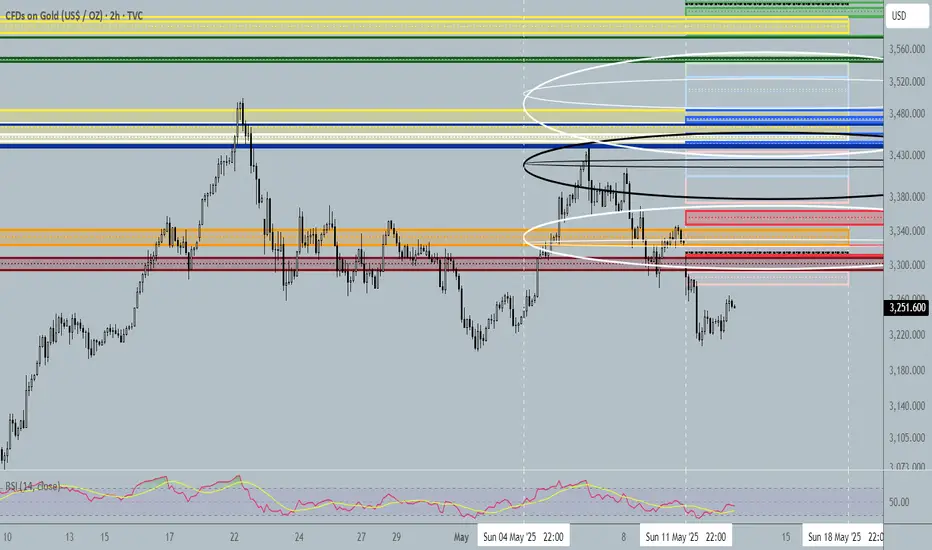
Key Levels for the Week 05/12/2025 ∷Gold∷🐍 Key Levels Overview for the Week🐍
__________________________
Resistances🔀 3477,3578,3630,3680
Mids∷∷∷ 3406,3443,3486,3527
Supports🔀 3435,3364,3311,3278
Trend Base Lines...
34229🐂3487🐂3524🐂3557
3378🏛3416🏛3425🏛3458
3296🐻3322🐻3330🐻3370
JOE Looks Bullish (1D)A 3D divergence is visible on the chart, indicating that sellers have exited their short positions.
A key trigger line has been broken, and the price has reclaimed critical levels.
We have identified two entry points where we plan to open buy/long positions.
A daily candle closing below the invalidation level will invalidate this analysis
Do not enter the position without capital management and stop setting
Comment if you have any questions
thank you

LPT Buy/Long Setup (4H)With the strong bullish momentum and upward movement, a swap zone has formed on the chart.
The price is gradually pulling back to this level. We can look for a buy/long position around the green zone.
A daily candle close below the invalidation level will invalidate this analysis.
For risk management, please don't forget stop loss and capital management
Comment if you have any questions
Thank You

"When Structure Talks, I Listen..."Bird's eye on the 30M - clean breakdown in structure where that HL got smoked, confirming major intent shift. I marked out the previous structure in orange on the left so y'all can see how price came off that congestion and finally showed its hand. Now we wait. Liquidity and inducement sitting real sweet just above that OB - where the lil' penguin's chillin', that's me, eyes peeled, waiting for price to mitigate and deliver.
To the right, I sketched the vision - how I see price in motion. Structure's just a rhythm, and this setup's got a melody I've heard before. That bullish correction is just a tune - up before we ride this short wave. Waitin' on confirmations, no rush -'cause I ain't just trading.... I'm reading the market like a sounthern sermon.
"Price broke its promise to the bulls... now it's lookin' to comeback home before takin' the back door out. I'm already at the door with my boots on. Let's dance."
Bless Trading

STX ANALYSIS (2D)The STX pair has reached a demand zone.
A price movement fractal seems to be repeating (highlighted by the orange and white boxes).
In the orange boxes, every time STX has dropped more than 72%, it has made a rebound move to the upside.
We are looking for buy/long positions around the demand zone.
The targets for STX are $0.93 - $1.10 - $1.30.
A daily candle close below the invalidation level will invalidate this analysis.
For risk management, please don't forget stop loss and capital management
When we reach the first target, save some profit and then change the stop to entry
Comment if you have any questions
Thank You


“From flag talk to flow walk—price always reveals the truth.”Cleared out the noise. That “flag” everyone was drawing? Just liquidity congestion in disguise. I refined the chart and locked in on what mattered: major structure broke from the top, and price cleanly took out that internal HL—confirming the shift.
Now we’re watching BTC reach above BSL, aiming to mitigate into a key 30M supply zone before continuing the drop.
The real target? That bullish OB sitting below, waiting to be respected for a clean higher timeframe continuation.
This is how we read the market with purpose—not patterns.
Flow, mitigation, and liquidity—pure precision.
Bless Trading!

S&P 500 – an ascending channel on Daily Daily Chart (D1) :
I'm observing an ascending channel, with a potential manipulation near its lower boundary.
If that happens, we may see the formation of a bullish pivot point.
Hourly Chart (H1) :
I've marked the boundaries of the daily channel on H1.
There’s an unfilled gap below, and price might revisit that area.
I’m watching the 5690.7 level closely — it could act as a key zone for potential long setups.
📈 If 5690.7 holds , possible long targets include:
🎯 A break above the local high at 5848
🎯 The upper boundary of the channel, which closely aligns with the anticipated bullish pivot point target
📉 If price fails to hold above 5690.7 and breaks lower,
I’ll start considering short scenarios and will update this idea accordingly.

PEPE 80% Profit🚀 BINANCE:PEPEUSDT just made a big move!
It surged from 0.00000820 to 0.00001244 and then corrected to 0.00000956 📉
Now it’s sitting on strong support — and if it holds, another rally could be on the way! 💥
🎯 Next resistance levels:
0.00001244 (recent high)
0.00001719 (next key level)
0.00002317 (major long-term target) 🏁
📌 Key support zones:
0.00000956 (current support)
0.00000820 (late May support)

NZD/USD For Bearishwait for pull-back near by entry point and then go short
general trend is down trend
NZD under Pressure
have fun :)

GBP/JPY For Bullishyou can go short now to entry point
or
wait for pull-back near by entry point and then go long
general trend is up trend
have fun :)

NZD/JPY For Bullishwait for pull-back near by entry point and then go long
general trend is up trend
have fun :)

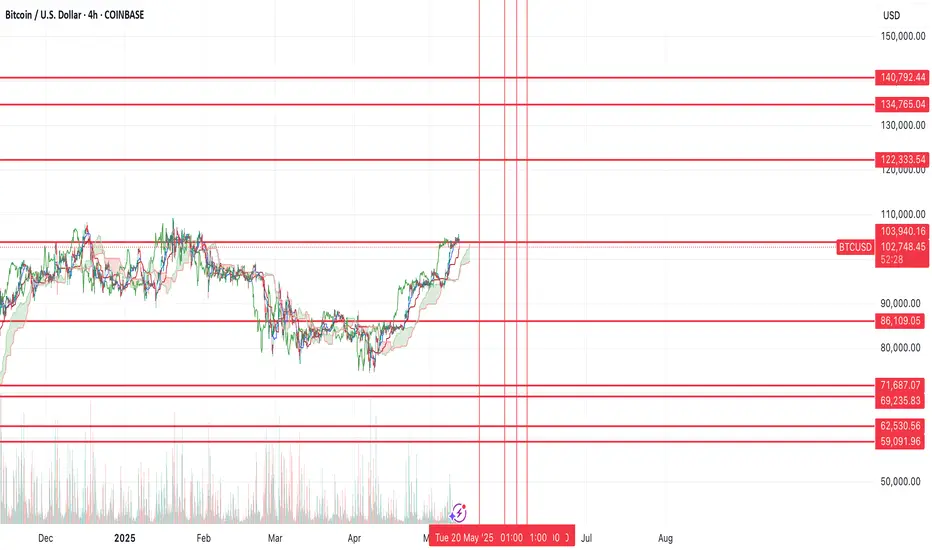
$BTC probability still favors new lowBTC has had a strong rally back into the prior resistance and unless we can break above the prior highs, I still think probability still favors more downside (and I think we see a new low).
I've marked off support levels and resistance levels as I think this will largely be the range over the next year.
My base case as of now, is that we see one more low down in the $69k-$62k region before we start a new run to the highs above ($122k+). Another possibility is that we sweep the lows and bounce at $72k, then move up towards the highs.
That said, the reason I think lower is due to the massive imbalance on the chart that needs to get resolved.
Overall I still think we're in a bullish trend, but that we continue to pullback before the final move higher.
CAD/JPY For Bullishwait for pull-back near by entry point and then go long
general trend is up trend
have fun :)

$SPY still bearish unless $584 and trendline break as resistanceI'll be the first to admit that the rally has gone further than I expected. That said, everything on the chart still looks like this is a bearish rally and not a new bull trend.
Unless we can break the blue trend line and the strong overhead resistance between $581.63 and $583.57, I think the most likely scenario is we fall further and see one last leg down before we bottom.
I think the bottom will come between the lower supports at $409 and $538.
Again, invalidation of the bearish idea is a break and flip of the resistances above, the upside targets are on the chart as well.
Let's see what happens over the coming weeks.

AUD/JPY For Bullishwait for pull-back near by entry point and then go long
general trend is up trend
have fun :)

BANDUSDT: trend in daily time framesThe color levels are very accurate levels of support and resistance in different time frames, and we have to wait for their reaction in these areas.
So, Please pay special attention to the very accurate trend, colored levels, and you must know that SETUP is very sensitive.
Be careful
BEST
MT

Master HBAR with Fibonacci: The Golden Pocket BlueprintSince topping out at $0.20151, HBAR has spent the last nine days in a corrective pullback. Digging into a rich confluence of supports that offers a long trade setup. Here’s how to spot the high‑probability entries, manage your risk, and scale out for maximum reward.
Current Context
Two days ago, price was firmly rejected at the weekly open ($0.19029) right alongside the anchored VWAP drawn from the $0.28781 swing high.
HBAR now trades below the monthly open ($0.18210), the weekly open ($0.19029), and the daily open ($0.18024), sitting at about $0.177.
Just beneath today’s level lies the swing low at $0.17543. Breaching this could flush out stops before any meaningful bounce.
The Golden Support Zone
All signals converge between $0.170 and $0.1725:
The anchored VWAP from the $0.12488 low sits at around $0.17.
The 0.618 fib retracement of the $0.15396→$0.20239 move falls at $0.17246. Just under the swing low where the liquidity lies.
The secondary 0.666 fib retracement lands at $0.17014, reinforcing that floor.
Volume‑profile analysis of the past 27 days pins its Point of Control right at $0.17, great confluence with the anchored VWAP.
This “golden pocket” is your pivot for a low‑risk, high‑probability long.
Long Trade Setup
Ladder buy orders between the swing low ($0.17543) and the 0.666 fib at $0.17014.
Aim to average in around $0.1725.
Place a single stop‑loss just below $0.17
Scaling Your Exits
First Partial Exit at the monthly open ($0.18210). This offers roughly a 2:1 R:R.
Second Exit Zone around the weekly open and VWAP resistance (~$0.19) for about a 3:1 R:R.
Final Target at the 0.618 fib retracement of the entire down‑wave (from $0.28781 to $0.12488) near $0.2256. An astounding 10:1 payoff for the patient trader.
Keep in mind a potential false‑break (SFP) at $0.17543: if price briefly dips below then snaps back up, with increased volume.
Short Trade Setup
For traders looking to play the downside from the “golden pocket” flip, here’s a clear short strategy:
Entry Zone: Ladder short entries between the 0.618 fib at $0.22557 and the 0.666 fib at $0.23339.
Confluence: The 0.666 level aligns perfectly with the negative 0.618 fib from the prior swing, creating a resistance zone.
Stop‑Loss: Place your stop just above $0.23339, invalidating the confluence.
Take‑Profit: Target a return to around $0.206, where you can lock in gains as HBAR retests its previous high.
By scaling into shorts across that fib band, you balance your risk and capture the high‑odds reversal offered by stacked Fibonacci confluence. Let the golden pocket guide both your longs and shorts!
Key Takeaways
Confluence is king: VWAPs, Fibonacci retracements, Liquidity and volume‑profile all align in the $0.170–$0.175 zone.
Risk control: One stop‑loss under $0.17 protects the entire laddered entry.
Tiered targets: Small wins at $0.182, larger as you clear $0.19, and a big payoff if HBAR rallies toward $0.225. Trail your SL accordingly.
Patience pays: Wait for price to enter the golden pocket, avoid chasing!
With these confluences lining up and clear levels to work from, HBAR’s next high‑probability long setup is staring you in the face. Trade smart, size appropriately, and let the market reward your discipline.
Happy Trading!
___________________________________
If you found this helpful, leave a like and comment below! Got requests for the next technical analysis? Let me know.

HBARUSDT: Critical Zone Alert! HBARUSDT: Critical Zone Alert! 🚨
Folks, the blue box on HBARUSDT is a key area —absolutely critical from multiple angles. This zone could deliver some strong reactions, but let me remind you, this is a 1-hour chart . Don’t go in expecting massive percentage moves; instead, focus on disciplined, calculated entries.
Why the Blue Box Matters:
High-Precision Level: Carefully chosen using advanced tools—CDV, liquidity heatmaps, volume profiles, and volume footprints.
High Probability Area: A spot where buyers have historically stepped in.
Smart Trading Opportunity: If conditions align, this could be a strong setup for tactical traders.
Pro Tip: Set your alarms for this zone—it’s worth your attention, but always manage your expectations and risks carefully.
Want to trade smarter? DM me to learn how I use CDV, liquidity heatmaps, volume profiles, and volume footprints to find these precise zones.
If you find this helpful, don’t forget to boost, comment, and follow! Let’s elevate your trading game together. 🌟
Let me tell you, folks, this is amazing. Nobody does analysis like I do. Believe me. If this helps you, don't forget to boost and comment! It’s a big deal, motivates me to share even more winning insights with you. Tremendous insights.
I keep my charts the best, clean, simple, and clear. You know it, I know it, clarity leads to better decisions. No question about it. My approach? Built on years of tremendous experience. Incredible track record. I don’t claim to know it all, but I spot high-probability setups like nobody else. Trust me.
Want to learn how to use the heatmap, cumulative volume delta, and volume footprint techniques I use to determine demand regions with stunning accuracy? Send me a private message—totally free, folks. That’s right. I help anyone who wants it, absolutely no charge. Unbelievable value.
Here’s the list, long list, great list, of some of my previous incredible analyses. Each one, a winner:
🎯 ZENUSDT.P: Patience & Profitability | %230 Reaction from the Sniper Entry
🐶 DOGEUSDT.P: Next Move
🎨 RENDERUSDT.P: Opportunity of the Month
💎 ETHUSDT.P: Where to Retrace
🟢 BNBUSDT.P: Potential Surge
📊 BTC Dominance: Reaction Zone
🌊 WAVESUSDT.P: Demand Zone Potential
🟣 UNIUSDT.P: Long-Term Trade
🔵 XRPUSDT.P: Entry Zones
🔗 LINKUSDT.P: Follow The River
📈 BTCUSDT.P: Two Key Demand Zones
🟩 POLUSDT: Bullish Momentum
🌟 PENDLEUSDT.P: Where Opportunity Meets Precision
🔥 BTCUSDT.P: Liquidation of Highly Leveraged Longs
🌊 SOLUSDT.P: SOL's Dip - Your Opportunity
🐸 1000PEPEUSDT.P: Prime Bounce Zone Unlocked
🚀 ETHUSDT.P: Set to Explode - Don't Miss This Game Changer
🤖 IQUSDT: Smart Plan
⚡️ PONDUSDT: A Trade Not Taken Is Better Than a Losing One
💼 STMXUSDT: 2 Buying Areas
🐢 TURBOUSDT: Buy Zones and Buyer Presence
🌍 ICPUSDT.P: Massive Upside Potential | Check the Trade Update For Seeing Results
🟠 IDEXUSDT: Spot Buy Area | %26 Profit if You Trade with MSB
📌 USUALUSDT: Buyers Are Active + %70 Profit in Total
🌟 FORTHUSDT: Sniper Entry +%26 Reaction
🐳 QKCUSDT: Sniper Entry +%57 Reaction
📊 BTC.D: Retest of Key Area Highly Likely
And that’s just the start. The list goes on and on, folks. It’s a tremendous list, the best. I stopped adding because, frankly, it’s tiring. So many wins. People are amazed. You can check my profile and see for yourself, winning moves, all the time. Believe me, nobody does it better.

Nifty Analysis EOD - May 12, 2025 - Monday🟢 Nifty Analysis EOD - May 12, 2025 - Monday 🔴
🚀 Peace Talks & Policy Push – Bulls Break Chains, Nifty Soars to New Heights!
Opening Mood:
Relief from geopolitical tension and global trade optimism lit a fire under the bulls—marking one of the most powerful sessions in recent weeks.
🧭 Nifty Summary:
Following positive developments—ceasefire between India and Pakistan and trade policy easing between China and the US—Gift Nifty signaled a sharp gap-up.
Nifty opened at 24,420 (▲ 412 points | 1.72%), jumping above multiple resistance levels: 24,400~24,420 and 24,365~24,300. The first 5-minute candle alone posted a 184-point rally—and from there, bulls never looked back.
By breaching the 24,800 resistance and making a new swing high at 24,944.80, the day stamped bullish dominance. The close just 20 points below the high reflects strong buying interest and minimal profit booking.
🕯️ Daily Candle Breakdown:
Today’s Candle: Bullish Marubozu (full-bodied, tiny/no wicks) — high conviction buying
Close: 24,924.60 (Near day’s high)
Key Observations:
✅ Breakout above 24,800 resistance
✅ Closed above 22nd Oct 2024 candle high — a key Head & Shoulder confirmation level
✅ Strong volume and price confirmation
🔜 Watch for follow-through above 24,700–24,800 zone
What It Implies:
Clear strength from bulls with no hesitation. If follow-through sustains, we could be heading toward a fresh leg of upside—likely to test the psychological 25,000 mark and beyond.
⚔️ Gladiator Strategy Update
Strategy Parameters:
ATR: 355.76
IB Range: 358.95 → Extreme Large IB
Market Structure: ImBalanced
Trade Highlights:
Total Trades: 1
✅ Long Trigger @ 12:25 PM → Target 1:3.5 Achieved
📈 Intraday Walk (5-Min View):
Opened strong above multiple resistance zones
First candle: explosive 184-point rally
Smooth rally continued with no major retracement
A new swing high formed at 24,944.80
Day closed just shy of the high—strength intact
🔍 Support & Resistance Levels
🔼 Resistance Zones:
24,980 ~ 25,000
25,100 ~ 25,128
25,180 ~ 25,212
🔽 Support Zones:
24,882
24,800 ~ 24,768
24,730
24,660
24,590
24,530 ~ 24,480
📌 Final Thoughts:
"Markets love clarity. With news-driven fear subsiding, technicals are taking charge again. Follow momentum—but don't chase it blindly."
✏️ Disclaimer
This is just my personal viewpoint. Always consult your financial advisor before taking any action.

ASTR Buy/Long Setup (12H)Two major trigger lines have been broken, and the price is currently sitting at a key level.
A bullish CH (Change of Character) is visible on the chart.
If the demand zone holds, the price may move toward the targets marked on the chart.
A daily candle closing below the invalidation level will invalidate this analysis.
Do not enter the position without capital management and stop setting
Comment if you have any questions
thank you
