GBPUSD| - Bearish Play Setting UpPair: GBPUSD (GU)
Bias: Bearish
HTF Overview: Bearish structure intact — market has been respecting lower highs and pushing into downside pressure.
Current Zone: Price just mitigated the 30M OB, reacting as expected within the supply zone.
LTF Confirmation: Now waiting for clean confirmations on 5M or 1M — not in trader mode yet, analysis still in control.
Entry Zone: Watching for internal liquidity sweep or inducement followed by structure shift to confirm the sell.
Targets: First target is the next 30M low — extended target based on 1H continuation.
Mindset Note: No chasing — let the LTF tell the story before pulling the trigger. Control the urge, trust the system.
Bless Trading!
Pivot Points

USDJPY - Bullish Bias, In OB ZonePair: USDJPY (UJ)
Bias: Bullish
HTF Overview: Bullish structure remains intact — price currently pushing upward, respecting higher timeframe flow.
Current Zone: Price is now sitting within the 30M OB, showing potential strength but no LTF confirmation yet.
LTF Confirmation: Still in analysis mode — sitting on hands, waiting for clean reaction on 5M or 1M before considering entries.
Entry Zone: 30M OB being monitored closely — ideal setup would include inducement and clear shift before entry.
Targets: Next 1H high remains the first target — extended targets to be trailed if momentum builds.
Mindset Note: Analysis first, execution second. Discipline is the edge — no rush until LTF gives the green light.
Bless Trading!

XAUUSD - Bullish Bias Holding StrongPair: XAUUSD (Gold)
Bias: Bullish
HTF Overview: Multi-timeframe structure aligned bullish. Market is in a clear uptrend across 4H and 1H, currently retracing toward key OB levels.
LTF Confirmation: Waiting on price to mitigate the 1H OB — once tapped, will drop to 15M and 5M for confirmation before any entries.
Entry Zone: 1H OB marked — setup strengthens if inducement or liquidity sweep occurs just before mitigation.
Targets: Short-term target is the previous high — extended target based on 4H continuation range.
Mindset Note: Alignment is there — now it’s about patience and waiting for execution clarity. Let price deliver the opportunity.
Bless Trading!

GBPJPY| - Bullish Opportunity DevelopingPair: GBPJPY (GJ)
Bias: Bullish
HTF Overview: 1H structure remains bullish with clear higher highs. Market currently pulling back toward a visible 1H Order Block.
LTF Confirmation: Waiting for price to mitigate the 1H OB, then will drop to 15M and 5M for bullish confirmation before entering.
Entry Zone: OB zone marked and active — ideal setup includes liquidity grab or inducement before confirming entry shift.
Targets: First target is recent 1H high — extended targets based on continuation structure above.
Mindset Note: No need to force the trade — the edge comes after the zone is respected and price confirms. Let the setup come to you.
Bless Trading!

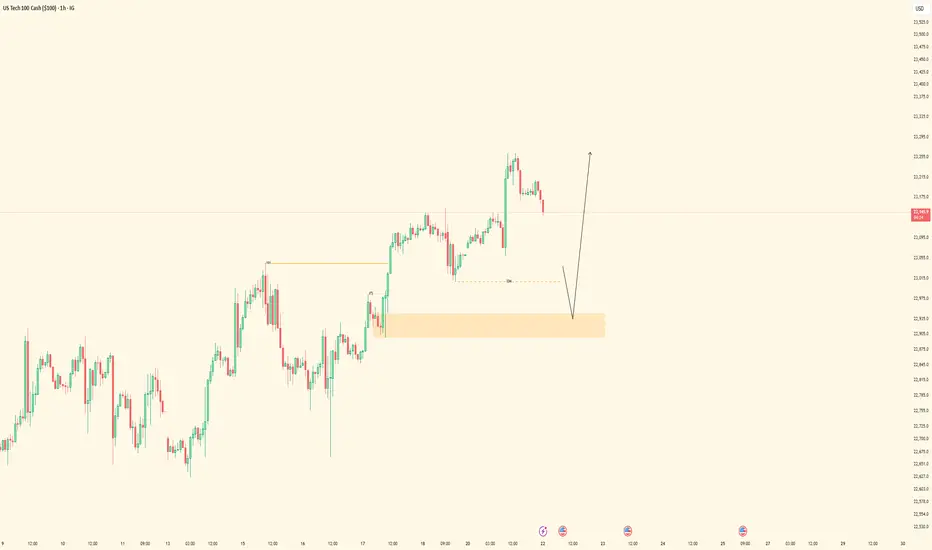
NAS100 - Bullish Setup BuildingPair: NASDAQ (NAS100)
Bias: Bullish
HTF Overview: 1H structure holding bullish after recent break of internal highs. Price pulling back toward a key demand zone.
LTF Confirmation: Waiting for price to mitigate the 1H Order Block, then drop to lower timeframes (15M → 5M) for confirmation entries.
Entry Zone: Watching for bullish reaction within OB, ideally paired with inducement or liquidity sweep before shift.
Targets: Short-term target is the next 1H high — extended targets align with overall bullish momentum continuation.
Mindset Note: Patience over prediction. Let price tap into the zone and confirm — don’t chase, just position smart.
Bless Trading!
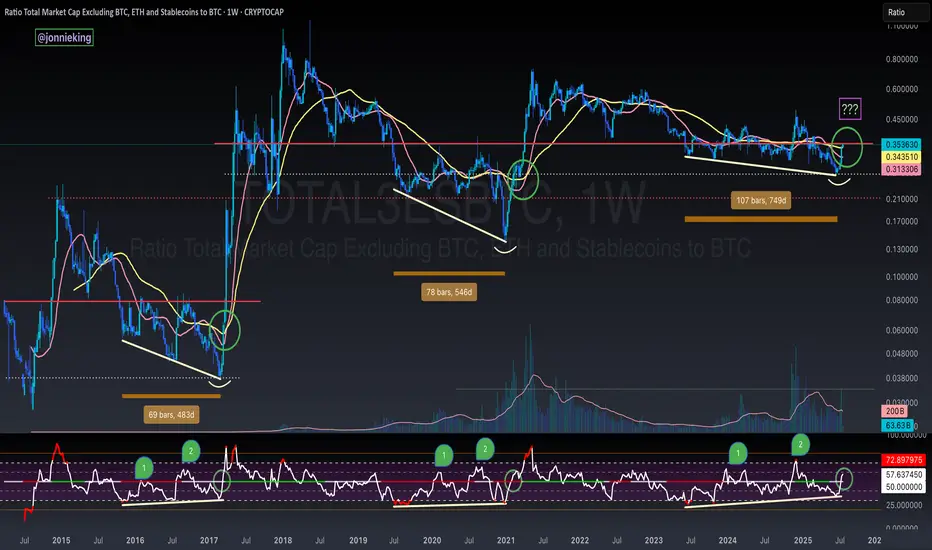
TOTAL3 / BTC - ALT SEASON BREAKOUT - Bullish Divergence SpottedBULLISH DIVERGENCE on CRYPTOCAP:TOTAL3 against CRYPTOCAP:BTC 🏁
You will see every time the RSI passed 50 on the Weekly chart in the post-Halving year it signaled Alt Season 🚀
This coincided with 3 tests of this level at 50, with the 3rd test being the real breakout 🤌🏼
Volume confirms change in trend 🏁
AWAITING CONFIRMATION 🚨
🅾️ Close several Weeks above key neckline resistance (currently here)
🅾️ Bullish Cross on the 20 / 50WMA
NZDCAD Buy?? it looks juicy Hello please do not aim for the top of the range!!
Now because its NZDCAD it might look choppy and it might be choppy.

GBPCAD juicy very juicyThis is an A+ setup!!
Not perfect but clean.
I dont usually see a cup and handle a lot but this one certainly looks juicy.
SL behind the pivot, mmmhhh just juicy.

Selling USDCHFHello traders Hope you are having a wonderful week!!
Clear downtrend!!
We can say about 4 touch trendline but technically its 3.
You can see it!!

$META Day Trade Update | 15m TF📈 NASDAQ:META Day Trade Update | 15m TF
VolanX DSS framework still intact. Price broke out cleanly from a descending triangle, retested the breakout zone near 713.8, and is now stabilizing above 714.6. We’re printing a bullish structure with momentum building toward:
🎯 Primary Target: 725.99
🧠 Fib Levels in Play:
0.618 = 711.47 (support held)
0.786 = 713.89 (pivot zone)
1.618 = 725.99 (target in sight)
📌 Key Observations:
Retest successful, no wick violation below triangle
Volume holding steady post-breakout
RSI/MACD divergence resolved on lower TFs
If momentum sustains, META may front-run 725 with a sweep into 728–731.5 extension. We’ll adapt based on order flow and price action near 722.5 resistance.
📡 Protocol: VolanX DSS | SMC + Fib + Triangular Structure
🔁 Still stalking. Exit at 725 or scale-out from 722 based on intraday momentum.

Nifty Analysis EOD – July 21, 2025 – Monday 🟢 Nifty Analysis EOD – July 21, 2025 – Monday 🔴
“Shock, Squeeze, and a Strong Close — Bulls Reclaim 25K”
Today’s move was nothing short of shocking. In the first 45 minutes, Nifty plunged more than 150 points, breaking through key levels and touching 24,882. But what followed was a V-shaped recovery that caught both Friday’s shorts and those who shorted below PDC/PDL completely off guard.
The index powered up to mark a day high of 25,080, and sustained above CPR and VWAP throughout most of the session. A final push came around 2:55 PM, breaking the intraday trendline and CDH, registering a fresh high before closing near the top at 25,090.70.
✅ Bulls not only held 25K — they dominated the battlefield all day, recovering almost everything lost during Friday’s drop.
🕯 5 Min Time Frame Chart with Intraday Levels
🕯 Daily Time Frame Chart with Intraday Levels
🕯 Daily Candle Breakdown
Open: 24,999.00
High: 25,111.40
Low: 24,882.30
Close: 25,090.70
Change: +122.30 (+0.49%)
📊 Candle Structure Breakdown
Real Body: 91.70 points → strong bullish body
Upper Wick: 20.70 points → slight hesitation near highs
Lower Wick: 116.70 points → deep intraday buying from the lows
🔍 Interpretation
Mildly negative open, followed by a sharp 150-point fall
Buyers stepped in strongly near 24,880, triggering a sharp reversal
V-shape recovery sustained above CPR & VWAP, closing near high
Close is not just above open — it’s above Friday’s close and 25K mark
🕯 Candle Type
Hammer-like Bullish Reversal Candle — Long lower wick with green body, signaling strong dip buying and possible short-term trend reversal
📌 Key Insight
Strong defense at 24,880–24,900 created the base for reversal
Close above 25,090 shifts near-term bias in favor of bulls
25,110–25,140 is the next resistance to watch
As long as we stay above 24,900, buyers hold the edge
🛡 5 Min Intraday Chart
⚔️ Gladiator Strategy Update
ATR: 186.31
IB Range: 166.8 → Wide IB
Market Structure: 🟡 Balanced
📉 Trades Triggered:
10:09 AM – Long Trade → ❌ SL Hit
📌 Support & Resistance Levels
Resistance Levels:
25,080 ~ 25,060
25,125
25,168
25,180 ~ 25,212
Support Levels:
25,037
25,000 ~ 24,980
24,965
24,894 ~ 24,882
24,825
24,800 ~ 24,768
💭 Final Thoughts
🧠 “Volatility doesn’t confuse the market — it reveals who’s in control.”Today’s V-shaped reversal erased all doubts from Friday’s fall. Buyers didn’t just defend — they counterattacked and reclaimed 25K with authority.Follow-through above 25,125 on Monday could confirm trend resumption.
✏️ Disclaimer
This is just my personal viewpoint. Always consult your financial advisor before taking any action.

AMD enters new bullish rangeAMD has entered the bullish range I called for recently. I believe this will be a strong consolidation zone before new all-time highs. BBWP and stochastic will overheat here and need to reset. My target for the year is 235$.

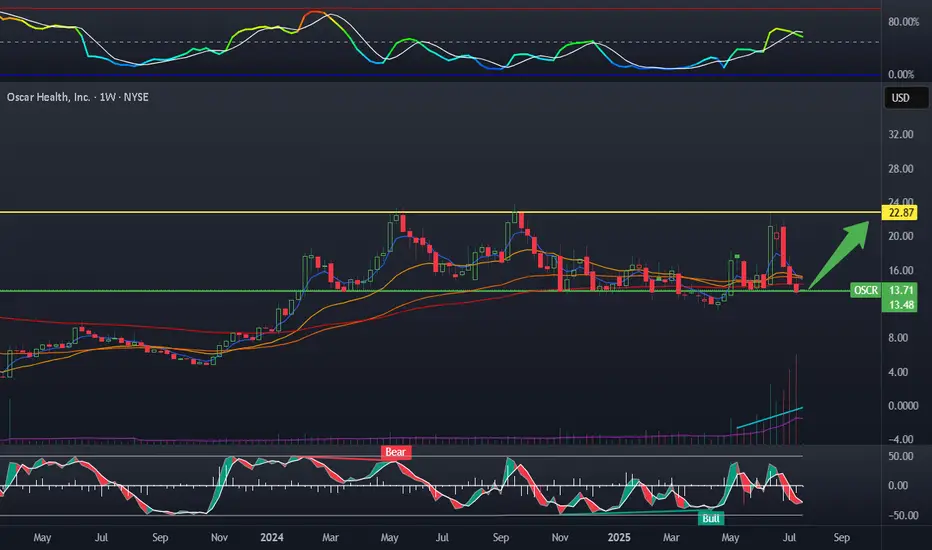
OSCR will pumpOSCR was heavily shorted this past week despite growing fundamentals. The market seems split on the stock. I see heavy growth of baseline revenue, and operating cash flow turning positive. If the company makes 15 billion in revenue in 2023 with a 6% margin that will be 900 million in earnings. This would equate to a 30 billion dollar market cap with a similar multiple. If ICHRA can expand the way the CEO predicts, an untapped 100 billion dollar market awaits. Since Oscar has utilized Ai as they built the platform, their Margins should be higher than traditional insurance companies, they will be more efficient.
TA wise: I see a massive volume swell, resetting stochastic, and a cooling BBWP.
I will see covered calls around 16=18$ again and offload some LEAPs if we get another huge pump.
BTC.DThe next potential reaction area is the monthly FVG. Once price reaches this zone, I’ll be closely monitoring price behavior for signs of a shift.
Patience until the level is tapped — no assumptions without confirmation.

I'm currently long on EUR/GBPPrice is currently reacting to a retest of an order block located within the discount zone, following a Shift in Market Structure (SMS).
Additionally, on the weekly timeframe, price is also positioned in the discount zone, aligning with a weekly order block at the same level.
Disclaimer: This is not financial advice—just my personal analysis.

BTCDCame down and nail the first target .
Let’s see how she responds.
Really believe this the beginning of it all.

CNY/USD Trend since 06 2007. Channel. Reversal zone.Logarithm. Time frame 1 week. At the moment, the currency is stronger than the dollar.
The main trend is a descending channel. The price is in it now.
Secondary trend — breakout of the descending trend line. Price growth to the median of the channel, and in case of its breakthrough, to the resistance. If not, then a pullback to the lower zone of the channel.
Local trend — The nearest events and news background, which can affect (not necessarily) locally (movements to the median of the channel, i.e., the middle, if it is positive) on the yuan rate. This, in less than 1 month, namely from October 22 to 24, 2024 will be held 7.16 XVI BRICS summit (short for Brazil, Russia, India, China, South Africa) in Russia in Kazan.
Line graph for visualization.

GBPJPY- UPDATED ANALYSIS GBPJPY Bias: Bullish HTF Overview (4H): Price remains in strong bullish structure, with higher highs continuing to break. No signs of deep pullbacks toward major SSLs, confirming strength in the current leg. LTF Confirmation (30M): Clean refined structure now visible. Market gave a textbook pullback into a fresh demand zone (30M OB) after sweeping minor liquidity. No need to expect a deeper move unless invalidated. Entry Zone: Watching for price reaction from the refined 30M OB. If price respects this level, I’ll drop to 5M for LH break → 1M for entry precision. Targets: Eyes on recent high as first TP, followed by extended targets if momentum continues. Mindset Note: Sometimes the best move is simply refining levels and letting the setup come to you. No rush, just alignment.

GBPJPY - Bullish Continuation Setup• Pair: GBPJPY
• Bias: Bullish (Buy)
• HTF Overview (4H):
• Strong bullish momentum with clear breaks to the upside.
• No signs of price reaching deeper 4H SSL — continuation more likely.
• MTF Refinement (30M):
• Watching for price to mitigate lower 30M OB zone.
• Expecting bullish continuation from that area.
• Entry Zone:
• Wait for LTF confirmation inside 30M OB.
• Switch to trader mode after valid CHoCH / intent confirmation.
• Targets:
• Structure highs / clean extension into the next liquidity pool.
• Mindset Note:
• Be patient, trust bullish structure. Let price come to you.
Bless Trading!

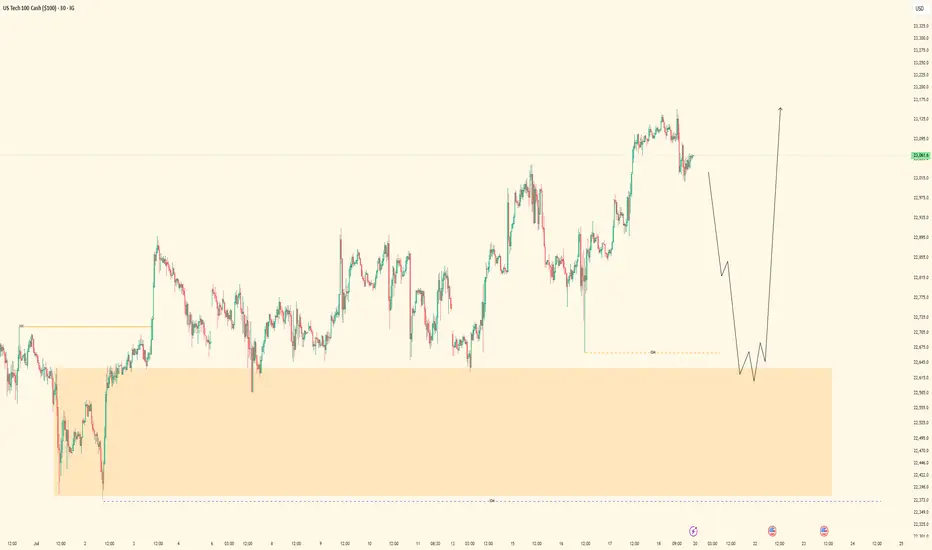
NAS100 - Bullish Trend Continuation Setup• Pair: NAS100 (Nasdaq)
• Bias: Bullish
• HTF Overview (4H):
• Strong bullish structure and momentum from last week.
• Price consistently printing higher highs with no signs of reversal.
• MTF Refinement (30M):
• Waiting for a clean sweep of SSL (sell-side liquidity).
• Looking for price to dip into 30M OB for continuation opportunity.
• Entry Zone:
• Watch 30M OB — once price sweeps liquidity and confirms, execute long.
• Targets:
• Structure highs / previous weekly highs.
• Mindset Note:
• Simple execution plan — ride the trend, trust the structure.
• Wait for confirmation before switching from analyst to trader mode.
Bless Trading!
EURUSD - Bullish Bias with Tactical Short Setup• Pair: EURUSD
• Bias: Bullish overall | Tactical short into demand
• HTF Overview (4H):
• Bullish structure confirmed.
• Price took out SSL liquidity — likely draw is internal structure OB below.
• Expecting deeper pullback before continuation.
• MTF Refinement (30M):
• Looking for price to sell off into 4H OB.
• Price already mitigated 30M OB and rejected — watching for follow-through.
• LTF Confirmation (5M):
• Still in analysis mode — waiting on a CHoCH from 5M OB.
• Green lines on chart reflect 5M internal structure.
• Entry Zone:
• Enter short only after 5M shift confirms.
• Ride short into 4H OB demand zone.
• Targets:
• Short-term: 30M lows.
• Major: 4H OB for bullish reaction.
• Mindset Note:
• No rush to enter — analysis leads, execution follows.
• Let price deliver confirmation before switching to trader mode.
Bless Trading!

GBPUSD - Bullish Bias with Tactical Short Setup• Pair: GBPUSD (GU)
• Bias: Bullish overall | Tactical short for OB mitigation
• HTF Overview (4H):
• Price broke major highs — clear bullish intent.
• Pullback last week suggests price is targeting 4H SSL for liquidity + OB mitigation before further upside.
• MTF Refinement (30M):
• Price structure currently presents a temporary sell bias.
• BSL has been taken — confirming liquidity sweep.
• Eyeing price to run lower into 4H OB zone.
• LTF Confirmation (5M/1M):
• Waiting on LTF confirmation to ride the move down into the 4H OB.
•Only entering after analysis is complete and CHoCH shows cleanly.
• Entry Zone:
• Tactical short after LTF confirms.
• Final long setup expected from 4H OB after mitigation.
• Targets:
• 30M lows as short-term target.
• 4H OB as the major zone for potential bullish reversal.
• Mindset Note:
• It’s analysis before execution.
• Staying in sync with HTF logic while sniping intraday plays for precision entries.
Bless Trading!

USDJPY - Bullish Structure in Play• Pair: USDJPY (UJ) • Bias: Bullish • HTF Overview (4H): • Clean external break to the upside confirms bull control heading into the new week. • Structure shift is undeniable — market bias is now favoring continued strength.
• MTF Refinement (30M): • Zoomed in to the 30M and identified internal liquidity (SSL) taken out. • Strong mitigation of internal OB followed. • Still in analysis mode — no trades taken yet.
• LTF Confirmation (5M): • Waiting on a refined CHoCH (marked by green lines at highs). • Once that prints and rules align, I’ll shift into trader mode for the execution.
• Entry Zone: • 30M OB mitigation + LTF (5M) CHoCH confirmation.
• Mindset Note: • Patience is the play. No guessing, no hesitation — just clean reads and precision strikes. • Analysis first, execution second. That’s the system.
Bless Trading!
