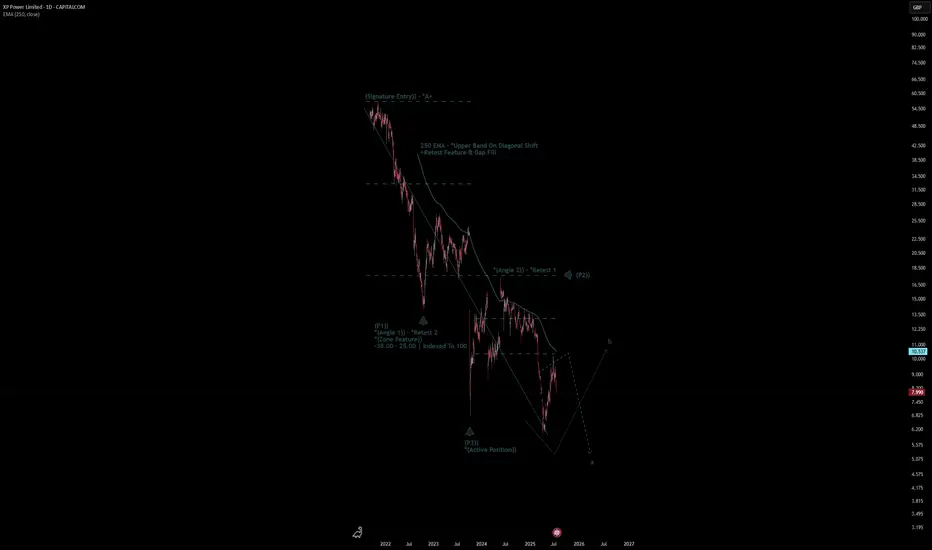
XP Power Limited Quote | Chart & Forecast SummaryKey Indicators On Trade Set Up In General
1. Push Set Up
2. Range Set Up
3. Break & Retest Set Up
Notes On Session
# XP Power Limited Quote
- Double Formation
* (Signature Entry)) - *A+ | Completed Survey
* (Angle 2)) - *Retest 1 | Subdivision 1
- Triple Formation
* (P1)) / (P2)) & (P3)) | Subdivision 2
* (TP1) = a / Long Consecutive Range
* (TP2) = b / Short Consecutive Pullback | Subdivision 3
* Daily Time Frame | Trend Settings Condition
- (Hypothesis On Entry Bias)) | Indexed To 100
- Position On A 1.5RR
* Stop Loss At 20.00 GBP
* Entry At 15.00 GBP
* Take Profit At 5.00 GBP
* (Downtrend Argument)) & No Pattern Confirmation
- Continuation Pattern | Not Valid
- Reversal Pattern | Not Valid
* Ongoing Entry & (Neutral Area))
Active Sessions On Relevant Range & Elemented Probabilities;
European-Session(Upwards) - East Coast-Session(Downwards) - Asian-Session(Ranging)
Conclusion | Trade Plan Execution & Risk Management On Demand;
Overall Consensus | Sell
Pivot Points
SEI vs Ethereum: Why Investors Are Betting on Accelerated GrowthBlockchain Market Enters a Phase of Differentiation
Following the overall recovery of the crypto market in Q2 2025, certain Layer 1 projects are attracting increased attention. One such emerging player suddenly in the spotlight is the SEI blockchain, which positions itself as a high-performance solution for trading, DeFi, and Web3 applications. While Ethereum continues to struggle with scalability issues and competition from its own Layer 2 solutions, SEI bulls claim:
“This is the project that can outpace ETH in growth rate as early as Q3.”
What Makes SEI Technologically Different?
Investor optimism around SEI is rooted not just in marketing, but in specific technological advantages. Unlike Ethereum, which prioritizes maximum decentralization even at the expense of speed, SEI leverages a parallelized transaction processing engine, achieving finality in under 500ms. This not only accelerates transaction processing but also scales the performance of order books and marketplaces.
Additionally, SEI has implemented an order-based DEX model, bringing decentralized exchanges closer to the user experience of centralized platforms like Binance. This is a key differentiator: unlike Ethereum, which requires additional protocols to implement limit orders, SEI has them built into its architecture.
Ecosystem and Activity
Since the beginning of the year, more than 80 applications have launched on SEI, ranging from NFT marketplaces to derivatives platforms. According to DeFiLlama, TVL (total value locked) has surpassed $1.2 billion, more than 5x its level at the start of the year. Major exchanges like Binance, KuCoin, and Bybit have confirmed support for the blockchain, while the project team actively expands into Asia and Latin America.
Investor Dynamics and Price Expectations
SEI entered Q3 2025 trading around $0.34, and analysts see growth potential up to $0.70–$0.80 if the positive trend continues. This represents over 100% upside from current levels, whereas Ethereum, according to most forecasts, is expected to post only 15–20% gains during the same period.
Some institutional reports already classify SEI as a high-growth potential asset, alongside Solana and Aptos. This signals a possible market shift in the coming months.
Risks: Realism Over Hype
However, key risks remain:
Competition from Ethereum L2: Solutions like Arbitrum and Base deliver high speed while maintaining ETH compatibility.
Hype Cyclicality: Surges in interest for new Layer 1s can be short-lived.
Dependence on DeFi: SEI is currently attractive for developers and traders but still lacks everyday applications.
Conclusion
SEI indeed has technological advantages that enable rapid scaling. Its architecture makes it especially promising in the context of growing DEX and Web3 adoption. While Ethereum remains the leader in terms of infrastructure and trust, SEI could outpace ETH in growth rate during Q3 2025, particularly if it sustains its expansion and avoids technical or market setbacks.

BTC Ready for the new impulse ? Elliott wave analysis 20/7/2025In my view, Bitcoin (BTC) has completed its micro correction and is now poised to move toward the $135,000–$139,000 target zone. This expectation is supported by the following factors:
1. Completion of the Sub-Waves in Wave (4)
My analysis of wave (4) indicates that it consists of an ABC correction, where wave B formed a WXYXZ pattern.
Additionally, I have counted the sub-waves within wave C of wave (4) and observed a complete 5-wave structure, suggesting that the fifth wave of wave C has ended, confirming the completion of wave (4).
2. Cypher Harmonic Pattern Pivot Point
I have identified a Cypher harmonic pattern with a pivot point around $116,600.
The termination of wave (4) occurred close to this pivot level, followed by a new impulsive move that made a higher high and formed a clear 5-wave structure—further confirming that wave (4) has likely ended.
3. Hidden Bullish Divergence on the 4-Hour Timeframe
A hidden bullish divergence can be observed on the 4-hour chart, particularly at the end of wave (a) and wave (c).
Historically, 4-hour hidden bullish divergences have often preceded strong bullish impulses. For instance, a similar setup occurred during the bullish rally from April 9, 2025, to May 22, 2025.
4. Failure to Make a New Low After Resistance Retest
The new impulse wave that emerged after the end of wave (4) has met resistance but failed to make a new low, suggesting that a fresh upward impulse is underway.
How Far Could Wave (5) Extend?
It is important to note that the wave (5) (blue) impulse is a sub-wave of wave (5) (purple).
The lengths of wave (3) (purple) and wave (5) (purple) are currently similar, which is unlikely because both are part of the major wave V (green), where typically only one wave should extend.
Since wave (3) has already completed, wave (5) is likely to be the extended wave, with a target length between 1.272 and 1.618 times the length of wave (3).
Interestingly, two Gann fan projections point to resistance levels in the $135,000–$139,000 range, which perfectly aligns with this 1.272–1.618 extension zone.
Invalidation Point
The invalidation level is around $117,000, as the micro correction within the new impulse should not drop this low.
If BTC falls below $117,000, it could imply that wave (4) has not yet completed and may be taking another corrective form.
For example, the wave (c) we currently see might only be wave 1 of a larger wave (c), or the correction in wave (b) may still be ongoing.
However, this scenario seems unlikely given the weight of evidence suggesting that wave (4) has already ended.

COTI Analysis (1D)The price is breaking out of an important trendline and is also reclaiming a key support zone.
⚠️ Make sure to wait for a daily candle to close above the trendline and the key level, and then enter a position on the pullback.
Targets are marked on the chart.
A daily candle close below the invalidation level will invalidate this analysis.
For risk management, please don't forget stop loss and capital management
Comment if you have any questions
Thank You

$1 in the Horizon for $DOGE!We’ve got something interesting brewing on CRYPTOCAP:DOGE right now:
Monthly trend is active
Uptrend in place for over a year (not relying on that timeline, but historically, targets hit within it)
If we can get above $0.30 and hold, the path to $1 opens up for the first time.
Other similar charts are also aligning for exponential moves, setting up to break out of multi-year consolidation patterns.
Keep a close eye on CRYPTOCAP:XLM as well — it’s shaping up with a very similar structure.

DGKC LongCurrently the trendline and previous resistance level (173 - 179) are stopping it from going upward.
Fib 0.618 level is also near (184) which will be again a major hurdle before it goes further up towards 223 and 273.
However, RSI, MACD and Stoch are fine that suggest no extreme pressure for the price to go downwards yet.

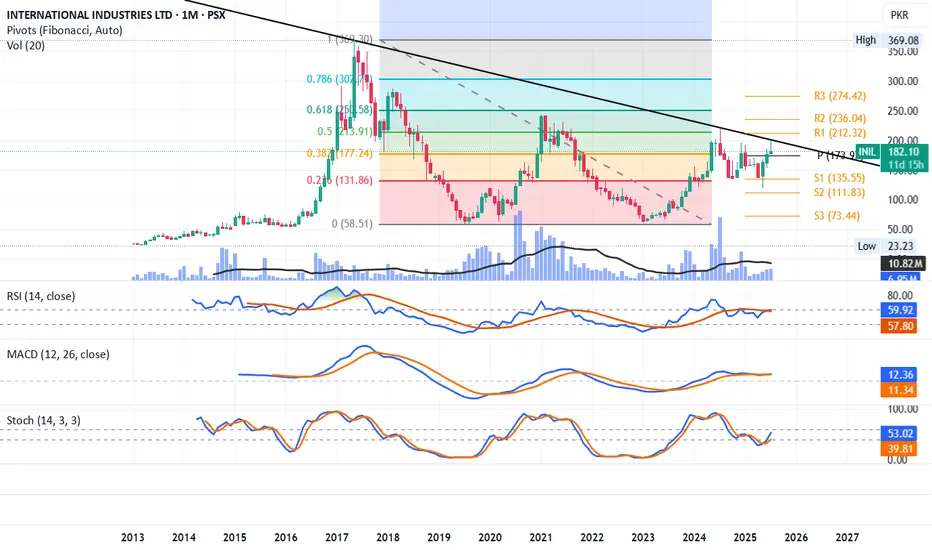
INIL LongRSI, MACD and Stoch, all are giving buy signal.
INIL has tested its monthly support 1 twice, forming a small W which is a bullish pattern.
It is trending above its monthly pivot (174).
Currently, the trendline is stopping it and breaking it will not only make it retest its R1 (212) but also 250 (R2) soon.
Volumes are not supporting though but once it breaks the trendline, we may witness volumes as well.
Its my personal opinion, not a buy / sell call.
UBDL LongA nice cup and handle formation in place. UBDL is trending above monthly pivot. RSI, MACD and Stoch all are giving buy signal and increasing volumes are also indicating the same.
Its a reversal stock and may move slowly.
Further targets are 32, 46, 57, 69, 85 and then 105 (its all-time high).
Once it reaches there, 200 can be up for the grabs, but it may take 2-3 years of patient holding.
Its not a buy / sell call, just my personal opinion.

FET Secondary trend 19 07 2025Logarithm. Time frame 1 week for clarity.
Main trend is an ascending channel.
Secondary trend is a descending channel
Local trend is a Ross hook, at the median resistance. Reversal zone.
By the way, the trading idea from 2022 FET/BTC is still relevant. Pay attention to where the price is.
FET/BTC Main trend. Pump zone cycles . 2022 06

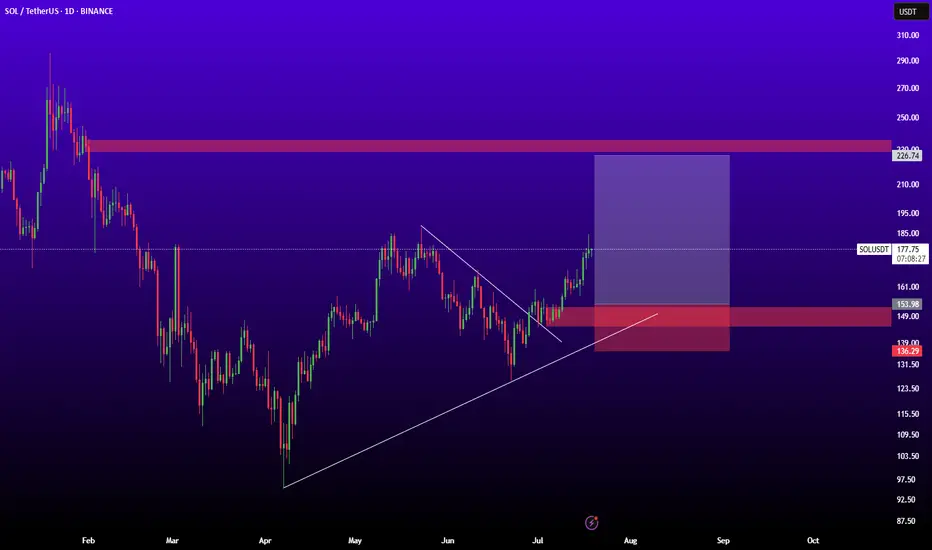
SOLUSDTThis signal for bull-trend because breaked trendline and higher high higher low.
best entry: 154
stop: 136
traget: 226
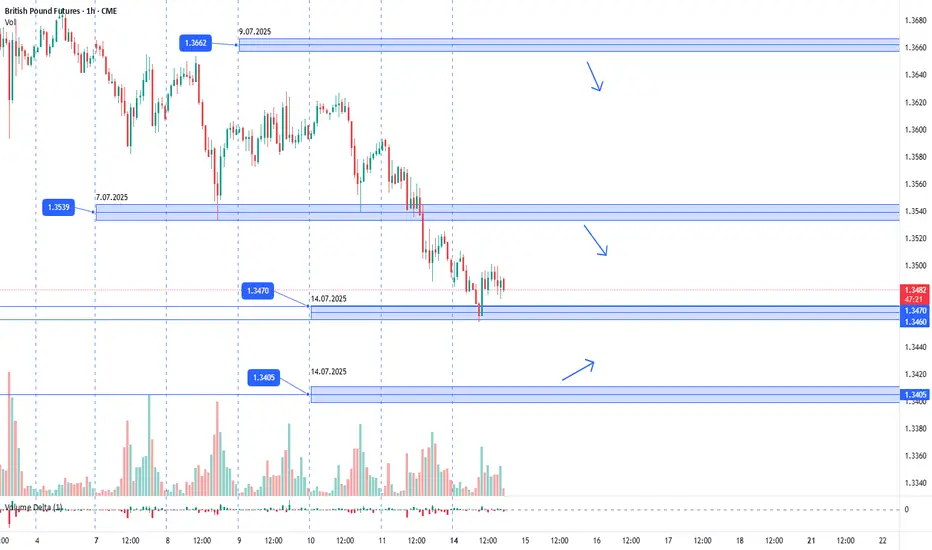
GBPUSD. 14.07.2025. The plan for the next few days.The nearest interesting resistance zone was already worked out in the morning and gave a good reaction. Let's mark the others where we can expect a reaction. It's not certain that there will be a major reversal, but I think we'll see a correction that can be monetized. We're waiting for a reaction and looking for an entry point.
The post will be adjusted based on any changes.
Don't forget to click on the Rocket! =)
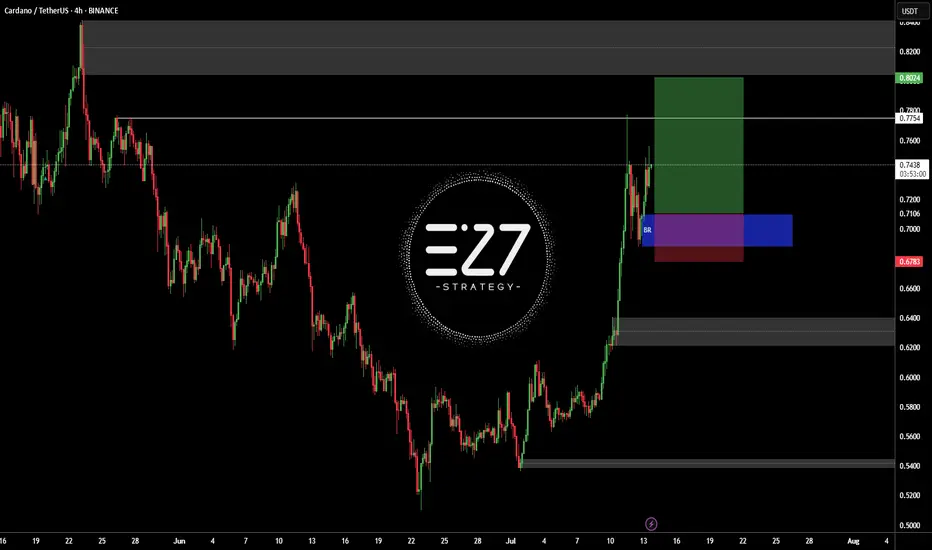
ADAUSDTBINANCE:ADAUSDT in up-trend and my open position buy in latest sowing low.
Best entry: 0.6952 - 0.7259
Target: 0.7754 - 0.8024
Stop loss: 0.678
Please control RISK management
ETHUSDTThis movement downtrend. If breake 2.790 movr to 3.500$ but breke 2.200 move trend to 1.500$.

MASKUSDT - SELLERS ARE IN CONTROLChart shows interesting pumps and dumps, but buyers still haven’t stepped in. The strongest selling area is marked with a black box where sellers remain in control.
Watching how price reacts if it returns there: if sellers stay strong, no trade; if we see footprint absorption + CDV divergence + structure reclaim, it may offer a reversal setup.

$NEAR Local Still looks corrective..Though the CBOE:NEAR weekly looks good the same pattern on NEAR that I have highlighted here was also found on NYSE:FET and EURONEXT:RNDR local charts that has held these coins back from moving compared to others and appears corrective in nature and they all end at the daily 200EMA on bearish divergence.
Just something to look out for. A rejection in alts now could see fresh lows
Safe trading

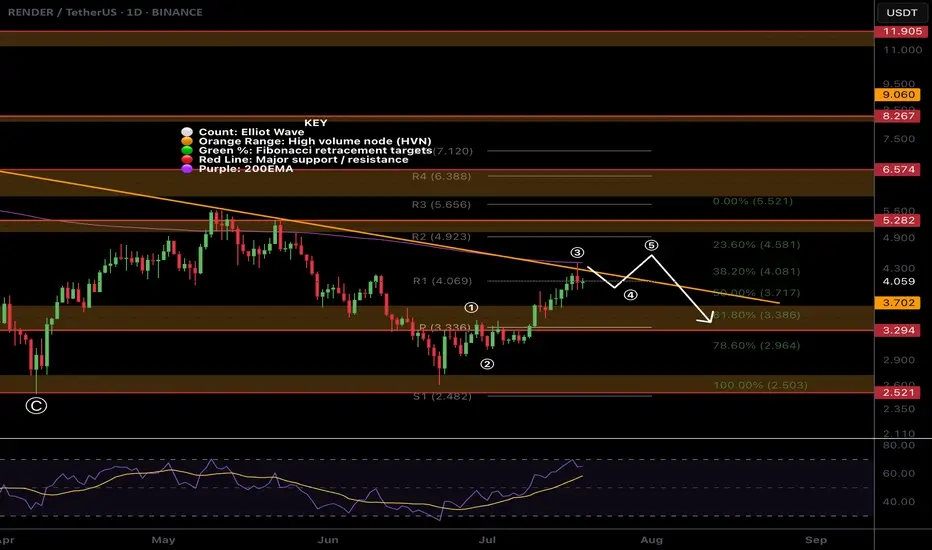
$RENDER At Major Resistance!CRYPTOCAP:RENDER has been relatively weak. Looking at the local chart it appears we have finished a wave (3) at the daily 200EMA and descending resistance.
Price has overcome the High Volume Node (HVN) support flipped resistance but a strong at coin pull could see fresh lows for Render.
There is also daily bearish divergence on the RSI.
The Elliot Wave count could also be an ABC corrective wave up which has now terminated.
If its a new motif wave and a major bottom has formed , wave 2 should find support at the HVN, daily pivot and 'alt-coin' golden pocket between 0.168 and 0.782 Fibonacci retracement
Safe trading
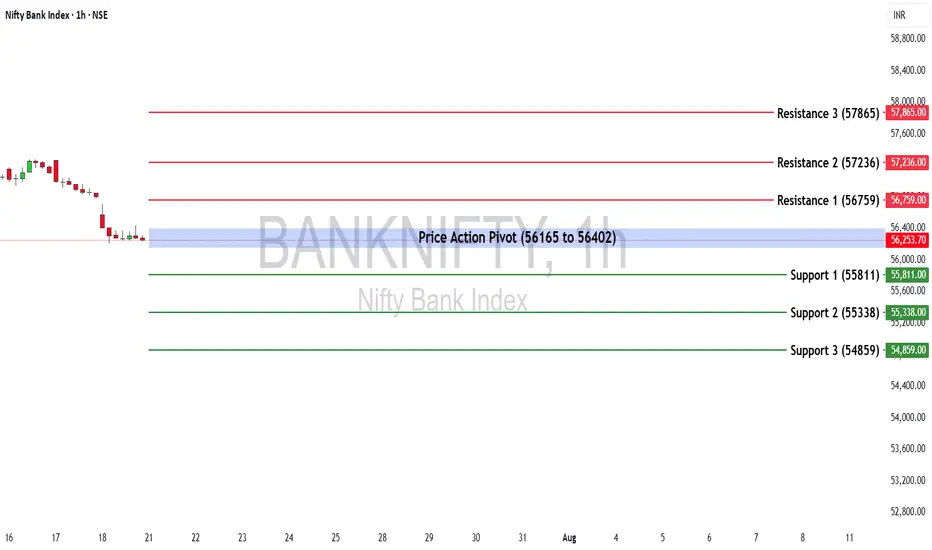
Bank Nifty Weekly Insights: Key Levels & TrendsBank Nifty ended the week at 56,283.00, registering a marginal decline of -0.83%.
🔹 Key Levels for the Upcoming Week
📌 Price Action Pivot Zone:
The critical zone to monitor for potential trend reversals or continuation lies between 56,165 and 56,402.
🔻 Support Levels:
Support 1 (S1): 55,811
Support 2 (S2): 55,338
Support 3 (S3): 54,859
🔺 Resistance Levels:
Resistance 1 (R1): 56,759
Resistance 2 (R2): 57,236
Resistance 3 (R3): 57,865
📈 Market Outlook
✅ Bullish Scenario:
If Bank Nifty sustains above the pivot zone (56,402), it may trigger renewed buying interest, potentially pushing the index toward R1 (56,759) and higher levels like R2 (57,236) and R3 (57,865).
❌ Bearish Scenario:
A breakdown below the lower end of the pivot zone at 56,165 may attract selling pressure, dragging the index towards S1 (55,811) and possibly lower levels like S2 (55,338) and S3 (54,859).
Disclaimer: lnkd.in
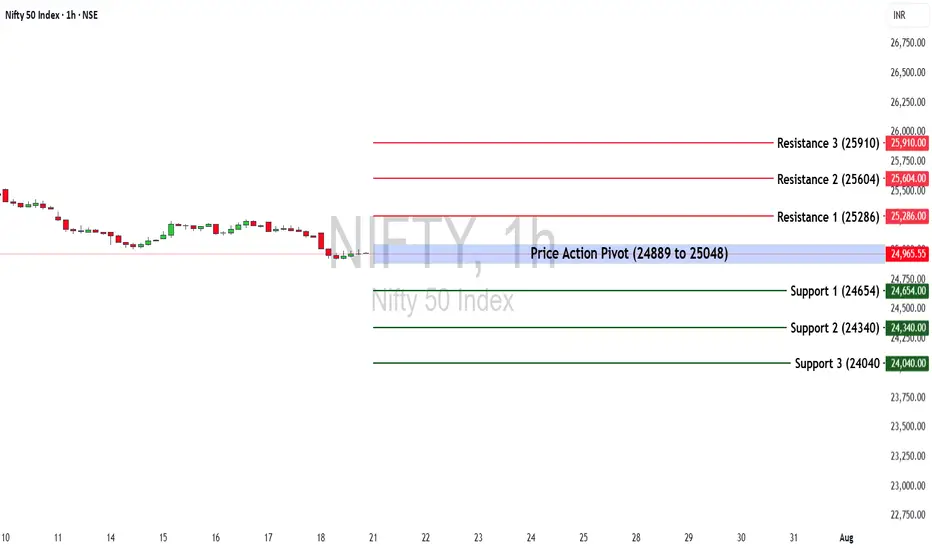
Nifty 50 at a Turning Point? Key Levels & Market Outlook AheadThe Nifty 50 ended the week at 25,149.85, posting a loss of -1.22%.
🔹 Key Levels for the Upcoming Week
📌 Price Action Pivot Zone:
24,889 to 25,048 – This is a crucial range to monitor for potential trend reversals or continuation. A breakout or breakdown from this zone can set the tone for the week.
🔻 Support Levels:
S1: 24,654
S2: 24,340
S3: 24,040
🔺 Resistance Levels:
R1: 25,286
R2: 25,604
R3: 25,910
📈 Market Outlook
✅ Bullish Scenario:
A sustained move above 25,048 (top of the pivot zone) may invite buying interest. If momentum continues, the index could test R1 (25,286) and possibly extend towards R2 (25,604) and R3 (25,910).
❌ Bearish Scenario:
Failure to hold the pivot zone and a breakdown below 24,889 could trigger further downside. The index may slide towards S1 (24,654) and deeper supports at S2 (24,340) and S3 (24,040).
Disclaimer: lnkd.in
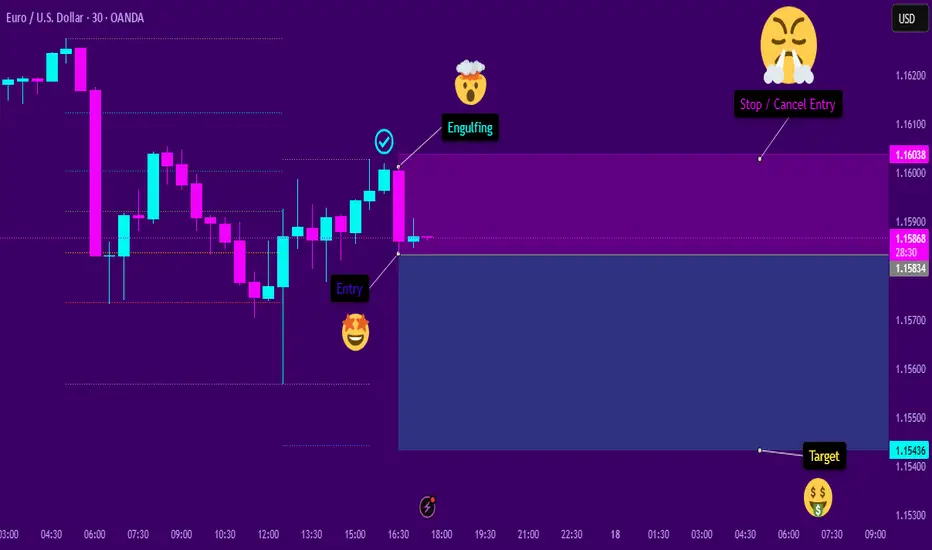
Engulfing SellThe asset shows signs of continuation in a downtrend. After a significant retracement at a favorable Fibonacci level, a bearish engulfing pattern appeared. This engulfing pattern resulted in a behavioral shift, causing the temporary pullback to resume its decline. I believe this will be the case, provided that the subsequent candlesticks confirm the entry signal.
ATM_GS : We are nearing...
#EURUSD: Last Bullish Price Extension! Get Ready! EURUSD is approaching our buying zone, a key level, which suggests a smooth bullish reversal. As this is a swing trade, we advise keeping stop losses larger. There are two targets to keep an eye on. Remember, this is not a guaranteed move, and this is just our overview. Good luck and trade safely.
Team Setupsfx_
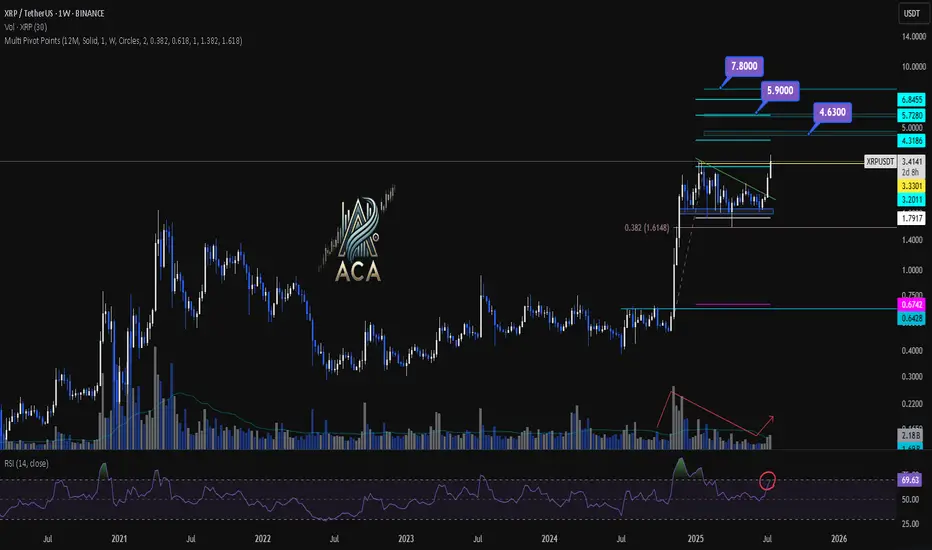
XRPUSDT Weekly Chart Analysis | Next Bullish MoveXRPUSDT Weekly Chart Analysis | Major Resistance Levels Align for Next Bullish Move
🔍 Let’s break down the XRP/USDT weekly setup, highlighting key technical signals and major upside targets for the next rally.
⏳ Weekly Overview
The weekly chart shows consolidation just below a major resistance, with price action tightening and preparing for a breakout. A recent correction found support near the 0.382 Fibonacci retracement level, which has acted as a springboard for renewed momentum. Notably, the R2 pivot point level aligns closely with this area, strengthening its importance as a decision zone for bulls.
🔺 Upside Targets & Confluences:
- First Target: $4.63 — This coincides with the R2 monthly pivot point and aligns with key Fibonacci extension targets, offering strong confluence for a reaction zone.
- Second Target: $5.90 — Our most realistic medium-term target, also backed by cluster resistance from both pivot analysis and fib projections.
- Final Target: $7.80 — This is the major Fibonacci extension level, marking the highest projected upside if momentum persists.
📊 Key Technical Highlights:
- Pivot Point R2 & Fibonacci Confluence: The R2 level reinforces a critical resistance, overlapping with the $4.63 Fibonacci target.
- Fibonacci Retracement: Price respected the 0.382 retracement during the latest correction, signaling healthy trend continuation.
- Volume Confirmation: An uptick in volume confirms that buyers are stepping in, supporting the bullish momentum.
- RSI Signal: RSI is entering the overbought zone, which typically indicates a strong surge in buying pressure and can mark the start of a momentum move.
🚨 Conclusion:
XRP is setting up for a major breakout as key technical levels align. Watch for a sustained move above $4.63 to unlock the $5.90 area, with a final potential push towards $7.80 if bulls maintain control. Volume expansion and an overheated RSI are both classic signs of an incoming momentum wave—keep your eyes on these levels for validation of the setup.
Double Top + Zigzag Complete: Are Bears About to Take Over Gold?Yesterday, the financial markets in general, including Gold ( OANDA:XAUUSD ) , acted like a roller coaster after the news of Powell's dismissal . After this news was denied , Gold returned to its main trend, which I published in my previous idea .
Gold is currently re-attacking the Support line , Support zone($3,326-$3,325) and 50_SMA(Daily) .
In terms of classic technical analysis , it seems that gold has formed a Double Top Pattern for support breakdowns, where a Support line breakdown can also be accompanied by a neckline breakdown .
From the perspective of Elliott Wave theory , it seems that Gold has managed to complete the Zigzag Correction(ABC/5-3-5) , and we should wait for the next bearish waves .
I expect Gold to break its supports and move towards $3,290 ; support breaks are best done with high momentum . An important price that can change the direction of Gold's downside is $3,350 .
Note: If Gold breaks the Resistance lines and forms an hourly candle above $3,351(Stop Loss (SL)), we can expect further Gold gains.
Gold Analyze (XAUUSD), 2-hour time frame.
Be sure to follow the updated ideas.
Do not forget to put a Stop loss for your positions (For every position you want to open).
Please follow your strategy; this is just my idea, and I will gladly see your ideas in this post.
Please do not forget the ✅ ' like ' ✅ button 🙏😊 & Share it with your friends; thanks, and Trade safe.

$ETH Ethereum Market Outlook – July 2025Ethereum Market Outlook – July 2025
Brought to you by ProfessorXtrader
🚀 Ethereum Breakout Confirms Multi-Year Bullish Setup
Ethereum ( CRYPTOCAP:ETH ) has officially broken out of a multi-year consolidation range, signaling a strong bullish cycle ahead. With the current price sitting at $3,645.50, ETH has posted a remarkable 46.65% monthly gain as of July 18, 2025.
This move sets the stage for a multi-tiered upside potential — here’s what the chart is telling us.
📊 Key Levels & Targets
🔸 Previous Consolidation Range (2018–2021)
ETH spent over three years capped under the ~$4,884 level, forming a solid accumulation base.
🔸 Breakout Zone
Support: $1,150 – $1,250
Confirmation of Cycle Shift: Price now trading well above breakout zone.
🎯 Upside Targets (Ethereum)
1st Target:
📍 Price: $7,387.56
📈 Potential Gain: ~100%+ from breakout zone
2nd Target:
📍 Price: $11,394.14
📈 Potential Gain: ~180%
Final Exit (Major Reversal Zone):
📍 Price Range: $15,443.81 – $15,477.64
🚨 Total Gain Potential: ~280% from breakout
📌 The area between $15.4K to $18K is marked as the Major Reversal Zone, a region where profit-taking and trend exhaustion are highly likely.
📈 Market Interpretation
Bullish Breakout: Long-term resistance is now support.
Volume & Momentum: Strong monthly candle with expanding volatility confirms conviction.
Structure: Targets are based on clean technical projections, Fibonacci expansions, and market psychology.
🔔 What to Watch Next
📅 Monthly Close above current levels will confirm the breakout.
🔍 Monitor for rejection signals near the first target.
📉 Place trailing stops as we approach the major reversal zone.
💡 Pro Tip from ProfessorXtrader
"The biggest profits in crypto are made during clean breakouts from multi-year ranges. ETH is entering that phase now — plan your targets and protect your capital as you climb."
