US30 Holds Above 44500 – Bullish Momentum in PlayUS30 | Technical Overview
The price action continues to reflect a bullish bias, supported by strong earnings reports and solid U.S. economic data. As long as the index trades above 44500, the upward momentum is expected to continue.
Technical Outlook:
Price remains bullish above 44500, with upside targets at 44640 and 44760.
A confirmed 1H close below 44500 would shift momentum to the downside, exposing support levels at 44350 and 44215.
Key Levels:
• Pivot: 44500
• Resistance: 44640 / 44760 / 44920
• Support: 44350 / 44215 / 44075
Pivot Points

SPX500 Eyes Further Upside After Breaking to New HighSPX500 | Technical Overview
The price continued its bullish momentum after stabilizing above the 6283 support level, as anticipated. It has since posted a new all-time high (ATH) and is currently aiming for the next key resistance at 6341. A confirmed breakout above this level may open the path toward 6393.
On the downside, a break and sustained close below 6283 would shift the structure bearish in the short term, potentially targeting 6223.
Pivot line: 6283
Resistance: 6341 – 6393
Support: 6247 – 6223
previous idea:

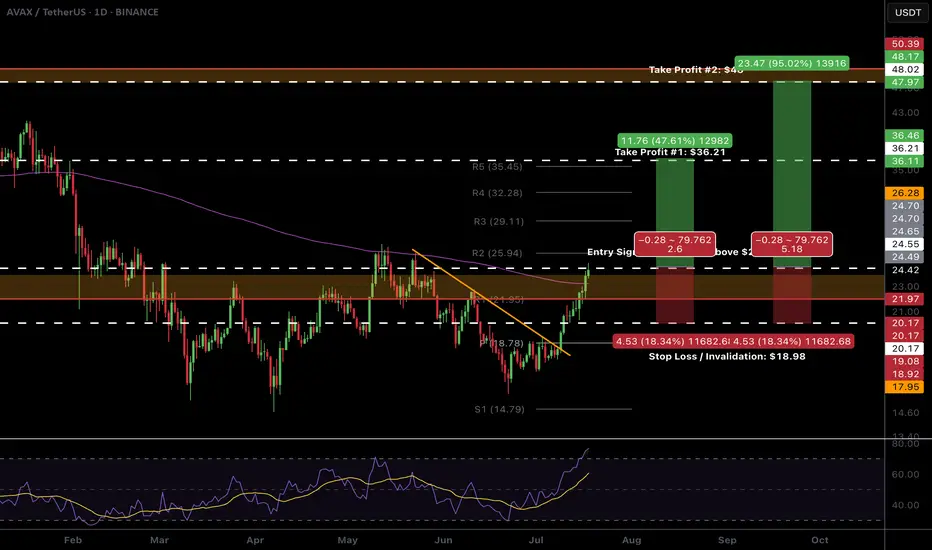
$AVAX Ready to breakout!CRYPTOCAP:AVAX looks ready to pop.
High Volume Node resistance and daily 200EMA is clear and now support. We don't want to see price rejected and moving back below this area.
The R5 daily pivot is my first partial take profit $35-36 followed by the major resistance High Volume Node at $48
Daily RSI is overbought with unconfirmed bearish divergence so watch out for this but should be good to run in the mean time. BTC permitting...
Safe trading
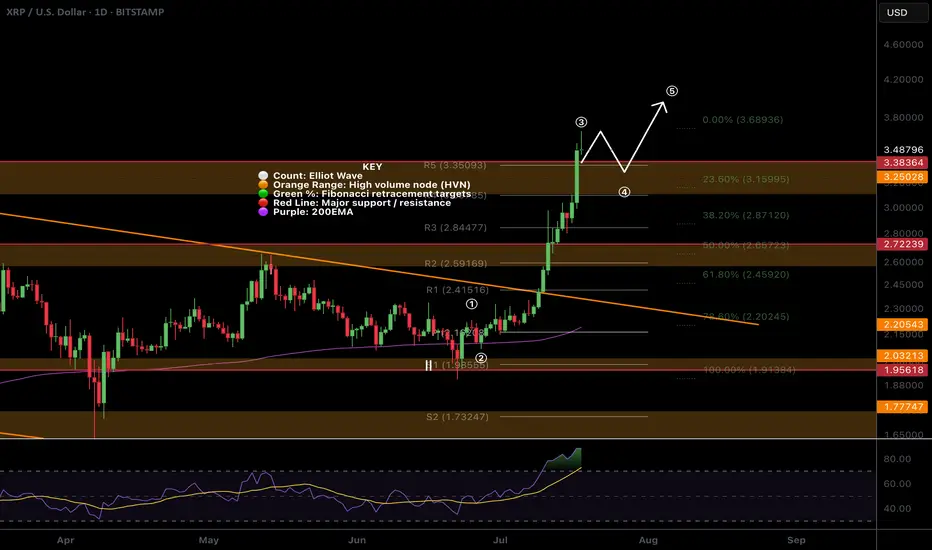
$XRP All time high! Time to sell or...?CRYPTOCAP:XRP appear to have completed wave 3 with a poke above all time high, typically this os behaviour of a wave 5.
The daily R5 pivot point has been breached so there is a significant chance of a decent pullback now but I wouldn't bet against the trend!
Wave 4 could be shallow, targeting the previous all time high, High Volume Node with waver 5 completing near $4.
Daily RSI is overbought but no bearish divergence yet which will likely emerge during wave 5.
Safe trading
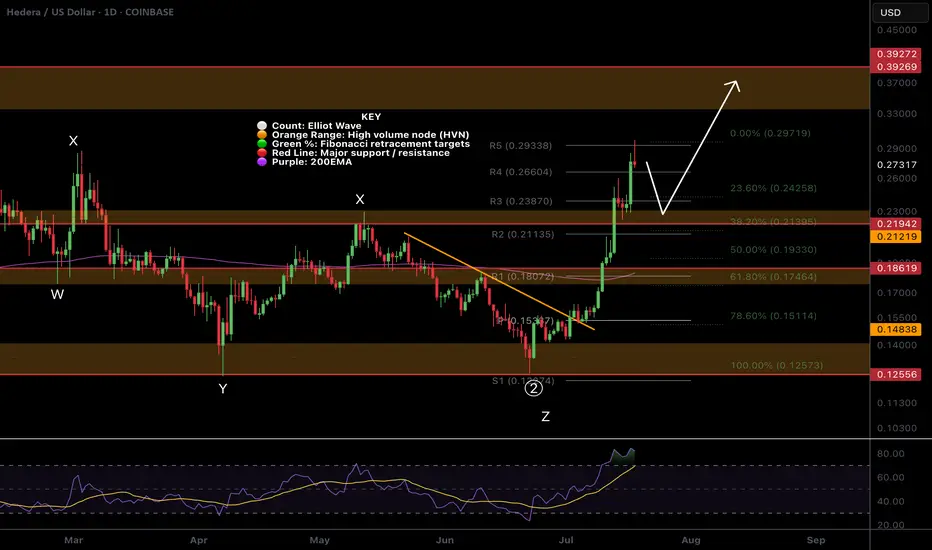
$HBAR Pull Back Started, What is the target?CRYPTOCAP:HBAR doing extremely well, the R5 daily pivot point has been hit and a pull back should be expected before continuation!
It appears wave 3 is now complete and wav4 i expected to pull back to the 0.382 Fibonacci retracement which adds confluence to the High Volume Node in the same place at $0.22 our previous take profit #2 target.
Daily RSI is overbought but no bearish divergence yet! Price behaviour can often pop above the swing high just made to trap new buyers before dumping hard! Watch out for that, that would be the bearish divergence print also.
The next take profit is $0.39
Safe trading
BullsA new all time high 3500 is on the horizon. We have been on a trendline(1 Day) resistance region. A buy towards the target is the goal.
NB break below invalidates this analysis

NCN (Neurochain AI) Main Trend 18 07 2025Logarithm. 3 days. Crypto project (imitation of utility) was made in autumn 2024 for local AI hype. Twitter 102 thousand subscribers. This is not enough... Reduction from the maximum pumping by -99%. It is rational to work according to the pump/dump strategy, in spot.
If a local alt season is launched, then I would recommend locally - medium urgently working with the % range (maximum) specified in the idea itself. This crypto imitation of usefulness is unlikely to survive until the big AI hype....
Currently, there are trades on 2 exchanges:
1) Gate
2) MEXC
For this group of assets as a whole. Collect assets where AI is at least somehow actually used (there are none of those), or are simply mentioned for hype (imitation of usefulness). Some assets will "die", most, if you hold them, will show a greater profit than assets of other groups.

Ball Corporation Quote | Chart & Forecast SummaryKey Indicators On Trade Set Up In General
1. Push Set Up
2. Range Set Up
3. Break & Retest Set Up
Notes On Session
# Ball Corporation Quote
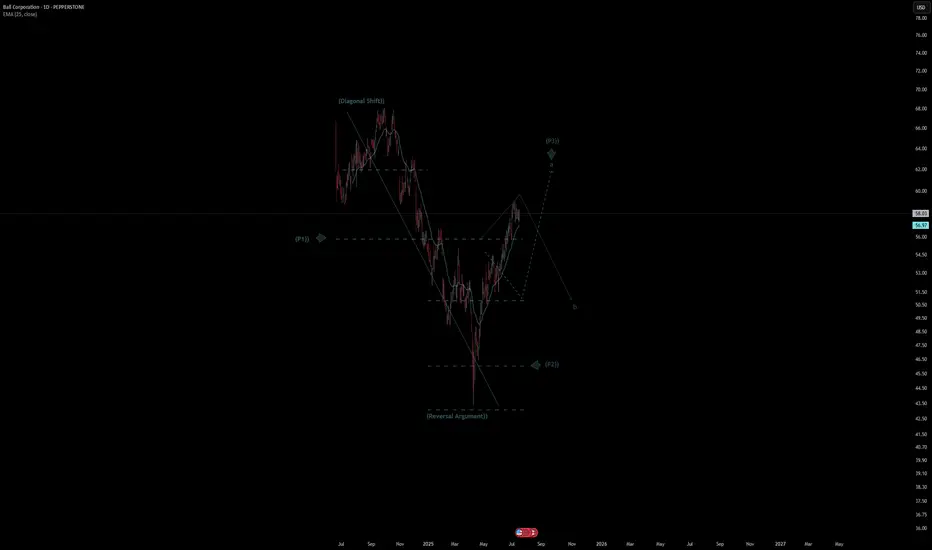
- Double Formation
* (Diagonal Shift)) At 67.00 USD | Completed Survey
* (Reversal Argument)) - *Fractional Spike | Subdivision 1
- Triple Formation
* (P1)) / (P2)) & (P3)) | Subdivision 2
* (TP1) = a / Long Consecutive Range
* (TP2) = b / Short Consecutive Pullback | Subdivision 3
* Daily Time Frame | Trend Settings Condition
- (Hypothesis On Entry Bias)) | Regular Settings
- Position On A 1.5RR
* Stop Loss At 53.00 USD
* Entry At 58.00 USD
* Take Profit At 65.00 USD
* (Uptrend Argument)) & No Pattern Confirmation
- Continuation Pattern | Not Valid
- Reversal Pattern | Not Valid
* Ongoing Entry & (Neutral Area))
Active Sessions On Relevant Range & Elemented Probabilities;
European-Session(Upwards) - East Coast-Session(Downwards) - Asian-Session(Ranging)
Conclusion | Trade Plan Execution & Risk Management On Demand;
Overall Consensus | Buy
OFFICIAL TRUMP Main trend. 16 05 2025Logarithm. Time frame 3 days. After a super pump and a drive of "stupid money", a descending channel was formed on a natural dump. The price came out of it. Now a triangle is forming. The price is clamped. The reversal zones and percentages to the key support/resistance levels are shown extremely accurately according to TA.
If there is no aggressive exit in the medium term, then there will be consolidation and, as a consequence, the formation of a horizontal channel "sholtai / chattai", its key zones are shown.
Now, this "cryptocurrency" is now on 16 05 2025 in 41st place by capitalization.
Reductions from the price highs are about -90%.
From the liquid zone about -84%.
These are not the minimum values of the decline of such hype cryptocurrencies. Just take this into account in your money management. For clarity, the level zones and the % of potential decline if the trend breaks again are shown on the chart (pull the chart down).
Even with such a decline, the price is now at a huge profit. I am not speaking for the creators of the cryptocurrency, but for the first speculators and "investors" who may not have sold everything on the hype.
For the creators of the cryptocurrency, perhaps these are manipulators close to the Trump family, for them, any sale is super profit. But in order to sell, you need to maintain liquidity, and from time to time make interest in speculation and asset retention by investors, that is, do pumps and hype. Use this, and do not be greedy...
Levels and zones, pump/dump, which the price will "feel" are shown in advance. Click "play" on the chart and move the chart up. With a high degree of probability, the hype and pumping of the price of this cryptocurrency will be repeated, given the hype and the long term of the political figure whose name this cryptocurrency bears. Now it is a Trump dump, in the future it will become a Trump pump for some time.
Do not forget to sell on the next hype. If you understand that you are very greedy, and the news background affects you, then sell in parts, or use stop losses to protect profits.
There is no need to guess the minimums and maximums. It is important to know these zones, and have an acceptable average price, from the position of the trend, and its potential. It is regulated by the distributed entry volume (in advance) at potential reversal zones.

This is my main template for Futures and ForexThis is my main template for Futures and Forex! It is optimized specially for the strategy "Momentum Mastery".
It includes all the necessary tools and indicators needed for the strat.
All setings are READY!!!
MELANIA Main Trend. Memes with high hype and risk. July 17, 2025Main trend. Time frame 3 days (less is not necessary). Showed conditional levels (zones near them), and percentages of decrease from the maximum (note, I showed from the zone where the main retail of “affected investors” began to connect, that is, the maximum is much lower than on the chart).
Note that now a conditionally large volume “enters”, it is displayed on the price chart (this is important), a sideways squeeze has begun. Local impulse and rollback are now in the moment.
Also showed a large % (intentionally) for orientation, from minimum to maximum zones. On such hype assets, as a rule, medium-term - long-term holding (bought in the right zone) shows significant income.
All level zones are conditional, due to liquidity, but the price will most likely “play” after the breakdown of the downward trend in this range, another alt season (which many do not notice due to the slow breakdown of their opinions, news chaff, and inadequate goals). As for me, above these huge % (resistance zone, or up to 0.869, so as not to waste time), you should get rid of this meme, or its % from the previous position should already be minimal (5-10%).
There are hype zones, there are zones of potential gain (fading hype, interest, and a large % from the maximums). On such assets of "manual trading", where cryptocurrency has no value, it is always sold little by little (many do not understand this), but in order to sell, you sometimes need to make interest, and "instill hope" in previously deceived "investors" who want to get out at least at a loss (it is unlikely to happen). At the right time, 1-2 tweets - statements from the "powers that be" - are pumped up due to low liquidity by a huge percentage.
On such cryptocurrencies, you do not need to guess the “bottom” or maximums. Pricing is formed differently here, as there is no real supply/demand, utility, but only psychology and "hitting the jackpot" of gambling addicts. Be smarter. Diversify such assets, distribute the risk in advance. Make purchases/sales according to plan, without emotions.
When the price goes up, you think it will go much higher, but even if it does, you must sell a certain volume in certain planned zones, without any emotions or sense of lost profit.
Similarly, when the price goes down, people are driven by fear and refuse to buy, and these were probably the minimums of fear.
The average price of the set and reset is important. No minimums and maximums are needed. Be patient and consistent in your actions and plans.

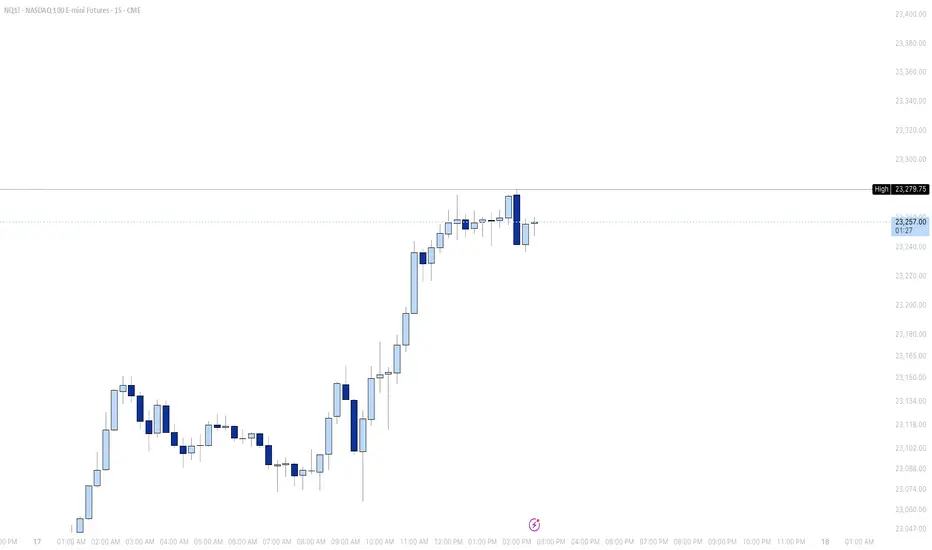
$NQ Supply and Demand Zones - All Time High! 7/17/25This chart is for SEED_ALEXDRAYM_SHORTINTEREST2:NQ only.
We recently hit ATH this AM session and now price is accumulating and we are waiting to see what it wants to do next. Continue to hold support at ATH before we breakout higher, or break below and close below ATH support for a retest lower?

Nifty Analysis EOD – July 17, 2025 – Thursday🟢 Nifty Analysis EOD – July 17, 2025 – Thursday 🔴
📉 Sellers Grip Expiry Day — Big Move Loading?
Nifty started again with an OH (Open = High) formation and slipped down 94 points before 10:30 AM, marking the day’s low at 25,144. During this fall, it broke the support zone of 25,212 ~ 25,180. Although a retracement followed, it couldn’t sustain above the mean and eventually broke below the previous day’s low (PDL), closing at 25,111.45.
The weekly expiry was wild and volatile — especially from 12:30 to 2:30 PM. Interestingly, if we consider the total range of the last three sessions, it is just 166 points — well below average. This suggests a phase of consolidation. A significant move may emerge once Nifty decisively breaks the broader zone of 25,000 to 25,255.
🕯 5 Min Time Frame Chart with Intraday Levels
🕯 Daily Time Frame Chart with Intraday Levels
📊 Daily Candle Breakdown
Open: 25,230.75
High: 25,238.35
Low: 25,101.00
Close: 25,111.45
Change: −100.60 (−0.40%)
Candle structure breakdown:
Real body:
Red candle (Close < Open): 25,230.75 − 25,111.45 = 119.30 points → Decent-sized bearish body
Upper wick:
25,238.35 − 25,230.75 = 7.60 points → Very small
Lower wick:
25,111.45 − 25,101.00 = 10.45 points → Small
Interpretation:
Nifty opened slightly lower, made a weak attempt upward, then saw consistent selling throughout the day, closing near the session’s low. The negligible wicks indicate that sellers were in full control, and buyers had little room to fight back.
Candle Type:
A strong bearish candle (almost Marubozu) with very small wicks → Clear dominance by sellers.
Key Insight:
The test of the 25,100 zone again shows weakening bullish strength.
If the next session breaks below 25,100, the fall may extend toward 25,000–25,050.
For bulls to regain short-term momentum, a close above 25,200–25,220 is necessary.
🛡 5 Min Intraday Chart
⚔️ Gladiator Strategy Update
ATR: 176.62
IB Range: 60.85 → Medium IB
Market Structure: Balanced
Trades Triggered:
🕒 10:53 AM – Long Trade → Trailed SL Hit Profit (R:R = 1:0.42)
🧭 What’s Next? / Bias Direction
The market is coiling within a narrow range across multiple sessions, hinting at a potential breakout move.
📌 Watch Zone: 25,000 to 25,255
🔻 A break below 25,000 may open 24,950–24,900
🔺 A close above 25,260 could drive price toward 25,350+
Bias remains neutral-to-bearish unless bulls reclaim 25,220 decisively.
🧱 Support & Resistance Levels
Resistance Levels
25,168
25,180 ~ 25,212
25,260
25,295 ~ 25,315
Support Levels
25,125
25,080 ~ 25,060
25,000 ~ 24,980
24,965
🧠 Final Thoughts
"Structure is key. When levels work, respect them. When they break, adapt."
Three sessions of compression hint at expansion soon — stay alert and trade level-to-level with discipline.
✏️ Disclaimer
This is just my personal viewpoint. Always consult your financial advisor before taking any action.

Waiting for the Break: 3375 or 3320 Will Decide the Next 1k Pips📉 Quick recap:
As you know, I've been bullish on Gold. However, as explained in yesterday’s analysis, I started to approach this view with more caution. Unfortunately, I closed my long position at break even… before the rally to the 3375 resistance. That’s trading.
📌 What now?
Despite missing that move, the market is beginning to offer more clarity. There are now two key levels that will likely define the next major swing:
________________________________________
🔹 1. Resistance at 3375 – Top of the Range / Triangle Breakout Zone
• This level marks the upper boundary of the recent range
• It’s also the resistance of a developing ascending triangle
• A clean breakout above 3375 would confirm the pattern and could trigger a strong upside acceleration
• Target: 3450 zone, with potential for more if momentum kicks in (approx. 1000 pips higher)
➡️ This is the obvious bullish scenario – in line with the broader trend and classical technical setup.
________________________________________
🔻 2. Support at 3320 – The Less Obvious, but Classic Gold
• 3320 is now a confluence support area
• Technically, a break below here is less probable – but Gold has a habit of doing the unexpected
• If 3320 breaks, bears could look for a first leg to 3280 (approx. 400 pips), and very probably 3250 (around 700 pips drop)
➡️ This bearish scenario is not the base case, but it must not be ignored. Sometimes the trap is in the obvious.
________________________________________
🧭 Trading Plan:
For now, I’m out of the market, patiently waiting for confirmation. I’ll trade the breakout – whichever side gives the signal first.
________________________________________
📌 Conclusion:
Gold is coiling for a larger move. The levels are clear: 3375 and 3320 are the doors. One of them will open. Until then, we wait and prepare. 🚀
Disclosure: I am part of TradeNation's Influencer program and receive a monthly fee for using their TradingView charts in my analyses and educational articles.

ETHUSDT minor trendsEthereum BINANCE:ETHUSDT is downtrend with lower highs from the bottom is nearly finished 📉 . For a stronger rise, it needs to stabilize above $2500 ⚡. Mid-term targets are $3300 (end of second leg) and $3700 (major resistance) 🎯. Key supports are $2500, $2070, $1800, and $1550, the base where the uptrend began 🛡️.
Supports & Resistances:
Supports: \$2500, \$2070, \$1800, \$1550
Resistances: \$2500 (critical level), \$3300, \$3700

LINKUSDTThis is chart ready for pump but wait for break 14$. BINANCE:LINKUSDT
I in below say best supports and resistance's.
Support:
12.66
11.50
10.50
resistance's:
14
16.68
17.70
⚠️Contorl Risk management for trades.

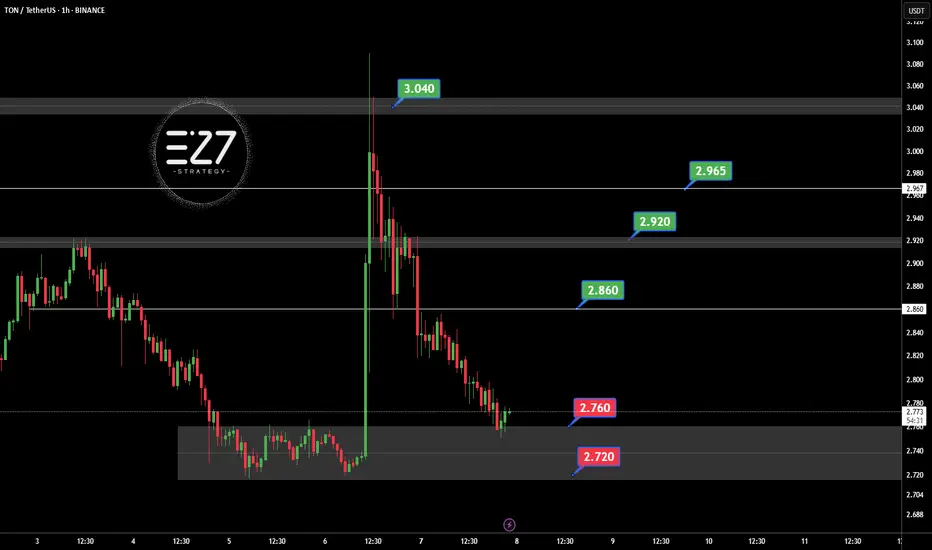
TONUSDT Following the official denial by UAE authorities regarding the possibility of obtaining a golden visa through staking OKX:TONUSDT , the bullish momentum driven by that rumor has faded. Selling pressure has increased, and TON is now consolidating within the key support zone of 2.720 to 2.760 USDT. If this support breaks, further downside is likely. However, if the price holds and reclaims the 2.860 USDT resistance, it could trigger a recovery toward 2.920 and 2.965 USDT. For now, the market sentiment remains bearish with a corrective bias.
Key Points:
UAE officially denied TON-based golden visa claims, weakening sentiment.
Current support zone: 2.720–2.760 USDT.
Key resistance: 2.860 USDT, then 2.920 USDT.
Break below 2.720 = further decline.
Break above 2.860 = potential bullish reversal.
⚠️ Please Control Risk Management in trades.
SOLUSDTThis chart BINANCE:SOLUSDT say to me that change of character. But we need to best confirmations for buy for example: pollback to 143 - 147 $ and higher high next pollback to level.
Support: 147 - 143 - 131.50
Resistance: 158 - 170 - 177 - 183
⚠️Please Control Risk Management in trades.

GBPCAD FORMING BEARISH FLAG PATTERNGBPCAD Bearish Trend Analysis (1-Hour Time Frame)
The GBPCAD pair is currently exhibiting a bearish trend on the 1-hour chart, with the market forming lower lows, confirming a sustained downward momentum. This price action indicates that sellers are in control, and the bearish sentiment is likely to continue in the upcoming trading sessions.
Bearish Flag Pattern Signals Further Decline
The price is forming a bearish flag pattern, a continuation pattern that often leads to further downside movement. This pattern suggests that after a brief consolidation, the pair may resume its downward trajectory. Traders should watch for a breakdown below the flag’s support, which could accelerate the decline.
Key Support and Resistance Levels
- Downside Targets: If the bearish momentum continues, the pair could test 1.84500, followed by 1.83200. These levels may act as potential take-profit zones for short positions.
- Upside Resistance: On the higher side, 1.87700 remains a critical resistance level. A break above this level could temporarily halt the bearish trend, but as long as the price stays below it, the downtrend remains intact.
Trading Strategy
- Short positions could be considered near resistance levels, with stop-loss orders placed above 1.87700 to manage risk.
- A confirmed breakdown below the bearish flag may present additional selling opportunities.
- Traders should monitor price action around support levels (1.84500 & 1.83200) for potential pullbacks or continuation signals.
Conclusion
With the lower lows formation and the bearish flag pattern, GBPCAD is expected to remain under selling pressure. Traders should watch for breakdowns below key support levels while keeping an eye on resistance at 1.87700 for any trend reversal signals.

DMC Buy/Long Setup (4H)After a time-consuming bullish move in a compressed structure, the price is now approaching a key support origin.
Buy/long positions can be considered around the green zone.
Targets are marked on the chart.
A daily candle closing below the invalidation level will invalidate this analysis.
For risk management, please don't forget stop loss and capital management
When we reach the first target, save some profit and then change the stop to entry
Comment if you have any questions
Thank You

BorgWarner Inc Quote | Chart & Forecast SummaryKey Indicators On Trade Set Up In General
1. Push Set Up
2. Range Set Up
3. Break & Retest Set Up
Notes On Session
# BorgWarner Inc Quote
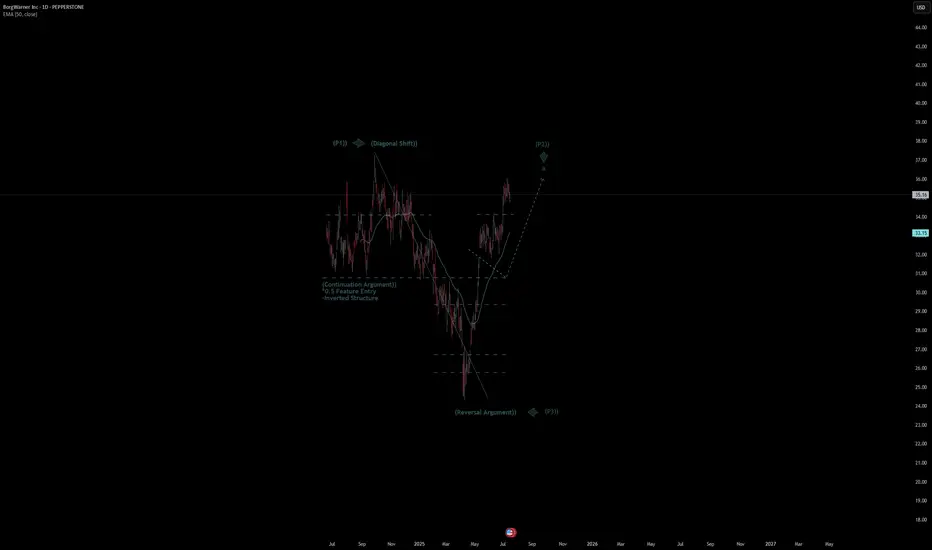
- Double Formation
* (Diagonal Shift)) At 38.00 USD | Completed Survey
* 0.5 Feature Entry | Subdivision 1
- Triple Formation
* (P1)) / (P2)) & (P3)) | Subdivision 2
* (TP1) = a / Long Consecutive Range | Subdivision 3
* Daily Time Frame | Trend Settings Condition
- (Hypothesis On Entry Bias)) | Regular Settings
- Position On A 1.5RR
* Stop Loss At 32.00 USD
* Entry At 35.00 USD
* Take Profit At 39.00 USD
* (Uptrend Argument)) & No Pattern Confirmation
- Continuation Pattern | Not Valid
- Reversal Pattern | Not Valid
* Ongoing Entry & (Neutral Area))
Active Sessions On Relevant Range & Elemented Probabilities;
European-Session(Upwards) - East Coast-Session(Downwards) - Asian-Session(Ranging)
Conclusion | Trade Plan Execution & Risk Management On Demand;
Overall Consensus | Buy
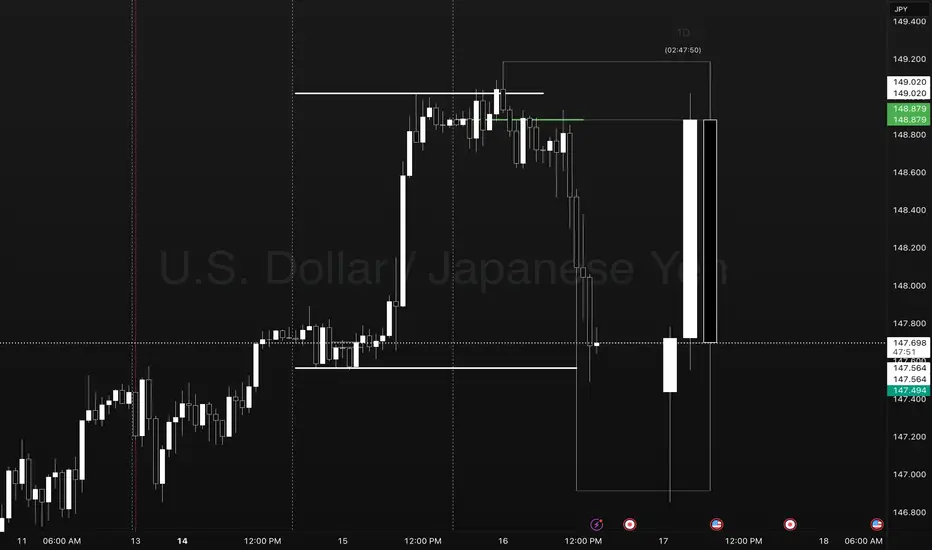
Pump Coil Dump Day 1-2-3 USDJPYUSDJPY Reversal Trade.
Points to Notice
Day 1 - Sets the new week high and low. Establishes a new week closing price as a target for a day 3 setup.
Day 2 - Typically expands Mondays range in the direction of the underlying oder flow. This occurs as a pump/ dump leading to the Asia and London coil sideways.
Day 3- We take note of the previous day high and low to observe price going into the NY session. In this case Price gave signs of a coiling reversal into the evening setting up for the move below Day 2 closing price.
Ideally what you want to see in this template is traders faked into a breakout move in the direction of the pump. This can present as a candle close above yesterdays high or closing price.
After trapping traders in we see the change in order flow creating a new lower low. This is the confirmation to look for an entry at the previous days closing price.
We set a stop at the high of day 3 level or at the previous days high with a target at the previous days low. In extreme cases we may see a setup that expands to the LOW level.
THE ONLY IMPORTANT DATA POINTS.
- PREVIOUS DAY HIGH AND LOW
- CLOSING PRICE
- LOW HOW LEVELS
- DAY COUNT
MARKETS ONLY DO TWO THINGS
- BREAKOUT, FAIL, REVERSE
- BREAKOUT, RETEST, TREND.
ONLY LEVELS THAT ARE TRADED
- PREVIOUS DAY HIGH (STOP LOSS)
- PREVIOUS DAY CLOSING PRICE (ENTRY)
- PREVIOUS DAY LOW (TARGET) CMCMARKETS:USDJPY FX:EURUSD OANDA:USDJPY
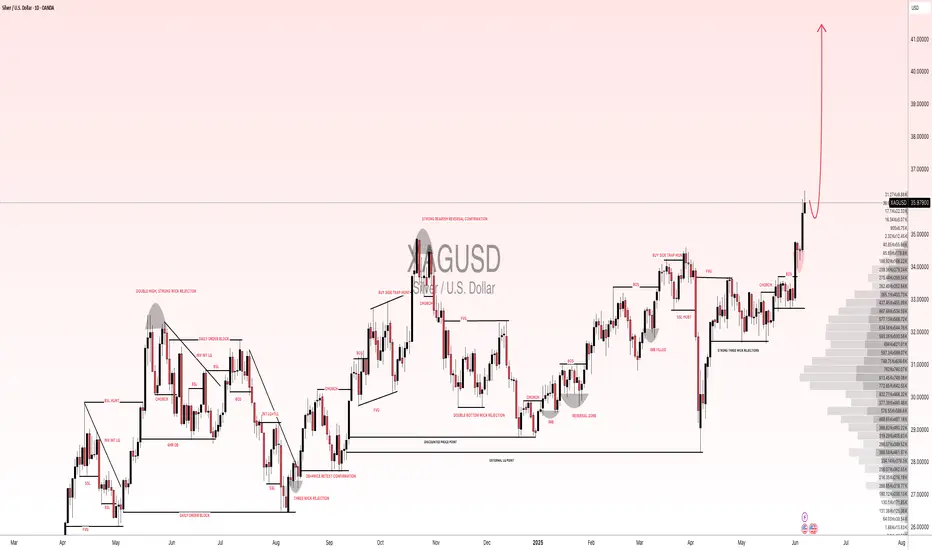
XAGUSD(SILVER):To $60 the silver is new gold, most undervaluedSilver has shown remarkable bullish behaviour and momentum, in contrast to gold’s recent decline. Despite recent news, silver remains bullish and unaffected by these developments. We anticipate that silver will reach a record high by the end of the year, potentially reaching $60.
There are compelling reasons why we believe silver will be more valuable in the coming years, if not months. Firstly, the current price of silver at 36.04 makes it the most cost-effective investment option compared to gold. This presents an attractive opportunity for retail traders, as gold may not be suitable for everyone due to its nature and price.
Silver’s price has increased from 28.47 to 36.25, indicating its potential to reach $60 in the near future. We strongly recommend conducting your own analysis before making any trading or investment decisions. Please note that this analysis is solely our opinion and does not guarantee the price or future prospects of silver.
We appreciate your positive feedback and comments, which encourage us to provide further analysis. Your continuous support over the years means a lot to us.
We wish you a pleasant weekend.
Best regards,
Team Setupsfx