USDCAD DROPS TO 1.3250 MAYBE 1.30USDCAD D1 28-1-23 = SD + PP + GAPS
- Seasonally FEB/MAR/APR should be bullish
- COT however is in favor of lower prices
- Technically it looks very bearish
- Lower Highs > Lower Lows on HTF
- Pivots: Price started the Quarterly at QPP, now moving to QS1 = 1.3250
- 1.3250 = QS1 = Demand-Zone = GAP = Imbalance = 50% Upswing / very likely to be hit
- 1.3000 = Important Level = Demand-Zone = QM1 / is likely to be hit, but remains to be seen
Pivotstrategy

SPX: Reached its Climax! What's Next? 🤔• The SPX did correct to the 21 ema, exactly as we expected in my previous analysis (link below this post, as usual);
• Now it is going up again, trying to resume the bullish sentiment, but in order to confirm that, it must break the red line at 4,015;
• If the SPX breaks this red line, it’ll trigger a pivot point, and in this scenario, the next resistance around 4,100 is the next target;
• What could go wrong? If the SPX fails in breaking this red line, and loses the 3,889 again. That could be a Double Top chart pattern;
• As long as it stays above its support levels, it’ll be fine, but a true reversal would only come if we trigger the pivot point;
• I’ll keep you updated on this.
Remember to follow me to keep in touch with my daily analyses!

USDCAD: 2ND IMPULSE LOWER TO 1.30 ?Looking for a drop to 1.30 big figure
COT: Looks like Institutional switching from acc. to dist. CAD shorts
COT: USD longs in dist. mode since Q4-22
COT: Both developments spell more downside for USDCAD
Pivots: Q1-23 starts with selling the Qarterly Pivot
Pivots this predicts Quarterly S2
TA: Daily downtrend evolving with a HH > HL > HH > HL printing
Levels: Stops resting below 1.3250 / 1.30 as downside target = QMS2

EURAUD LOWER ON COT / RSA / SEASONALITY / PIVOTS / TAExpect lower prices based on:
Seasonality (JAN/FEB down)
Pivots )Monthly Pivot to Monthly S2)
COT (EUR doWn, AUD up)
Techicals (Break of Structure, Lower High)
Relative Strength (EUR weaker, AUD stronger)
1.5000 as downside target for Q1

CADJPY Forecast!Hello Traders!
In the Descending Channel the price pullup it self from the ground to the top of the channel by correction way. I think it will fake breakout and retest 99.450 and fall down to middle of the Channel and MAYBE even the bottom.
What do you think?
Please Like and Comments to this post and let's talk technically on this matter.
love you all
Let's Master the Market together!

Entry Price 91.683AUDJPY. Enter a long position at 91.683. Pin Bar occurred at Support Level using Pivot Point Indicator.


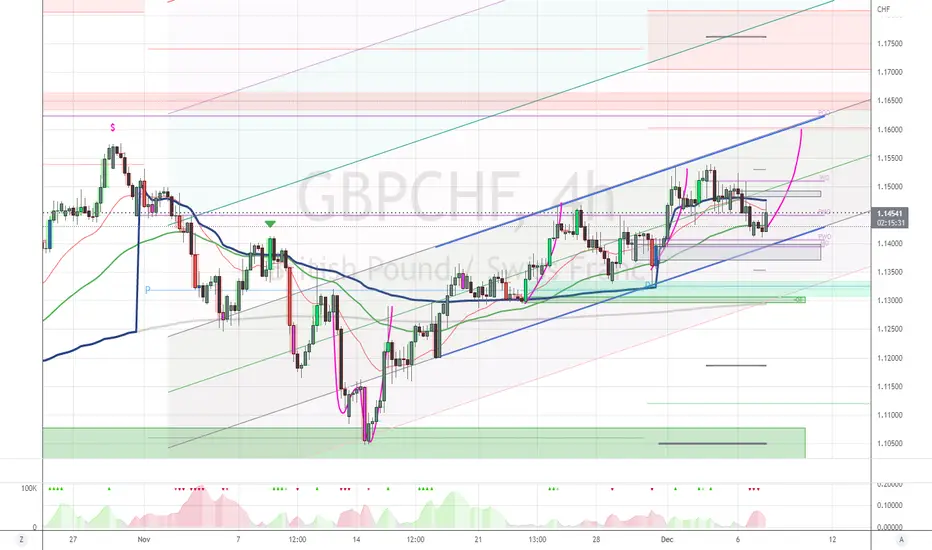
GBPCHF TO 1.180+ IN DEC- RSA W1: GBP strong, CHF weakening
- COT: GBP buying longs AND selling shorts, CHF only selling shorts
- LVL: PMH & PWH at 1.1540, CQH at 1.1570, levels approached but not yet purged
- PP: MPP predicts MR2 = 1.1810
- TA: Price makes HH > HL since mid NOV
- PTRN: W + 1st push completed
- VOL: Volume preceeds price on H4, Price above QVWAP but BELOW MVWAP & WVWAP
- SEASONAL WARNING: GBP sideways in DEC, CHF bullish in DEC
US2000 BACK TO 2000 ?- RUSSEL back to 2000
- Seasonally Russel is strong in DEC
- Seasonally Dollar is weak in DEC
- W-pattern + 1st Push unfolded
- Looking for stophunt high and low, then 2nd Push
- 2nd Push is run from 1850 to 2000 = MPP to MR2
- Also Demand-zone and 2 Deviation of Channel
- COT supportive of move higher, Dealers more short and less long


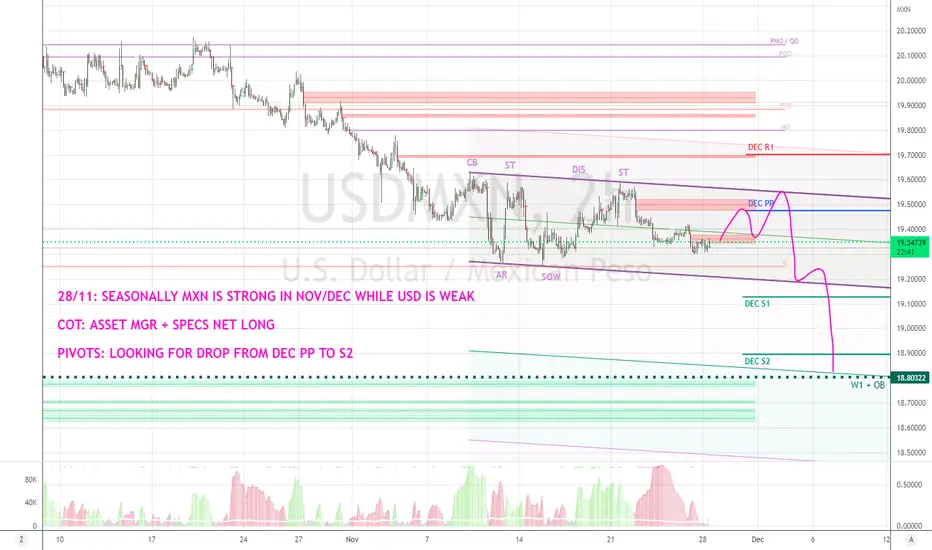
USDMXN LOWER BEFORE X-MASS- Seasonally MXN is strong in NOC/DEC
- Seasonally USD is weak in DEC
- COT supports this outlook
- Asset Managers + Leveraged Money accumulating Longs
- Leveraged Money also distributing Shorts
- Looking for a drop from DEC Pivot to DEC S2
- Higher Timeframe objective is Weekly Bullish Orderblock at 18.80
COT: images2.imgbox.com
GOLD HIGHER IN DEC BASED ON SEASONAL AND COT DATASeasonally Gold is strong in DEC
Seasonally USD is weak in DEC
GOLD Speculators COT-data supports this outlook
Speculators accumulating longs while distributing shorts
Looking for a run from DEC PP to DEC R1 = 2022 Yearly Open
COT: images2.imgbox.com

US05Y H8: UP TO PP, THEN DROP TO S1 - Looking for US5Y-Yield to move above DEC Monthly Pivot
- Followed by a drop to DEC S1 = GAP
- Dollar-Index should follow Yield and weaken after 1st week of DEC

GAP BACK TO 2022 OPEN ?- Price is back above 2022 Mid-level
- 2022 Open = 2022 High = 2023 Yearly R1 = Imbalance
- If Dollar-weakness continues in DEC a rally higher is likely
- Wyckoff accumulation-pattern completed
- Look to buy the retrace begin DEC

EURCHF M30 WYCKOFF ACCUMULATION UPDATE- Wyckoff accumulation in down-sloping channel unfolding
- Looking for a run on 1.00 big figure
- 1.00 = Weekly R2

GBPAUD DROPPING TO 1.70 ?- Looking for GBPAUD to weaken
- First target is 2nd deviation
- Second target is 1.7000

EURCHF M15 2 DEV UP- EURCHF intra-week Wyckoff pattern unfolding
- Looking for 2 DEV run to Weekly R2

CADJPY H4 WYCKOFF DISTRO- Looking for CADJPY to retrace to 102.50
- Pivotwise a run from Monthly Pivot to Monthly S2
- Monthly S2 = 102.50 = 3rd Deviation of Wyckoff channel

BTC-NEXT-CYCLE
I think BTC will bottom out soon cause of reaching a pivot point, where the FED will only Hike 50BPS cause of CPI Drop, If they also switch from Quantitave Tightening to stop or switch to Qauntitave Easing
BTC will build a cup of handle and maybe reach an ATH next BTC Halving in 2024

📉✌BTC 1H Long Position✌📈BINANCE:BTCUSDT
COINBASE:BTCUSD
Hello, first look at my previous analysis (linked below).
💥A quick long position can have a good chance of winning.
between now and the yellow area below, you can open short position in two steps.
If the price falls and reaches the risk-free level, you can risk-free the position.
TP1-2-3-4 are on the chart.
The optimum stop-loss is on the chart.
Please share ideas and leave a comment,
let me know what you think.
CrazyS✌

JS-Masterclass #6: The Perfect Buy PointThe Perfect Buy Point
A Perfect Buy Point represents the completion of a stock’s consolidation and the potential start of its next advance. After a base pattern has been established, the Perfect Buy Point is where the stock establishes a price level that will act as the trigger to enter a trade.
When a stock’s price level moves through the Perfect Buy Point, there is a high probability that this represents the start of the next advancing phase.
You can also call the Perfect Buy Point a “call to action” price level – it is the optimal buy point.
In the context of a stock’s Volatility Contraction Pattern, a temporary pause (also called a base building process) allows you to set a buy stop to enter a trade. You want to buy as close to thePerfect Buy Point as possible without chasing the stock up more than 1.0%. In this context, the use of buy stop limit orders is recommended.
As a solid consolidation process and the formation of a Volatility Contraction Pattern are needed before a Perfect Buy Point can occur, The Perfect Buy Point can also be considered as the line of least resistance. A stock can move very fast once it crosses this threshold. When a stock breaks through the line of least resistance, the probability is high that the price level will move much higher in a short period of time.
This is the case because this represents an area where supply is low. Therefore, even a small amount of demand can move the stock higher.
The importance of the Volume at the perfect Buy Point
A Volatility Contraction Pattern is needed before a Perfect Buy Point can develop. As explained earlier, supply will stop coming to market at the ed of a valid Volatility Contraction Pattern. This is why we want to see the Volume significantly come down in the day or the couple of days before the Perfect Buy Point develops.
Now, with only very little supply of stock in the market from sellers, even a small amount of buying can move the price up very rapidly as the price level moves through the Perfect Buy Point.
In the ideal case, this move through the perfect Buy Point occurs under heavily increasing volume. This might be an indication that big institutions are putting their big money into the stock.
When all of this comes together, you want to place the order as close to the Perfect Buy Point as possible.
Always wait for the price level to move through the Perfect buy Point!
Some traders will try to get in before the breach of the pivot point to save a few pennies on the trade. Assuming that a stock will break out is dangerous and the breakout may fail. Be patient!
Remember
Even if you respect all these technical requirements of a Perfect Buy Point, you will still get stopped out and incur losses.
BUT: Trading is all about probabilities…respecting these rules will increase your probability to enter profitable trades and significantly outperform other traders and increase your chances to be consistently profitable in the market.

WOLF daily evening star reversalWOLF daily evening star reversal at local pivot pretty high have room to go down.
Sell Stop 107.24 LMT 107.24 GTC
Buy Limit 94.43 GTC
Buy Stop 116.29 GTC

LINKUSDT Potential Bearish Max GartleyAs we can see on the 4H chart, we have a Max Gartley pattern in formation. The PRZ - potential reversal zone - is very close. Pivot points can be observed in the Fibonacci Retracement. Fisher Transform Oscillators (www.tradingview.com) and Ehlers Stochastic Oscillator-LazyBear/) in bullish momentum.
LINKUSDT is in a 4H bullish momentum driven by the daily relief from the US market. Looking at the S&P500 chart, we can see price action testing the trendline of the channel from which it broke. Doesn't look like a big potential pullback - weak volume and bearish sentiment. Traders looking for a crucial point now coming soon. I'm expecting bears in control soon. As a side effect of possible lower lows in the US market, LINKUSDT could reach the ideal level for a short position by tomorrow.
At this juncture, with the expectation of days ahead for the weekend in a downward corrective, while the Dollar Index rises, and the market overbought on the daily chart, the pivot point D pointed to by the Max Gartley Bearish pattern seems to make perfect sense. We can see over the course of the day, as the S&P500 appears to visit the GAP up to the .886 Fibonacci Retracement level, LINKUSDT being pushed to another higher high near USD9.00. So we will have the range at PRZ when the market will be entering bearish momentum on the daily chart.
Prints on updates below.
