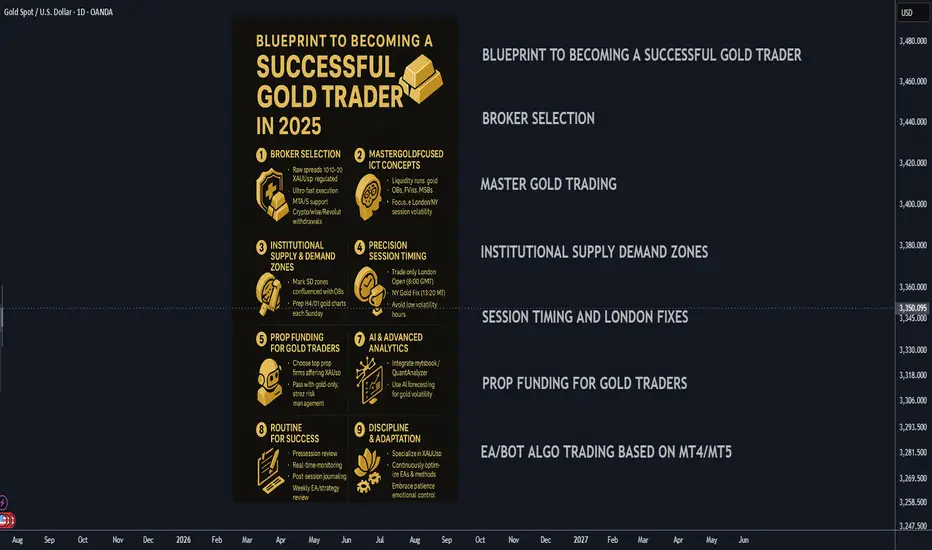
Blueprint to Becoming a Successful Gold Trader in 2025🚀 Blueprint to Becoming a Successful Gold Trader in 2025
A strategic, step-by-step plan to master gold trading by combining institutional concepts, cutting-edge automation, and the best prop funding opportunities for XAUUSD.
________________________________________
🏦 Broker Selection (Gold-Specific)
• 🔍 Choose Brokers Offering Raw Spread XAUUSD Accounts:
Seek brokers with raw/zero spread gold trading or tight gold spreads (0.10-0.30 average) with deep liquidity.
• ⚡ Prioritize Ultra-Fast Execution for Metals:
Confirm broker servers are in NY4/LD4 and latency is optimized for gold volatility spikes.
• 🛡️ Verify Regulation & Execution:
ASIC, FCA, FSCA preferred; check for proof of XAUUSD execution quality (Myfxbook/FXBlue verified).
• 📊 MetaTrader 4/5 Gold Support:
Ensure MT4/5 platform offers tick-chart precision for gold and supports custom EAs/indicators.
• 💳 Flexible Withdrawals/Payouts:
Crypto, Wise, and Revolut compatibility for fast, secure funding.
________________________________________
🎯 Gold Trading Strategy (ICT + Supply/Demand Zones)
• 🧠 Master Gold-Adapted ICT Concepts:
o Liquidity runs and stops at London/NY session highs/lows
o XAUUSD-specific Order Blocks (OBs), FVGs, and Market Structure Breaks (MSB)
• 📍 Map Institutional Supply-Demand Zones:
Gold reacts violently to these—align SD zones with ICT Order Blocks for best confluence.
• 📐 Precision Entries:
Only enter after liquidity sweeps at key XAUUSD levels (H4/D1), avoiding choppy retail entries.
• 📈 Time & Price for XAUUSD:
Focus exclusively on London Open (8:00 GMT) and NY Open/Gold Fixing (13:20 GMT)—peak volatility windows.
• 📆 Weekly Preparation:
Annotate D1/H4 gold charts every Sunday with clear OBs, liquidity points, and SD zones for the week.
________________________________________
💰 Prop Funding for Gold Trading
• 🥇 Select Firms Offering XAUUSD with Tight Rules:
Choose FTMO, The Funded Trader, MyFundedFX, or similar with high leverage and XAUUSD trading enabled.
• 📑 Pass Evaluation with Gold-Only Strategy:
Use high-probability, low-frequency XAUUSD trades—1-3 setups per week, strict risk parameters.
• 🎯 Risk Management:
Max 1% risk/trade, stop trading after 2 consecutive losses—protect account and pass evaluations.
• 📊 Analytics Monitoring:
Use prop dashboards (FTMO Metrics, FundedNext stats) to review XAUUSD trade stats and adjust.
• 📚 Diversify Funded Accounts:
Split funded capital among multiple firms to hedge against firm-specific risk and maximize payouts.
________________________________________
⚙️ Automating Gold Trading (MT4/5 EAs & Bots)
• 🛠️ Hire MQL4/5 Developers for XAUUSD EAs:
Code bots focused on gold-specific ICT (OBs, FVGs, London/NY volatility).
• 🤖 Develop EAs for Gold:
o OB/FVG/Market Structure detection on XAUUSD
o Supply/Demand zone algo entries
o Gold breakout EAs for session openings
• 📌 Trade Management Automation:
o Entry, stop loss, partial TP, BE, trailing for gold’s high volatility
o Dynamic lot-sizing by daily ATR
• 📡 VPS Hosting Near Broker’s Gold Server:
Use NY4/LD4 VPS for lowest latency (ForexVPS, Beeks).
• 📈 Quarterly Forward-Testing:
Optimize EAs in demo before live trading, retest on every major gold volatility shift (FOMC, CPI).
________________________________________
📲 Leveraging Bots & AI in 2025
• 📊 Integrate with MT4/5 Analytics Tools:
Use myfxbook, QuantAnalyzer for detailed gold trade breakdowns.
• 🔮 AI-Based Gold Forecasting:
Layer in machine learning models (e.g., TensorTrade, TradingView AI) to anticipate session volatility and direction.
• 🔔 Real-Time Alert Bots:
Set up Telegram/Discord bots for instant notification of ICT-based XAUUSD signals.
• 🧑💻 Manual Oversight:
Always review high-impact news (NFP, CPI, FOMC) and override automation when macro risk spikes.
• 🔄 Continuous Bot Updates:
Retrain your EAs monthly on latest XAUUSD price action to maintain edge.
________________________________________
🗓️ Daily Gold Trader Routine
• 🌅 Pre-Session (30 mins):
Review annotated gold charts, key session highs/lows, OB/FVG/SD levels, and upcoming news.
• 💻 During Session:
Monitor bot execution, validate setups manually, manage risk during NY/London overlap.
• 📝 Post-Session (15 mins):
Journal gold trades, note reasoning for entry/exit, emotional state, and lessons learned.
• 📆 Weekly Review:
Assess overall gold trading stats and EA performance, adjust strategy as needed.
• 📚 Continuous Learning:
Stay updated on ICT, gold market fundamentals, and new trading tech.
________________________________________
📌 Final Success Advice for 2025
• 🔍 Specialize in XAUUSD/Gold—Don’t Diversify Randomly:
Depth > Breadth—become a true gold trading expert.
• 🚩 Keep Adapting Your Gold Trading EAs:
Markets change—so must your bots and playbooks.
• 🧘 Stay Patient, Disciplined, and Selective:
Gold rewards precision and patience, not overtrading.
• 💡 Embrace AI & Automation:
Leverage every tool: AI, analytics, and custom EAs for a real 2025 trading edge.
Platinum
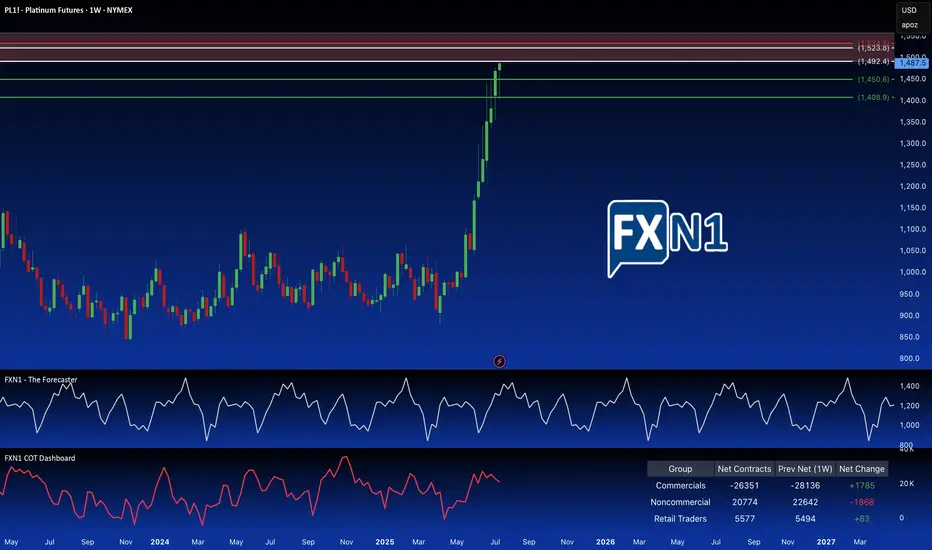
Platinum: Breaking the Supply Barrier?I'm adding a second Platinum position. Price has hit a strong weekly supply area, also a significant monthly supply zone. I'm anticipating a reversal here, as non-commercial holdings are decreasing, and seasonal patterns suggest a potential trend change. To further capitalize on potential upside, I've placed a pending order above the primary supply zone, at a slightly higher, but still relevant. These are older, established and fresh supply zones.
(Note: Reducing the chart size may help to better visualize the long-term significance of these overlapping areas.)
✅ Please share your thoughts about PL1! in the comments section below and HIT LIKE if you appreciate my analysis. Don't forget to FOLLOW ME; you will help us a lot with this small contribution.
HL-Insane Confluence HereChart speaks for itself.
Confluence on many indicators suggests a hard bottom here

Gold Market Update and Recommended Strategy bulls/bears📉 Gold Holds Steady ~$3,354/oz
Moderate USD strength and tariff-driven safe‑haven buying have kept gold anchored in the $3,330–$3,360 zone.
🤝 Trade & Tariff Influence
Tariff headlines—from Canada’s 35% rate to broader threats—have supported gold by boosting safe‑haven demand heading into U.S. CPI.
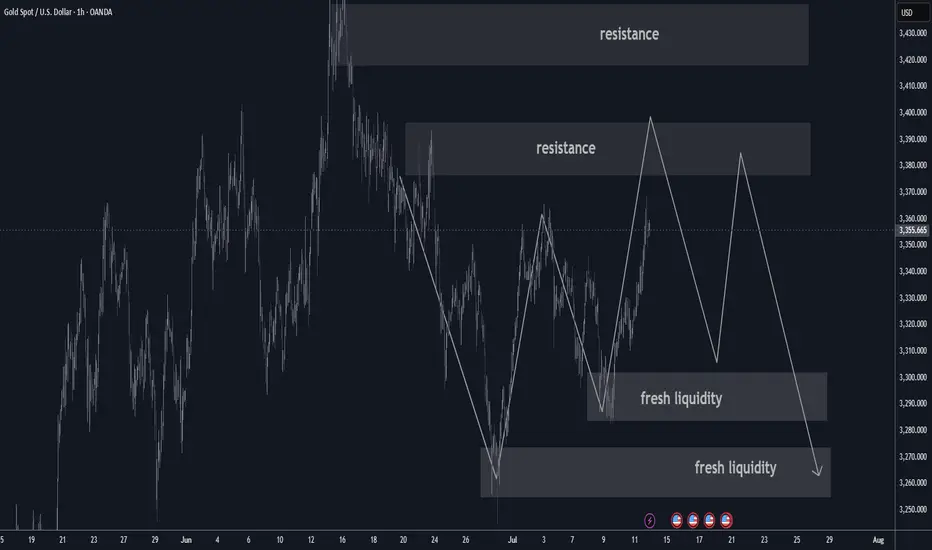
📊 Technical Watch
Testing resistance at $3,360; full breakout above $3,342–$3,360 opens path to $3,400–$3,500.
Support sits at $3,330–$3,322 (20‑day EMA); breach risks pickup in short‑term bearish momentum.
💼 U.S. Macro & Fed Cues
Inflation data (June CPI due July 15) and Fedspeak ahead of the July blackout window are set to define next directional moves.
🌍 Central Bank Insight
World central banks are stockpiling gold at record rates, creating a bullish backdrop.
⚖ Range‑Bound Outlook
Expect gold to drift between $3,330–$3,360 near‑term, with upside if tariff/CPI triggers materialize.
📉 Short‑Term Bias
Neutral‑to‑bullish; momentum indicators are calm but could shift quickly on macro surprises.
📈 Med‑Term Outlook Bullish
Ongoing central bank demand, trade dynamics, and macro fundamentals still favor a gradual move toward $3,500+.
⭐ Updated Strategy Recommendations
Accumulate on dips near $3,330–$3,320.
Watch resistance at $3,360–$3,400 for profit‑taking or breakout buying opportunities.
Bears may focus on selling rallies near the upper range.
Gold Market Update: Stuck in summer time range / SeasonalityGold is stuck so far last 4-6 weeks in tight range trading conditions
due to summer time seasonality also strong gains previously
expecting range locked conditions in July as well here's an
overview of 5 years and 10 years of seasonality data by month
until at least August expecting dead market conditions it's best
to focus on trading the range or trading with automated algo instead.
Here are the two tables showing month-over-month percent changes in gold prices (London PM fix USD/oz) for June, July, and August:
| Year | June Close | July Close | August Close | June % | July % | August % |
| ---- | ---------: | ---------: | -----------: | -----: | ------: | -------: |
| 2023 | 1,942.90 | 1,951.02 | 1,918.70 | –0.04% | +0.42% | –1.68% |
| 2022 | 1,836.57 | 1,732.74 | 1,764.56 | –5.65% | +1.80% | +1.80% |
| 2021 | 1,834.57 | 1,807.84 | 1,785.28 | –1.47% | –1.48% | –1.22% |
| 2020 | 1,761.04\* | 1,771.65\* | 1,968.16\* | +8.66% | +11.19% | +10.99% |
| 2019 | 1,342.66\* | 1,413.39\* | 1,523.00\* | +5.29% | +7.95% | +7.74% |
| 2018 | 1,270.00\* | 1,230.00\* | 1,194.00\* | –1.09% | –3.15% | –3.02% |
| 2017 | 1,257.00\* | 1,243.00\* | 1,280.00\* | +0.72% | –1.10% | +2.93% |
| 2016 | 1,255.00\* | 1,364.00\* | 1,322.00\* | +3.24% | +8.67% | –3.11% |
| 2015 | 1,180.00\* | 1,172.00\* | 1,116.00\* | –2.06% | –0.68% | –4.69% |
| 2014 | 1,320.00\* | 1,311.00\* | 1,312.00\* | –0.65% | –0.68% | +0.08% |
🔍 Summary Highlights
June has been weak more often than not—negative in 6 of the past 10 years.
July shows modest gains overall—positive in 7 of the last 10.
August is the strongest summer month—positive 6 times out of the past 10, with several double-digit y/y gains (like +10.99% in 2020).

“Accumulation, Breakout, Repeat: SBSW’s Time Again?” SBSW | Weekly Chart Analysis
4-Year Cycle | Smart Money Levels | Precious Metals Macro Tailwind
This chart paints a clear picture — Sibanye-Stillwater (SBSW) has followed a reliable 4-year accumulation-to-expansion cycle:
🔹 2015–2016
🔹 2019–2021
🔹 Now shaping up for 2025–2026
Each rally kicked off after institutional accumulation around the $3 level, and once again, we’re seeing the same behavior. History doesn’t just rhyme — it repeats.
🧠 Smart Money Moves
Every major cycle began after price based out near the $3 level. That’s exactly what we’ve just seen — accumulation, basing, and now lift-off. We’ve entered a familiar pattern — the same smart money footprints showing up again.
📊 Technical Breakdown
This is the weekly chart, and we’re now testing the 0.236 Fibonacci retracement level (7.39) drawn from the 2020 high to the recent low.
✅ A weekly close above this level + structure building could confirm the beginning of a long-term leg higher.
📈 Volume Flow Indicator has crossed above the midline for the first time in years, suggesting that real buying pressure is back. That’s a shift in momentum worth noting.
🎯 Key Areas of Interest:
• $10.00 – Volume node + prior S/R
• $12.00 – Fib midpoint + prior pivot
• $14.90 – Confluence zone
These are zones where I’ll be watching for continuation, reaction, or reversal.
🌎 Macro Tailwind: Precious Metals Demand
Platinum and palladium are gaining renewed attention as demand increases in EVs, clean energy, and industrial sectors. SBSW — with its deep exposure to both metals — is positioned as a long-term beneficiary if this trend continues.
Add to that the recent global instability and de-dollarization chatter, and you’ve got a macro backdrop favoring real assets over paper. Precious metals are catching a bid — and SBSW could ride that wave.
🧠 My Position
Started buying $4.00 calls and recently rolled to $5.50s. I’m letting this one develop over time — watching for confirmation and continuation.
(Not financial advice — just sharing my perspective as always.)
🕰️ Cycles matter.
📚 History teaches.
💰 Smart money accumulates before the breakout.
This setup has all the hallmarks of a repeat cycle in progress. I’m locked in.
—
📍 Long-term chartwork, weekly timeframe. Zoom out to see the rhythm.
SBSW | Weekly Chart Analysis
4-Year Cycle | Smart Money Levels | Precious Metals Macro Tailwind
This chart paints a clear picture — Sibanye-Stillwater (SBSW) has followed a reliable 4-year accumulation-to-expansion cycle:
🔹 2015–2016
🔹 2019–2021
🔹 Now shaping up for 2025–2026
Each rally kicked off after institutional accumulation around the $3 level, and once again, we’re seeing the same behavior. History doesn’t just rhyme — it repeats.
🧠 Smart Money Moves
Every major cycle began after price based out near the $3 level. That’s exactly what we’ve just seen — accumulation, basing, and now lift-off. We’ve entered a familiar pattern — the same smart money footprints showing up again.
📊 Technical Breakdown
This is the weekly chart, and we’re now testing the 0.236 Fibonacci retracement level (7.39) drawn from the 2020 high to the recent low.
✅ A weekly close above this level + structure building could confirm the beginning of a long-term leg higher.
📈 Volume Flow Indicator has crossed above the midline for the first time in years, suggesting that real buying pressure is back. That’s a shift in momentum worth noting.
🎯 Key Areas of Interest:
• $10.00 – Volume node + prior S/R
• $12.00 – Fib midpoint + prior pivot
• $14.90 – Confluence zone
These are zones where I’ll be watching for continuation, reaction, or reversal.
🌎 Macro Tailwind: Precious Metals Demand
Platinum and palladium are gaining renewed attention as demand increases in EVs, clean energy, and industrial sectors. SBSW — with its deep exposure to both metals — is positioned as a long-term beneficiary if this trend continues.
Add to that the recent global instability and de-dollarization chatter, and you’ve got a macro backdrop favoring real assets over paper. Precious metals are catching a bid — and SBSW could ride that wave.
🧠 My Position
Started buying $4.00 calls and recently rolled to $5.50s. I’m letting this one develop over time — watching for confirmation and continuation.
(Not financial advice — just sharing my perspective as always.)
🕰️ Cycles matter.
📚 History teaches.
💰 Smart money accumulates before the breakout.
This setup has all the hallmarks of a repeat cycle in progress. I’m locked in.
📍 Long-term chartwork, weekly timeframe. Zoom out to see the rhythm.
🛑 Invalidation below $5.50 — no structure, no conviction, I’m out.
If SBSW breaks back below the $5.50 level with high volume and fails to reclaim it quickly, that would invalidate the current breakout structure and suggest this move was a false start. I'd reassess the cycle thesis if we revisit the $4 range with no buyer defense.
Please feel free to comment and let me your opinion

Gold Bull Markets: Long-Term Overview & Current Market UpdateGold Bull Markets: Long-Term Overview & Current Market Update (2024–2025)
________________________________________
🏆 Historic Gold Bull Markets: Timeline & Stats
1️⃣ 1968–1980 “Super Bull”
• Start/End: 1968 ($35) → 1980 ($850)
• Total Gain: ~2,330%
• Key Drivers:
o End of the gold standard (Bretton Woods collapse)
o Double-digit inflation, oil shocks
o Political/economic turmoil (Vietnam, stagflation)
• Correction:
o Nearly –45% drop (1974–1976)
• Recovery:
o Took years; massive rebounds afterward
2️⃣ 1999–2012 Bull Market
• Start/End: 1999 ($252) → 2012 ($1,920)
• Total Gain: ~650%
• Key Drivers:
o Commodities supercycle
o Emerging market demand
o US dollar weakness, financial crisis fears
• Correction:
o ~–30% during 2008 crisis, but fast recovery
• Recovery:
o Rebounded quickly after 2008, then peaked in 2011–12
3️⃣ 2016/2018–2027 (Current Cycle)
• Start/End: 2016/2018 ($1,050–$1,200) → ongoing ($3,500+)
• Key Drivers:
o Record central bank buying
o Persistent inflation & low real rates
o Geopolitical instability (Russia/Ukraine, China/US, etc.)
• Correction:
o Only –20% drawdown in 2022; quick recovery
o Broke 13-year technical “cup-and-handle” base in 2024
________________________________________
📊 Current Bull Market Stats (2025) – At a Glance
Metric 1968–80 Super Bull 1999–2012 Bull 2018–2025 Current Bull
🚀 Total Gain ~2,330% ~650% ~200% so far
⏲️ Duration 12 years 13 years 7–9 years so far
💔 Max Drawdown –45% (1974–76) –30% (2008) –20% (2022)
🏦 Central Bank Role Moderate Emerging Dominant
📉 Correction Recovery Years 4 years Months
🏛️ Technical Pattern Secular breakout Multiple peaks 13-yr base breakout
________________________________________
📈 Top 10 Stats of the Current Gold Bull Market (2025):
1. Gold Price:
o ~$3,338–$3,364/oz; ATH > $3,500 in April 2025
2. Year-to-Date Gain:
o +29% YTD (2025); +30% in 2024
3. Central Bank Demand:
o 1,000 tonnes bought for 4th straight year; reserves near records
4. Inflation Hedge:
o Strong negative correlation with real yields; safe-haven demand up
5. Gold vs S&P 500:
o Gold +27% YTD; S&P 500 up only ~2%
6. Jewelry Demand:
o Down –9% in 2024, projected –16% in 2025 (high prices suppress demand)
7. Gold-Silver Ratio:
o Now ~94 (down from 105); silver catching up
8. Record Closes:
o Over 40 daily record closes in 2025; price consolidating near highs
9. Technical Breakout:
o 13-year “cup-and-handle” breakout (March 2024)
10. 2025 Forecasts:
• Range: $3,600–$4,000 by Q2 2026; some see $4,500+ if risks persist
________________________________________
🔄 How This Bull Market Stands Out
• Dominance of Central Banks:
Central banks are setting the pace—record demand, making gold a reserve anchor again.
• Faster Recovery:
Corrections are less severe, recoveries are quick (months, not years).
• Synchronized Rally with Equities:
Rare for gold and stocks to hit highs together—shows systemic confidence in gold.
• Technical Breakout:
13-year base break signals powerful, long-term momentum.
• Future Outlook:
Targets as high as $7,500/oz (650% from cycle lows) possible by 2026/27, if historical analogs play out.
________________________________________
⭐️ Recommended Strategy (2025 and Beyond)
• BUY/HOLD/ACCUMULATE on Dips:
Favor physical gold, gold ETFs (GLD), and miners (GDX).
• Physical Over Paper:
Preference for allocated, physical bullion amid rising counterparty risks.
• Diversify with Miners/Silver:
Gold-silver ratio suggests silver may offer leverage; quality miners benefit in the latter stage of bull runs.
• Long-Term Perspective:
Anticipate volatility, but higher highs are likely if macro themes persist.
________________________________________
🧭 Summary Table: Historic vs Current Bull Markets
Feature 1968–80 1999–2012 2016/18–2027
Total Gain 2,330% 650% 200%+ (so far)
Duration 12 yrs 13 yrs 7–9 yrs (so far)
Correction –45% –30% –20%
Main Buyer Retail Funds Central Banks
Pattern Parabolic Cyclical Cup & Handle
Key Risks Inflation USD/credit Inflation, war, geopolitics
________________________________________
Key Takeaways
• Gold’s current bull market is distinguished by relentless central bank demand, robust technical momentum, and swift recoveries from corrections.
• The macro backdrop—persistent inflation, global uncertainty, and sovereign de-dollarization—supports an extended cycle.
• Expectations for $4,000+ gold in the next 12–24 months are widely held, with even higher targets in a true global crisis.

XPTUSD 1W:While Everyone Watches Gold, Platinum Quietly Wakes UpGold gets the headlines — but platinum just broke two years of silence with a clean, high-volume breakout from a symmetrical triangle on the weekly chart. And this isn’t noise — this is the structural shift traders wait for.
Price has been coiled inside a compressing wedge since early 2022. Equal highs. Equal lows. Stop hunts both ways. The classic “shake out before take off.” Now? The breakout is in. And the weekly candle closed above resistance with volume confirmation. Oh, and while we're at it — the 50MA just crossed above the 200MA, signaling a long-term trend reversal.
Target? Measure the triangle height: ~398 points. That projects a breakout target of 1440 USD, which aligns perfectly with previous institutional rejection zones.
But this isn’t just about the chart.
🔹 South Africa, the top global supplier, is struggling with energy and production cuts;
🔹 The Fed is pausing rate hikes — the dollar weakens, metals rally;
🔹 Demand from hydrogen tech, clean energy, and industrial catalysts is on the rise.
Translation? Smart money has been accumulating. The move from 965–1070 was just the ignition. The drive hasn’t started yet.
So while everyone fights over gold highs, platinum sits at the base of a move no one's prepared for — except those who know how accumulation ends.
🧭 Key support: 965–985
📍 Resistance zone: 1150–1180
🎯 Measured target: 1440+

Gold Market Update: Bulls Will target 3750 USD after 3500 USD🏆 Gold Market Mid-Term Update (June 19, 2025)
📊 Price & Technical Outlook
Current Spot Price: ~$3,365
Technical Setup
Inverted H&S pattern forming/completed on higher timeframes — confirms bullish reversal structure.
Reload (buy) zone: $3,250–$3,275 (ideal accumulation range for bulls if price pulls back).
Swing trade setup: Entry: $3,250–$3,275 (reload zone)
Take Profit (TP): $3,750
Support: Major at $3,250–$3,275 (break below = reassess bullish bias).
Resistance: $3,450–$3,500 ; next major resistance: $3,600, then $3,750.
Price consolidating above $3,250–$3,350 is technically healthy — maintaining bullish structure.
🏆 Bull Market Overview
The pullback appears complete; uptrend resumes amid strong macro/geopolitical drivers (inflation, rates, safe haven flows).
Key Levels: $3,000 (macro support), $3,250 (bulls must defend), $3,500 (breakout zone), $3,750 (swing TP).
Short-term dips = buying opportunities — “Buy the Dip” remains favored as long as support holds. Upside targets: Immediate: $3,600 Swing target: $3,750
Summary:
Gold remains in a bullish mid-term structure, with the inverted H&S pattern pointing to higher prices ahead. Bulls look to reload at $3,250–$3,275, targeting $3,750 for swing trades. As long as $3,180–$3,200 holds, buying dips is the play. A sustained breakout above $3,400–$3,600 opens the door for new all-time highs.

Intraday Gold Trading System with Neural Networks: Step-by-Step________________________________________
🏆 Intraday Gold Trading System with Neural Networks: Step-by-Step Practical Guide
________________________________________
📌 Step 1: Overview and Goal
The goal is to build a neural network system to predict intraday short-term gold price movements—typically forecasting the next 15 to 30 minutes.
________________________________________
📈 Step 2: Choosing Indicators (TradingView Equivalents)
Key indicators for intraday gold trading:
• 📊 Moving Averages (EMA, SMA)
• 📏 Relative Strength Index (RSI)
• 🌀 Moving Average Convergence Divergence (MACD)
• 📉 Bollinger Bands
• 📦 Volume Weighted Average Price (VWAP)
• ⚡ Average True Range (ATR)
________________________________________
🗃 Step 3: Data Acquisition (Vectors and Matrices)
Use Python's yfinance to fetch intraday gold data:
import yfinance as yf
import pandas as pd
data = yf.download('GC=F', period='30d', interval='15m')
________________________________________
🔧 Step 4: Technical Indicator Calculation
Use Python’s pandas_ta library to generate all required indicators:
import pandas_ta as ta
data = ta.ema(data , length=20)
data = ta.ema(data , length=50)
data = ta.rsi(data , length=14)
macd = ta.macd(data )
data = macd
data = macd
bbands = ta.bbands(data , length=20)
data = bbands
data = bbands
data = bbands
data = ta.atr(data , data , data , length=14)
data.dropna(inplace=True)
________________________________________
🧹 Step 5: Data Preprocessing and Matrix Creation
Standardize your features and shape data for neural networks:
from sklearn.preprocessing import StandardScaler
import numpy as np
features =
scaler = StandardScaler()
data_scaled = scaler.fit_transform(data )
def create_matrix(data_scaled, window_size=10):
X, y = ,
for i in range(len(data_scaled) - window_size - 1):
X.append(data_scaled )
y.append(data .iloc )
return np.array(X), np.array(y)
X, y = create_matrix(data_scaled, window_size=10)
________________________________________
🤖 Step 6: Neural Network Construction with TensorFlow
Use LSTM neural networks for sequential, time-series prediction:
import tensorflow as tf
from tensorflow.keras.models import Sequential
from tensorflow.keras.layers import LSTM, Dense, Dropout
model = Sequential( , X.shape )),
Dropout(0.2),
LSTM(32, activation='relu'),
Dense(1)
])
model.compile(optimizer='adam', loss='mse')
________________________________________
🎯 Step 7: Training the Neural Network
history = model.fit(X, y, epochs=50, batch_size=32, validation_split=0.2)
________________________________________
📊 Step 8: Evaluating Model Performance
Visualize actual vs. predicted prices:
import matplotlib.pyplot as plt
predictions = model.predict(X)
plt.plot(y, label='Actual Price')
plt.plot(predictions, label='Predicted Price')
plt.xlabel('Time Steps')
plt.ylabel('Gold Price')
plt.legend()
plt.show()
________________________________________
🚦 Step 9: Developing a Trading Strategy
Translate predictions into trading signals:
def trade_logic(predicted, current, threshold=0.3):
diff = predicted - current
if diff > threshold:
return "Buy"
elif diff < -threshold:
return "Sell"
else:
return "Hold"
latest_data = X .reshape(1, X.shape , X.shape )
predicted_price = model.predict(latest_data)
current_price = data .iloc
decision = trade_logic(predicted_price, current_price)
print("Trading Decision:", decision)
________________________________________
⚙️ Step 10: Real-Time Deployment
Automate the model for live trading via broker APIs (pseudocode):
while market_open:
live_data = fetch_live_gold_data()
live_data_processed = preprocess(live_data)
prediction = model.predict(live_data_processed)
decision = trade_logic(prediction, live_data )
execute_order(decision)
________________________________________
📅 Step 11: Backtesting
Use frameworks like Backtrader or Zipline to validate your strategy:
import backtrader as bt
class NNStrategy(bt.Strategy):
def next(self):
if self.data.predicted > self.data.close + threshold:
self.buy()
elif self.data.predicted < self.data.close - threshold:
self.sell()
cerebro = bt.Cerebro()
cerebro.addstrategy(NNStrategy)
# Add data feeds and run cerebro
cerebro.run()
________________________________________
🔍 Practical Use-Cases
• ⚡ Momentum Trading: EMA crossovers, validated by neural network.
• 🔄 Mean Reversion: Trade at Bollinger Band extremes, validated with neural network predictions.
• 🌩️ Volatility-based: Use ATR plus neural net for optimal entry/exit timing.
________________________________________
🛠 Additional Recommendations
• Frameworks: TensorFlow/Keras, PyTorch, scikit-learn
• Real-time monitoring and risk management are crucial—use volatility indicators!
________________________________________
📚 Final Thoughts
This practical guide arms you to build, deploy, and manage a neural network-based intraday gold trading system—from data acquisition through backtesting—ensuring you have the tools for robust, data-driven, and risk-managed trading strategies.
________________________________________

Update of the Bullish/Bearish Catalysts for Gold prices________________________________________
⚡️ Gold’s Pullback: A Reset, Not the End
After peaking above $3,500/oz in April, gold’s slide back toward $3,210 marks a sharp—but not unusual—correction. What’s changed in the gold narrative? The rapid unwinding of panic bids as the Fed stays hawkish, the dollar flexes, and risk appetite returns. But beneath the surface, multiple structural drivers—old and new—are shaping gold’s next act.
________________________________________
1. Fed “Higher for Longer” Policy Bias (9/10)
Still the #1 driver.
With inflation sticky and the U.S. labor market robust, the Federal Reserve’s reluctance to cut rates (4.25–4.50%) is pinning real yields near multi-year highs. This erodes the appeal of non-yielding assets like gold, particularly for Western investors.
🦅 Watch for any dovish shift—a single Fed pivot could reignite gold fast.
________________________________________
2. U.S. Dollar Resilience (8.5/10)
The DXY recently surged above 101, buoyed by relative U.S. growth outperformance and ongoing EM weakness. Since gold is dollar-priced, a strong greenback makes gold more expensive for non-dollar buyers, crimping global demand.
💵 Sustained dollar strength could push gold closer to $3,100 unless countered by inflation or new geopolitical stress.
________________________________________
3. Central Bank Buying & “De-Dollarization” Flows (8/10)
This is the new wild card.
Countries like China, India, Turkey, and Russia are accelerating gold reserves accumulation—partly to hedge against dollar-centric sanctions and diversify away from U.S. Treasuries. Q2 2025 data shows a 35% jump in net central bank purchases year-on-year.
🏦 This bid underpins the gold market even when ETFs and retail are sellers.
________________________________________
4. U.S.–China Trade Normalization (7.5/10)
The May 2025 Geneva agreement was a big de-risking event. While tariffs haven’t vanished, steady progress on tech and agriculture reduces tail risk for global trade, putting downward pressure on gold’s safe-haven premium.
🌏 Any breakdown or tariff surprise could quickly reverse this.
________________________________________
5. Algorithmic & Quant Trading Flows (7/10)
Gold’s volatility is now heavily influenced by systematic funds. CTA (commodity trading advisor) and quant-driven selling accelerated the recent drop once $3,300 was breached. This non-fundamental selling creates overshoots—but also sharp reversals on technical bounces.
🤖 Expect snapbacks when positioning reaches extremes.
________________________________________
6. U.S.–U.K. & EU Trade Deals (6.5/10)
Both deals have reduced the global uncertainty premium. While the economic impact is moderate, improved global relations have pushed capital into equities and away from gold.
🇬🇧 Keep an eye on political risk, especially if new tariffs or Brexit-related shocks re-emerge.
________________________________________
7. India–Pakistan and Middle East Geopolitical Risks (6.5/10)
Tensions have cooled, but remain a latent driver. The India–Pakistan border saw restraint in May; Iran–U.S. talks are “cautiously positive.” Any surprise flare-up, especially involving oil, can quickly restore gold’s safe-haven bid.
🕊️ Event-driven spikes likely, but not sustained unless escalation persists.
________________________________________
8. ETF Flows, Retail & Institutional Demand (6/10)
ETF inflows have slowed sharply in 2025, but central bank and Asian buying partly offset this. U.S. retail interest has faded due to higher Treasury yields, but any sign of real rates rolling over could spark new inflows.
📈 ETF demand is now more a symptom than a cause of price moves.
________________________________________
9. Technological Demand & Jewelry Trends (5.5/10)
Longer-term, gold’s use in electronics, EVs, and green tech is rising modestly (up ~3% YoY). Indian and Chinese jewelry demand—seasonally soft now—could rebound late 2025 if income and sentiment recover.
📿 Not a short-term driver, but a steady tailwind in the background.
________________________________________
10. Fiscal Risk & U.S. Debt Sustainability (5.5/10)
Rising concerns about the U.S. debt trajectory, especially if deficits widen or the U.S. nears a shutdown or downgrade, can trigger flight-to-quality bids for gold. This is not the main driver now, but is a key “black swan” risk if Treasury auctions stumble.
💣 Could move up the list rapidly on negative headlines.
________________________________________
🌐 Other Catalysts to Watch:
• Israel – Iran tensions in the Middle East – limited impact on gold prices.
• Crypto Market Volatility (5/10): Periods of sharp crypto drawdowns have triggered some rotation into gold, but the correlation is inconsistent.
• Chinese Real Estate Stress (5/10): Signs of further slowdown or crisis (e.g., major developer defaults) could boost gold as a defensive play in Asia.
• Physical Supply Disruptions (4/10): Mine strikes, export restrictions, or transport bottlenecks can create localized price spikes, but rarely move the global market for long.
________________________________________
🏆 2025 Gold Catalyst Rankings (with Impact Scores)
Rank Catalyst Strength/10 Current Impact Direction Notes
1 Fed “Higher for Longer” Policy 9.0 Very High Bearish Key yield driver
2 U.S. Dollar Resilience 8.5 Very High Bearish Hurts non-USD demand
3 Central Bank & “De-Dollarization” Buying 8.0 High Bullish Structural support
4 U.S.–China Trade Normalization 7.5 High Bearish De-risks global trade
5 Algorithmic/Quant Trading Flows 7.0 High Bearish Magnifies volatility
6 U.S.–U.K./EU Trade Deals 6.5 Moderate Bearish Risk appetite rising
7 India–Pakistan/Mideast Geopolitics 6.5 Moderate Neutral Event risk
8 ETF, Retail & Institutional Flows 6.0 Moderate Bearish Trend follower
9 Tech/Jewelry Physical Demand 5.5 Low Bullish Seasonal uptick possible
10 U.S. Debt/Fiscal Sustainability 5.5 Low Bullish Potential tail risk
11 Crypto Market Volatility 5.0 Low Bullish Risk-off flows (sometimes)
12 China Property Crisis 5.0 Low Bullish Asian safe-haven buying
13 Physical Supply Disruptions 4.0 Very Low Bullish Rare but possible
________________________________________
🚦Where Next for Gold?
• Current price: ~$3,210/oz
• Key support: $3,150/oz
• Key upside triggers: A dovish Fed surprise, sharp dollar reversal, sudden geopolitical event, or central bank “buying spree.”
• Risks: Extended strong dollar, yield spike, no escalation of global risks.
________________________________________
Summary Table: 2025 Gold Price Catalysts Comparison
Catalyst 2024 Score 2025 Score Change Impact Direction (2025) Commentary
Fed Rate Policy 9 9 – Bearish Unchanged, still dominant
U.S. Dollar 8 8.5 ↑ Bearish Gained in strength
Central Bank Buying 7 8 ↑ Bullish Grown in importance, especially in Asia
U.S.-China Trade 7.5 7.5 – Bearish Still relevant, deal holding for now
Algorithmic/Quant Flows 6 7 ↑ Bearish Systematic trading influence is rising
Geopolitics (excl. Russia/Ukraine) 6 6.5 ↑ Neutral Slight increase, mostly latent risks
ETF/Institutional Flows 5 6 ↑ Bearish Slower, but still influential
Jewelry/Tech Demand 4.5 5.5 ↑ Bullish Tech/jewelry more important now
U.S. Debt/Fiscal Risk 5 5.5 ↑ Bullish Gaining attention with deficit concerns
Crypto Market Volatility 4 5 ↑ Bullish Correlation growing, but inconsistent
China Property Risk N/A 5 NEW Bullish Added due to emerging Asian risk
Physical Supply Disruption 3.5 4 ↑ Bullish Minor, only spikes on rare events
________________________________________
🥇 Bottom Line:
Gold’s retreat reflects a rebalancing of risk and yield, but the stage is set for sudden moves—especially if the Fed blinks, the dollar falters, or new shocks emerge. The top three catalysts (Fed, Dollar, Central Bank buying) are especially worth watching as we head into the second half of 2025.

Despite ongoing supply restrictions PPLT trendsAs uncertainty in US equity and job future rises a trend appears in precious metals and bonds. The demand for natural resources continues to grow despite tariff concerns. Trumps PGM policies threatened to shake the market, however, majority of platinum is mined in countries with less strict tariff restrictions and even in the US.; infact, South Africa is the largest producer of platinum with Zimbabwe holding significant reserves, Russia is also a leading force. In addition to Canada- where an independent researcher Jayanth Chennamangalam is exploring the legalities of an exploration to mine platinum in space from craters on the moon. Both PPLT and PLTM have seen resent up growth, trying to push back to their highs of the early 2020s. I have taken the mean of 7 angles representing our highest and lowest points at approx 50°or greater and attached it to our new low- the cross section of this angle and the resistance point drawn from our all time high estimate we are ahead of schedule for reaching our all time high in Sept 2025.
"Within our updated palladium forecasts to 2029f, we expect market deficits to last until 2027f (previously 2025f) before market surpluses gradually build from 2028f. Given ongoing uncertainties, this report does not fully capture the impact of Trump’s policies on PGM demand, but we do not expect them to be of sufficient magnitude to materially change the platinum and palladium deficits laid out herein. "
(platinuminvestment.com)
We could have anticipated this upcoming growth by paying close attention to the K line cross and divergence on our Stochastic oscillator (14,3,3).
"C:\Users\ChrisPC\Downloads\PPLT_2025-06-12_15-47-20.png"

TOP 10 Stats of the Current Gold Bull Market in 2025 and Outlook📊 Top 10 Stats of the Current Gold Bull Market (2025)
1. 🥇 Gold price per ounce: Around $3,338–$3,364, with a recent all-time high above $3,500 in April 2025
2. 📈 Year-to-date gain: About +29% in 2025 so far, after a +30% gain in 2024
3. 🏦 Central bank buying: More than 1,000 tonnes bought for the fourth straight year, reserves near record levels
4. 🔒 Inflation hedge: Strong inverse correlation with real yields; high demand driven by inflation and geopolitical worries
5. 📊 Gold vs S&P 500: Both reached new highs together; gold is up about 27% YTD while the S&P 500 is up only around 2%
6. 💍 Jewellery demand: Global gold jewelry demand is down about 9% in 2024, projected to drop another 16% in 2025 due to high prices
7. ⚖️ Gold-to-silver ratio: Now around 94, down from a peak of 105—showing silver is regaining ground
8. 🏅 Record closes: More than 40 record daily closes for gold in 2025, prices consolidating around $3,290–$3,400
9. 🏛️ Technical breakout: Broke out of a 13-year “cup-and-handle” technical pattern in March 2024
10. 🔮 2025 forecasts: Predictions range from $3,600–$4,000 by Q2 2026, with some expecting as high as $4,500 if risks rise
________________________________________
🔄 How This Gold Bull Market Compares to Past Bull Markets
1️⃣ 1968–1980 Super Bull
• 🕰️ Gold climbed from ~$35 to ~$850, a massive 2,330% gain over 12 years
• 🔥 Driven by double-digit inflation, end of the gold standard, and political turmoil
• ⚠️ Huge corrections, including a nearly 45% drop in 1974–76, but rapid rebounds
2️⃣ 1999–2008 Bull Market
• 💹 Gold surged from ~$252 to ~$1,023 (about +305%) in 9 years
• 🚀 Fueled by the commodities supercycle and concerns about global imbalances
• 📉 Big correction during the 2008 financial crisis, but gold rebounded fast
3️⃣ 2018–2025 (Current Cycle)
• ⏳ Gold broke out in 2024 from a 13-year sideways base
• 💥 Up nearly 200% from the 2018 lows to over $3,500
• 🏦 Central banks are the biggest buyers, unlike earlier cycles
• 🛡️ Corrections have been milder—2022 saw only a 20% drop
• 🏃♂️ Fast recovery: new highs reached within months, not years
________________________________________
📊 Quick Comparison Table
Metric 1968–80 Super Bull 1999–2008 Bull 2018–2025 Current
🚀 Total Gain ~2,330% ~305% ~200% so far
⏲️ Length 12 years 9 years 7 years so far
💔 Biggest Drawdown –45% (1974–76) –30% (2008) –20% (2022)
🏦 Central Bank Role Moderate Emerging Dominant
📉 Correction Speed Years to recover 4 years Months
🏛️ Technical Pattern Secular breakout Multiple peaks Broke 13-yr base
________________________________________
🧭 What Makes the Current Bull Market Unique
• 🏦 Central banks are setting the pace with record-breaking demand
• 🩹 Corrections are less severe and recoveries are quicker
• 📈 Gold is rallying alongside stocks, which is rare historically
• 🏛️ The breakout from a 13-year consolidation signals strong structural support
• 🔮 Major forecasts predict further highs through 2026, suggesting this may become one of the strongest cycles ever

Platinum 10 years accumulation 2 000 USD Overview of Catalysts
Here’s a detailed look at the top 10 key catalysts influencing platinum prices—and how they stack up on a 0–10 impact scale 🎯.
1. Supply Deficits (Mining Shortfalls) ⛏️
Trend: Persistent structural deficits—the largest since 2013—with a projected deficit of \~598 koz in 2024.
Drivers: Declining output in South Africa and Russia, underinvestment, and aging mines.
Impact Score: 10/10 – Direct upward pressure on price.
2. Industrial Demand & Green-Energy Growth 🏭
Trend: Industrial consumption is booming, with strong growth in sectors like wind turbines, glass, and electronics.
Support: This broad demand fuels a large part of the supply deficit, and goes well beyond automotive use.
Impact Score: 9/10 – Strong structural support.
3. Auto Catalyst Substitution (Pd → Pt) 🔄
Trend: Cost-effective substitution as platinum approaches price parity with palladium; significant volume was substituted in 2023, with more projected for 2024.
Significance: Boosts automotive demand in an area previously dominated by palladium.
Impact Score: 8/10.
4. Electric Vehicle Adoption (EVs) ⚡
Trend: EVs don’t use platinum in catalytic converters, which is a structural hit to demand as EV growth continues.
Significance: Long-term downside pressure.
Impact Score: 7/10.
5. Hydrogen Fuel Cell Demand 💧
Trend: Hydrogen vehicles use platinum, with projected demand growth toward 2030.
Limitations: Growth remains slower than battery EVs.
Impact Score: 6/10.
6. Recycling Constraints 🔄
Trend: Recycling, which provides about a quarter of supply, is falling due to fewer end-of-life vehicles and glass, reducing the supply buffer.
Market Effect: This amplifies supply tightness.
Impact Score: 6/10.
7. Chinese Emission Policies 🏭
Trend: China’s tightening emissions regulations are supporting demand, with end uses well protected against a slowdown.
Importance: China is the largest platinum user; policy gives stability.
Impact Score: 7/10.
8. Jewellery & Investment Trends 💍
Trend: Jewellery demand remains steady, and investment demand is rising.
Note: This is a smaller demand segment, but it is supportive.
Impact Score: 5/10.
9. Macroeconomic & Auto Production Outlook 📉
Trend: Weak global auto production is lowering platinum use, but recovery in auto could lift demand.
Aftermath: Economic rebound could support prices.
Impact Score:** 5/10.
10. Speculative Sentiment & Positioning 📈
Trend: Inventories are depleted; investors are waiting for a breakout.
Tipping Point: A price surge could spark momentum-driven demand.
Impact Score:** 4/10.
| Rank | Catalyst | Score (/10) |
| ---- | ---------------------------------- | ----------- |
| 1 | Supply Deficit | 10 |
| 2 | Industrial / Green-Energy Demand | 9 |
| 3 | Auto Catalyst Pd → Pt Substitution | 8 |
| 4 | EV Adoption (Negative Impact) | 7 |
| 5 | Chinese Emission Policies | 7 |
| 6 | Hydrogen Fuel Cell Growth | 6 |
| 7 | Recycling Constraints | 6 |
| 8 | Jewellery & Investment Demand | 5 |
| 9 | Macro Slowdowns / Auto Production | 5 |
| 10 | Speculative Positioning | 4 |
📌 Key Insights & Outlook
* Tight supply and diversified demand—especially from green energy and industrial sectors—are the strongest bullish forces for platinum.
* Auto-driven substitution offers further upside, while EV growth and recycling limitations act as constraints.
* Chinese regulations add resilience; hydrogen offers potential if growth accelerates.
* Jewellery and investment flows remain minor but supportive.
* Much depends on auto sector recovery and investor psychology—momentum effects could amplify gains if technical levels break.
🔮 Final Take
Platinum remains positioned for medium-term strength, thanks to severe supply tightness and robust non-auto demand drivers. For investors, key areas to watch are further deficits, industrial trends, and catalytic substitution. Be mindful of potential headwinds from EV adoption and macroeconomic softness, but the structural case remains compelling.


Platinum's Quiet Ascent: What Drives Its New Value?Platinum, often operating in the shadow of gold, has recently experienced a significant surge in value, reaching multi-year highs and capturing considerable investor attention. This resurgence is not arbitrary; it stems from a complex interplay of industrial demand, tightening supply, evolving geopolitical dynamics, and a notable shift in investment sentiment. Understanding these underlying forces becomes crucial for investors seeking to decipher the trajectory of this vital industrial precious metal.
A primary catalyst for platinum's price rally is its strong industrial utility, particularly within the automotive sector, where it remains indispensable for catalytic converters. While the rise of battery electric vehicles presents a long-term shift, the robust growth in hybrid vehicle production continues to sustain demand. Critically, the market faces persistent physical deficits, with supply consistently falling short of demand for the past two years, a trend projected to continue into 2025. Mine output struggles due to disruptions in key producing regions, such as South Africa and Zimbabwe, and secondary supply from recycling has proven insufficient to bridge the growing gap.
Geopolitics and strategic investment further amplify platinum's upward trajectory. China has emerged as a pivotal market, with a sharp rebound in demand as consumers increasingly favor platinum for both jewelry and investment amidst record gold prices. This strategic pivot by the world's largest consumer market is reshaping global platinum price discovery, supported by China's initiatives to develop new trading ecosystems and futures contracts. Concurrently, renewed investor confidence is evident in growing inflows into platinum Exchange-Traded Funds (ETFs) and robust physical buying, with anticipated lower borrowing costs also enhancing its appeal.
In essence, platinum's current rally reflects a powerful combination of tightening supply and resilient industrial demand, underscored by strategic shifts in major consumer markets and renewed investor interest. As above-ground stocks gradually deplete and the market anticipates continued deficits, platinum is poised for a sustained period of relevance, offering compelling prospects for those who recognize its multifaceted value proposition.

Bitcoin Breaks below $102,500 Support : Watch For RejectionIf you have been following my research on Bitcoin, you already know I published a prediction of a Double-Top pattern and a potential breakdown in Bitcoin on May 20, 2025.
TradingView selected this video as an Editor's Pick and it received thousands of views.
Thank you for all the great comments and questions from everyone.
Now, after about 3+ Weeks, we are starting to see BTCUSD move below my $102,500 support level (my breakdown level) and this could be the start of a broad downward price phase for BTCUSD and US/Global assets.
If you have followed any of my longer-term research, you'll quickly understand why I believe the US markets will struggle through most of 2025 as the world attempts to adjust to Trump leadership. This uncertainty will likely result in a sideways-consolidation phase in many global markets and a disruption of hard and soft assets.
In this regard, you can read the content of my original post (May 20).
Right now, I want to warn you that an immediate price rejection of the breakdown move is likely - possibly targeting $105k or higher.
This type of rejection is very common before price makes a much bigger move. So, be prepared for BTCUSD to attempt to reject and move back above $105k, then stall and break downward very hard - trying to move below $80k in an initial downward price phase.
It's going to be very interesting to see how this plays out with my broad cycle research. I'm still expecting a July 2025 and October 2025 MAJOR LOW cycle phase to play out.
Buckle up.
Get some
#trading #research #investing #tradingalgos #tradingsignals #cycles #fibonacci #elliotwave #modelingsystems #stocks #bitcoin #btcusd #cryptos #spy #gold #nq #investing #trading #spytrading #spymarket #tradingmarket #stockmarket #silver

SHORT ON XPT/USD PLATINUMXPT/USD Platinum has given us a choc (change of character) to the downside from a recent push up.
It has currently completed the pullback of that new change to the downside and I expect it to fall from the supply area/zone to the next level of demand.
Lost of imbalance to the downside making this trade a nice setup.

Weak DXY Will Not Let Metals Correct! - Metals AnalysisWeak DXY is giving gold a hard time o make a final flushout before 3950-4350

XPT/USD "The Platinum" Metals Market Bull Heist Plan (DAY Trade)🌟Hi! Hola! Ola! Bonjour! Hallo! Marhaba!🌟
Dear Money Makers & Robbers, 🤑 💰💸✈️
Based on 🔥Thief Trading style technical and fundamental analysis🔥, here is our master plan to heist the XPT/USD "The Platinum" Metals Market. Please adhere to the strategy I've outlined in the chart, which emphasizes long entry. Our aim is to escape near the high-risk ATR Zone. Risky level, overbought market, consolidation, trend reversal, trap at the level where traders and bearish robbers are stronger. 🏆💸"Take profit and treat yourself, traders. You deserve it!💪🏆🎉
Entry 📈 : "The vault is wide open! Swipe the Bullish loot at any price - the heist is on!
however I advise to Place buy limit orders within a 15 or 30 minute timeframe most recent or swing, low or high level for Pullback entries.
Stop Loss 🛑:
📍 Thief SL placed at the recent/swing low level Using the 4H timeframe (935.000) Day trade basis.
📍 SL is based on your risk of the trade, lot size and how many multiple orders you have to take.
🏴☠️Target 🎯: 1015.000 (or) Escape Before the Target
🧲Scalpers, take note 👀 : only scalp on the Long side. If you have a lot of money, you can go straight away; if not, you can join swing traders and carry out the robbery plan. Use trailing SL to safeguard your money 💰.
💰💵💴💸XPT/USD "The Platinum" Metals Market Heist Plan (Day / Swing Trade) is currently experiencing a bullishness🐂.., driven by several key factors.👆👆👆
📰🗞️Get & Read the Fundamental, Macro Economics, COT Report, Geopolitical and News Analysis, Sentimental Outlook, Intermarket Analysis, Supply and Demand Factors, Future trend targets with Overall outlook score... go ahead to check👉👉👉🔗🔗🌎🌏🗺
⚠️Trading Alert : News Releases and Position Management 📰 🗞️ 🚫🚏
As a reminder, news releases can have a significant impact on market prices and volatility. To minimize potential losses and protect your running positions,
we recommend the following:
Avoid taking new trades during news releases
Use trailing stop-loss orders to protect your running positions and lock in profits
💖Supporting our robbery plan 💥Hit the Boost Button💥 will enable us to effortlessly make and steal money 💰💵. Boost the strength of our robbery team. Every day in this market make money with ease by using the Thief Trading Style.🏆💪🤝❤️🎉🚀
I'll see you soon with another heist plan, so stay tuned 🤑🐱👤🤗🤩

Is this a platinum breakout?Using a weekly chart of a platinum ETF.
Breaking out above it's triangle pattern. Needs confirmation though or retrace in the next coming months

Platinum: The New Gold for the Next Decade?For centuries, Gold has been the ultimate store of value, a safe haven in times of economic uncertainty. However, as Gold potentially enters a multi-year distribution phase, investors may need to look elsewhere for the next big opportunity. Enter Platinum, a metal that is rarer, more versatile, and increasingly relevant in the modern industrial landscape.
Gold’s Distribution Phase and Bitcoin’s Speculative Nature
Gold has historically been a hedge against inflation and economic downturns, but recent trends suggest it may be topping out. Central banks have been stockpiling Gold, yet its price movements indicate a possible stagnation. Meanwhile, Bitcoin, once hailed as "digital gold," has shown extreme volatility, largely driven by speculation and relentless social media hype. Unlike Gold, Bitcoin lacks intrinsic value, and its future remains uncertain as institutional interest fluctuates.
Why Platinum Stands Out
Platinum is 30 times rarer than gold and has been in an accumulation phase since 2015. Unlike Palladium, which is highly volatile, Platinum maintains a more stable price structure. Its industrial applications make it indispensable in sectors such as:
Automotive Industry : Used in catalytic converters to reduce emissions.
Clean Energy & Hydrogen Economy : Essential in fuel cells for green energy.
Cloud Computing & Electronics : Platinum’s conductivity makes it valuable in advanced computing.
Space Exploration & Aerospace : Its resistance to extreme temperatures makes it ideal for high-tech applications.
Medical & Biomedical Uses : Found in cancer treatments and medical implants.
The Future of Platinum
With global trends shifting toward industrialization and sustainability, platinum’s demand is set to rise. Supply constraints, primarily due to limited mining operations in South Africa, further add to its scarcity. As gold enters a distribution phase, platinum is positioned to take off, potentially becoming a new standard for wealth preservation and industrial utility.
TVC:PLATINUM TVC:PALLADIUM TVC:GOLD TVC:SILVER MARKETSCOM:BITCOIN TVC:DXY SP:SPX EURONEXT:N100 BITSTAMP:BTCUSD OANDA:XAUUSD OANDA:XPTUSD OANDA:XPDUSD OANDA:XAGUSD

Why Palladium Is the Smart Play Right NowGold is hitting record highs, and silver is riding the wave—but smart investors know that diversification is key. While everyone is chasing gold, Palladium and Platinum are quietly setting up for a massive opportunity.
🔹 Palladium’s Market Position
✅ Palladium is rarer than gold—annual production is significantly lower.
✅ Industrial demand is surging, especially in automotive catalytic converters.
✅ Supply constraints due to geopolitical factors and mining limitations.
🔹 Palladium’s Role in the Green Revolution
🌍 Palladium is critical for reducing vehicle emissions—used in catalytic converters to meet stricter environmental regulations.
⚡ Hydrogen fuel cells and clean energy tech are increasing demand for Palladium.
🔋 Electronics & semiconductor industries rely on Palladium for conductivity and durability.
🔹 Gold Is at the Top—Time to Rotate?
📈 Gold is at all-time highs, making it expensive for new investors.
📉 Palladium has corrected from its highs, creating a buying opportunity.
💡 Diversifying into Palladium & Platinum now could be a strategic hedge against gold’s potential pullback.
🔹 Palladium’s Supply Crunch
⛏️ Russia & South Africa control most of the world’s Palladium supply—geopolitical risks could tighten availability.
📉 Mining output is declining, while demand remains strong.
💰 Lower supply + rising demand = price surge potential.
🔹 Platinum: The Underrated Hedge
💎 Platinum is historically undervalued compared to gold & Palladium.
🚗 EV & hydrogen fuel cell adoption could drive Platinum demand higher.
📊 Platinum-to-Gold ratio suggests Platinum is deeply discounted.
🔹 Final Thoughts
Gold is great, but smart investors look ahead. Palladium and Platinum are positioned for growth, with strong industrial demand, supply constraints, and undervaluation compared to gold.
📢 Now is the time to accumulate Palladium & Platinum before the market catches on.
TVC:PALLADIUM TVC:PLATINUM TVC:GOLD TVC:SILVER
