Platinum Futures: Time to change direction to bullish?Platinum is at a long term log down trend line from 2008. With the US dollar now falling I favor this line will soon be broken and uptrend begin. Technical observations that support this idea are: 1. Bullish divergence in the monthly RSI. 2. Huge up volume on the last price drop (seen monthly chart). Volume spikes often occur at tops and bottoms. 3. Less important but I think the EWT count is favorable. They may be a brief pullback before a up surge but maybe not.
I see the first target at about 1320, but IFFFFF analysis is correct it may someday exceed the 2300 high.
Take care. Process and trade your way.
Feedback always welcome.
Platinum

#Gold : Possible bull pennant setup comingKeep a eye on the price action of Gold here
We may form a bull pennant.


Palladium looking like it wants to Roll OVERTA:
Balance of Power indicator looks like it has made a reversal, when that happens we consequently dump but that is a sign of institutional buying pressure- as the sell pressure is rotated to a small percent of the market buying the cheaper lot.
At an important traditional and Fibonacci level- therefore if we don't break above expect a retracement in the green zone which is marked by Fibonacci sequencing.
-Megalodon (Rahim)
Stay Safe, Trade Safe
You are welcome to share your ideas below :)
FX_IDC:XPDGBP

Platinum Update: Profit=128513 SL=19901 Reward/Risk > 6.5:1 Trade Setup summary:
Profit targets=128513 pip (4059 + 6584 + 9744 + 15994 + 23224 + 29189 + 39719)
Stop Loss =19901 pip
Reward/Risk > 6.5: 1
Current Status:
Total Profit: 122387 pip
Closed trade(s): 20387 pip Profit
Open trade(s): 51000 pip Profit
Trade Setup:
We opened 7 BUY trade(s) @ 805.00 based on 'previous Forecast' at 2020.07.06 :
Closed Profit:
TP1 @ 837.90 touched at 2020.07.22 with 4059 pip Profit.
TP2 @ 863.15 touched at 2020.07.21 with 6584 pip Profit.
TP3 @ 894.75 touched at 2020.07.06 with 9744 pip Profit.
4059 + 6584 + 9744 = 20387
Open Profit:
Profit for one trade is 907.00(current price) - 805.00(open price) = 10200 pip
4 trade(s) still open, therefore total profit for open trade(s) is 10200 x 4 = 51000 pip
Break-Even 805.00
Technical analysis:
. Platinum is in a range bound and the beginning of uptrend is expected.
. The price is below the 21-Day WEMA which acts as a dynamic resistance.
. The RSI is at 70 .
Trading suggestion:
. There is still a possibility of temporary retracement to suggested support line (863.15) again. if so, traders can set orders based on Price Action and expect to reach short-term targets.
Take Profits:
TP4= @ 957.25
TP5= @ 1029.55
TP6= @ 1089.20
TP7= @ 1194.50
SL= Break below 837.90
❤️ If you find this helpful and want more FREE forecasts in TradingView
. . . . . Please show your support back,
. . . . . . . . Hit the 👍 LIKE button,
. . . . . . . . . . . Drop some feedback below in the comment!
❤️ Your Support is very much 🙏 appreciated!❤️
💎 Want us to help you become a better Forex trader?
Now, It's your turn!
Be sure to leave a comment let us know how do you see this opportunity and forecast.
Trade well, ❤️
ForecastCity English Support Team ❤️


XPT/USD (Platnium)XPTUSD (PLATNIUM) Possible Head and Shoulders Reversal Pattern
Long Period Of Consolidation
Wait for a break of this current consolidation and enter at the Head which is at 910.00 or wait for the confirmation of the Right Shoulder
Patience , let's see what price does


Platinum flag breakBreak of the flat above $840 targets $860 first. Next level of resistance at $900.

XPT USD BUY (PLATINUM - US DOLLAR)Hi there. Price is forming a continuation pattern to the upside. Wait for the price to complete the pattern and watch strong price action for buy.

Precious Metals Continue to ShineFirstly, please support our work by clicking like button or following! These really assist us to reach more investors & traders like you!
The fundamentals for precious metals have not yet changed from previous week. Kindly check the previous week's analysis.

XPTUSD Detailed Analysis - Long SetupYellow zones- critical zones based on the monthly time frame
Red zones- critical zones based on the daily time frame
Blue zones – critical zones based on the 4h time frame
According to the latest COT Report Platinum may be going for some bearish momentum, due to the increase of short contracts. Historically looking, the COT contract size area that we are in, has high chances to reverse towards higher quantities of long contracts.
From a monthly perspective XTPUSD has been in a closed triangle structure since 2008 and we can finally see its end. But before that another touch towards its upper-trendline must happen. The monthly critical plays the role of the bottom part of this closed triangle. On the monthly time frame, February reached new unnatural lows which got rejected strongly and the price returned once again to the monthly critical zone.
Since the end of May, XPTUSD is in a range that formed a wide-angle formation. A critical moment of this scenario will be the 800.000 level. We need to see a strong rejection there. A good entry point will be the correction from the daily critical area towards the 4h critical one.
A second critical point is the daily critical area around the 860.00 mark. It can be viewed not only as a support/resistance zone, but it also aligns perfectly with the 0.618 Fibonacci retracement from the price drop in March.
Our target will be the psychological 1000.000 mark. This needs to happen in order to reach the equilibrium price of this pair.
If the crisis deepens the usage of Platinum will likely jump and logically its price as well. It is used in many industries that will stay unaffected from a future crisis.
If you liked my analysis or you want to continue the discussion- feel free to leave a like and a comment. Thank you!
Happy trading!

XPT/USD 7/8/2020Welcome to this analysis of XPT/USD.
Platinum has been in an uptrend since the capitulation low on the 19th of March.
Price rallied from 565$ to 860$ but on 21st of May but it faced some resistance there and went sideways for over a month. Looking at the consolidation it looks like the price has made a falling channel Bull flag that got activated yesterday by a break and close above 837$. The target of the Bull flag is around 975$ as long as it stays above 800$.
There are a few levels of resistance between the current price and the target, which are the previous high at 861$, followed by an order block around 910$ which is an equilibrium of a range as well and the 954$ level.
This trade idea has almost 4 rewards to risk ratio.
Good luck trading.

Bullish Charts - Uranium PlayCameco Corporation produces and sells uranium. The company operates in two segments, Uranium and Fuel Services. The Uranium segment is involved in the exploration for, mining, and milling, as well as purchase and sale of uranium concentrate. Its operating uranium property is the Cigar Lake property located in Saskatchewan, Canada. The Fuel Services segment engages in the refining, conversion, and fabrication of uranium concentrate, as well as the purchase and sale of conversion services. This segment also produces fuel bundles and reactor components for CANDU reactors. The company sells its uranium and fuel services to nuclear utilities in the Americas, Europe, and Asia. Cameco Corporation was incorporated in 1987 and is headquartered in Saskatoon, Canada.
Cameco Corporation is one of the world's largest uranium producers, a significant supplier of conversion services and one of two CANDU fuel manufacturers in Canada. Their competitive position is based on their controlling ownership of the world's largest high-grade reserves and low-cost operations. Over the last four quarters, the stock’s earnings surpassed the Zacks Consensus Estimate thrice .
finance.yahoo.com
On May 20, 2020, U.S. Department of Energy rushes to build advanced new nuclear reactors
www.sciencemag.org
On 06/26/20, Cameco issued a press release relating to its win in the appeals court for tax issues. With the court win, Cameco should be receiving over $300 Million back from the Canadian Government plus another $482 million back in letters of credit that Cameco was required to pay as installments.
transferpricingnews.com
The tax court win was a HUGE win for Cameco and will free up hundreds of millions of dollars.
Daily Chart Looks Bullish
Volume, Bullish
PMO, Bullish
MACD, Bullish
Stochastic, Bullish
OBV, Bullish
On 06/30/2020, Raymond James issued an Outperform rating on Cameco.
On 06/25/2020, BMO Capital Markets raised the price target to C$17.00.
Long!
DISCLAIMER
The Content herein is for informational purposes only, you should not construe any such information or other material as legal, tax, investment, financial, or other advice.


There is possibility for the beginning of an up trend in XPTUSDTrading suggestion:
. There is a possibility of temporary retracement to suggested support line (797.31). if so, traders can set orders based on Price Action and expect to reach short-term targets.
Technical analysis:
. Platinum/ USDollar is in a range bound and the beginning of uptrend is expected.
. The ascending flag taking shape suggests we will soon see another leg higher.
. Price is above WEMA21, if price drops more, this line can act as dynamic support against more losses.
. Relative strength index ( RSI ) is 50.
Take Profits:
TP1= @ 837.90
TP2= @ 863.15
TP3= @ 894.75
TP4= @ 957.25
TP5= @ 1029.55
TP6= @ 1089.20
TP7= @ 1194.50
❤️ If you find this helpful and want more FREE forecasts in TradingView
. . . . . Please show your support back,
. . . . . . . . Hit the 👍 LIKE button,
. . . . . . . . . . . Drop some feedback below in the comment!
❤️ Your Support is very much 🙏 appreciated! ❤️
💎 Want us to help you become a better Forex trader ?
Now, It's your turn !
Be sure to leave a comment let us know how do you see this opportunity and forecast.
Trade well, ❤️
ForecastCity English Support Team ❤️

There is possibility for the beginning of an up trend in XPTUSDTrading suggestion:
. There is a possibility of temporary retracement to suggested support line (797.31). if so, traders can set orders based on Price Action and expect to reach short-term targets.
Technical analysis:
. Platinum/USDollar is in a range bound and the beginning of uptrend is expected.
. The ascending flag taking shape suggests we will soon see another leg higher.
. Price is above WEMA21, if price drops more, this line can act as dynamic support against more losses.
. Relative strength index ( RSI ) is 50.
Take Profits:
TP1= @ 837.90
TP2= @ 863.15
TP3= @ 894.75
TP4= @ 957.25
TP5= @ 1029.55
TP6= @ 1089.20
TP7= @ 1194.50
❤️ If you find this helpful and want more FREE forecasts in TradingView
. . . . . Please show your support back,
. . . . . . . . Hit the 👍 LIKE button,
. . . . . . . . . . . Drop some feedback below in the comment!
❤️ Your Support is very much 🙏 appreciated! ❤️
💎 Want us to help you become a better Forex trader ?
Now, It's your turn !
Be sure to leave a comment let us know how do you see this opportunity and forecast.
Trade well, ❤️
ForecastCity English Support Team ❤️

Platinum powerful buy signalsPlatinum, monthly chart: 11 years long(!) support zone + Triple divergence + Morning Star

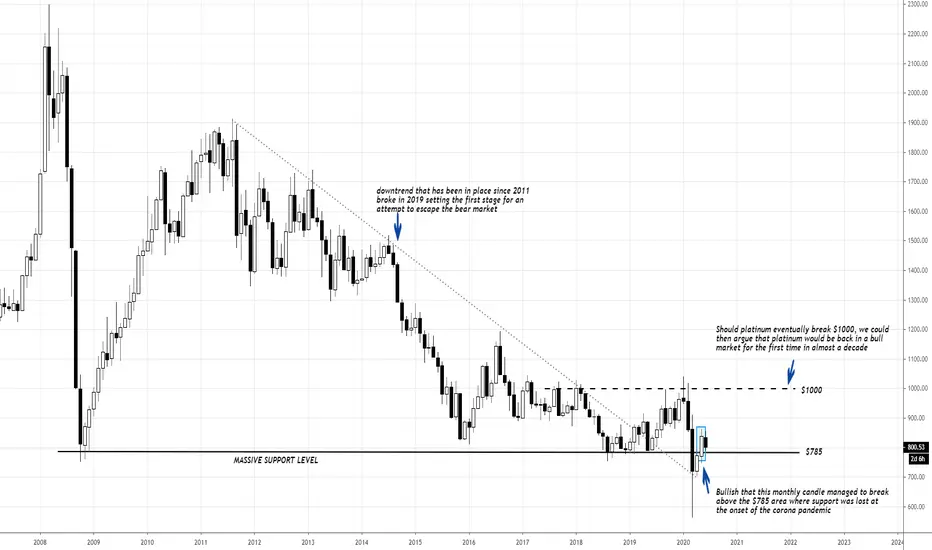
#Observation - Platinum longer term chart looking positiveAs per observations on the chart, the Spot price of Platinum does not look bad at all and seems to be setting up to break the bear market that we have witnessed over the last decade. Still lots of work to do, but early signs are there as per the chart. Above $1000 and we could then argue that the bull market in platinum has once again began..
The South African Platinum shares have traded extremely positive during this pandemic and could well be giving us an indication that the spot price eventually follows higher..
The Greatest Market Analysis of All TimeI feel emphatically sorry for any trader that does not watch the video (link in comments) before market open.... Seriously, if u wanna make money, don't be stupid and neglect such a gem...


When Platinum takes off, you want to be in itIn March 2008, Platinum reached just shy of 3000.00. At the same time, Gold was closer to 1000.00. Take a look at Gold now and also this nice flag on Platinum. I posted to buy it at 600.00, but right now it is setting up to produce a very large higher time frame candle. Remember this is for investing, not scalping.
