How much higher for Platinum futures In this video I look at the current price of platinum on a higher tf and forecast where I believe the cool down to this rally might begin.
Using tools like the fib extension, volume profile and speed fan we are able to highlight a major reaction zone ahead at $1600 region .
Set alerts at these key levels for what might prove to be a solid short entry or a rejection , retest and claim for higher levels like the 1.618 ext .
Platinumsignals

PLATINUM Strong Triangle buy opportunityLast time we looked at Platinum (XPTUSD) was more than 2 months ago (January 30, see chart below) getting our expected rise and hitting the 999.50 Target:
This time the price is at the bottom (Support Zone) of the 11-month Descending Triangle pattern, which is a technical buy opportunity. The last Bullish Leg hit the 0.618 Fibonacci retracement level, while the one before the 0.786.
As a result we have a minimum 985.00 Target on this emerging Bullish Leg.
-------------------------------------------------------------------------------
** Please LIKE 👍, FOLLOW ✅, SHARE 🙌 and COMMENT ✍ if you enjoy this idea! Also share your ideas and charts in the comments section below! This is best way to keep it relevant, support us, keep the content here free and allow the idea to reach as many people as possible. **
-------------------------------------------------------------------------------
💸💸💸💸💸💸
👇 👇 👇 👇 👇 👇

Platinum- While everyone is chasing Gold’s rally, I’ve got my eyes on Platinum.
- That doesn’t mean Gold is a bad investment, it just means it’s already had its moment.
- Platinum feels “delayed,” but its time is coming.
- Observe closely, this simple graph reveals a tightening triangle.
Remember my first rule: Buy the blood, not the moon.
Stay sharp. Diversify. Never go all in.
Happy Tr4Ding

PLATINUM IS COMPLETELY UNDERVALUED, BUY NOW!TVC:PLATINUM CAPITALCOM:PLATINUM
Platinum is absolutely undervalued and is currently trading at only $975 USD.
The Gold to Platinum Ratio just hit a new all time high with the Current Ratio being 3,09 even though Platinum has traded since the 1970s till 2016 at a consistent average of 1:1. Gold's all time low against Platinum was at 0,42 in June 2008; AKA the 'Great Financial Crisis'.
Every single indicator shows that right now is the perfect time to buy Platinum especially because the 'Gold rush' is in its absolute final stages.
Keep in mind that Platinum is around 15 times rarer than Gold on Planet Earth.
May fortune favor the bold, and as always - DYOR NFA ! ;)
CYANE

PLATINUM - Sell Setup at Key Resistance ZoneOANDA:XPTUSD is approaching a significant resistance zone, an area where sellers have previously stepped in to drive prices lower. This area has previously acted as a key supply zone, making it a level to watch for potential rejection.
If price struggles to break above and we see bearish confirmation, I anticipate a pullback toward the $1,021 level.
However, a strong breakout and hold above resistance could invalidate the bearish outlook, potentially leading to further upside.
This is not financial advice but rather how I approach support/resistance zones. Remember, always wait for confirmation before jumping in.
I’d love to hear your perspective in the comments.
Best of luck , TrendDiva

PLATINUM Buy signal on the 1D MA50.Platinum (XPTUSD) is ranged lately within the 1D MA50 (blue trend-line) and 1D MA200 (orange trend-line) but with its 1D RSI rising steadily since the December 30 2024 Low. That was the technical bottom of the Falling Wedge pattern that broke upwards.
As you can see, this has been a very common pattern since September 2023, with all Falling Wedges eventually breaking to the upside to hit at least the 1.618 Fibonacci extension. As a result, our current short-term Target is $999.50.
-------------------------------------------------------------------------------
** Please LIKE 👍, FOLLOW ✅, SHARE 🙌 and COMMENT ✍ if you enjoy this idea! Also share your ideas and charts in the comments section below! This is best way to keep it relevant, support us, keep the content here free and allow the idea to reach as many people as possible. **
-------------------------------------------------------------------------------
💸💸💸💸💸💸
👇 👇 👇 👇 👇 👇

XPT/ USD "PLATINUM" Metals Market Heist PlanHola! Ola! My Dear Robbers / Money Makers & Losers, 🤑 💰
This is our master plan to Heist XPT/ USD "PLATINUM" Metals Market based on Thief Trading style Technical Analysis.. kindly please follow the plan I have mentioned in the chart focus on Long entry. Our target is Red Zone that is High risk Dangerous level, market is overbought / Consolidation / Trend Reversal / Trap at the level Bearish Robbers / Traders gain the strength. Be safe and be careful and Be rich.
Entry 📈 : Can be taken Anywhere, What I suggest you to Place Buy Limit Orders in 15mins Timeframe Recent / Nearest Low Point take entry should be in pullback.
Stop Loss 🛑 : Recent Swing Low using 2H timeframe
Attention for Scalpers : Focus to scalp only on Long side, If you've got a lot of money you can get out right away otherwise you can join with a swing trade robbers and continue the heist plan, Use Trailing SL to protect our money 💰.
Warning : Fundamental Analysis news 📰 🗞️ comes against our robbery plan. our plan will be ruined smash the Stop Loss 🚫🚏. Don't Enter the market at the news update.
Loot and escape on the target 🎯 Swing Traders Plz Book the partial sum of money and wait for next breakout of dynamic level / Order block, Once it is cleared we can continue our heist plan to next new target.
💖Support our Robbery plan we can easily make money & take money 💰💵 Follow, Like & Share with your friends and Lovers. Make our Robbery Team Very Strong Join Ur hands with US. Loot Everything in this market everyday make money easily with Thief Trading Style.
Stay tuned with me and see you again with another Heist Plan..... 🫂

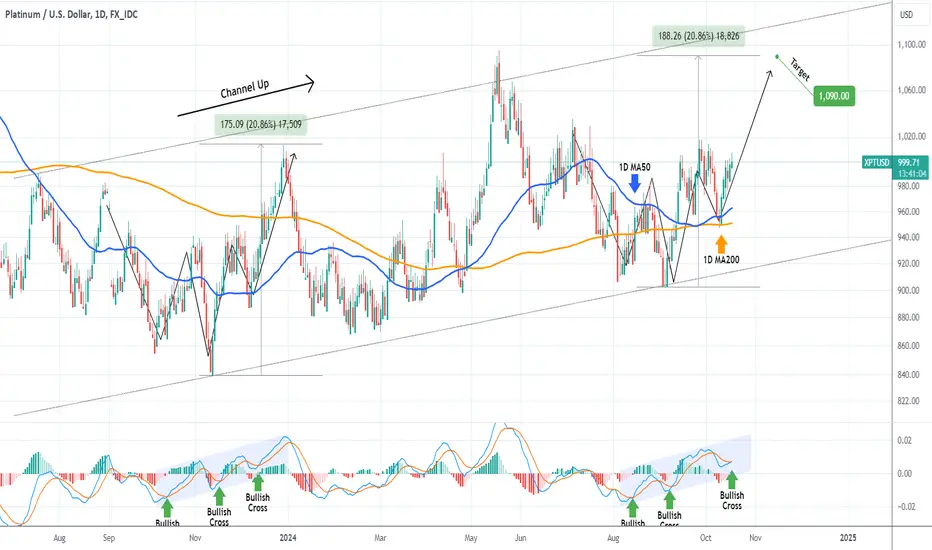
PLATINUM Huge buy opportunity at the bottom of the Channel Up.Platinum (XPTUSD) has been trading within a Channel Up for almost 1.5 year and currently it is testing the pattern's bottom. This process is similar to the Lower Lows bottom sequence of February 12 2024.
As you can see, even the 1D MACD fractals are the same and we are about to post the decisive Bullish Cross that signals the buy. As long as the price remains below the 1D MA50 (blue trend-line), it is a huge long-term buy opportunity.
The previous Bullish Leg hit the 1.236 Fibonacci extension within the Channel Up and peaked above it on the 1.5 Fib ext. As a result, our technical Target is on the modest 1.236 Fib at 1090.
-------------------------------------------------------------------------------
** Please LIKE 👍, FOLLOW ✅, SHARE 🙌 and COMMENT ✍ if you enjoy this idea! Also share your ideas and charts in the comments section below! This is best way to keep it relevant, support us, keep the content here free and allow the idea to reach as many people as possible. **
-------------------------------------------------------------------------------
💸💸💸💸💸💸
👇 👇 👇 👇 👇 👇

Chart Idea - PL Swing Long SetupEntry: 990
SL: 950
TP: 1185
RR: 5:1
Not a Financial Advice!!!
----- DYOR ------

PLATINUM Strong rebound on the 1D MA200.We got a perfect bottom buy entry on Platinum (XPTUSD) last time we analyzed it (August 30, see chart below), with the price already halfway to our 1090 Target:
As you can see, the price action is almost a perfect mirror image of September - December 2023. Now that the price has confirmed the new Bullish Leg with a strong rebound on the 1D MA50 - 1D MA200 zone (blue and orange trend-lines respectively), we can expect it to complete the pattern and complete a +20.86% rise, right where our 1090 Target is.
-------------------------------------------------------------------------------
** Please LIKE 👍, FOLLOW ✅, SHARE 🙌 and COMMENT ✍ if you enjoy this idea! Also share your ideas and charts in the comments section below! This is best way to keep it relevant, support us, keep the content here free and allow the idea to reach as many people as possible. **
-------------------------------------------------------------------------------
💸💸💸💸💸💸
👇 👇 👇 👇 👇 👇
PLATINUM Strong buy opportunity at the bottom of the Channel Up.Platinum (XPTUSD) has been trading within a 1-year Channel Up pattern and on August 05 it priced the latest Higher Low on the pattern's bottom. Having already recovered the 1D MA50 (blue trend-line), we have a confirmed signal of the start of the new Bullish Leg.
The last two major rallies rose by at least +20.86% and as such, our long-term Target is 1090.
-------------------------------------------------------------------------------
** Please LIKE 👍, FOLLOW ✅, SHARE 🙌 and COMMENT ✍ if you enjoy this idea! Also share your ideas and charts in the comments section below! This is best way to keep it relevant, support us, keep the content here free and allow the idea to reach as many people as possible. **
-------------------------------------------------------------------------------
💸💸💸💸💸💸
👇 👇 👇 👇 👇 👇

Crazy Sell-off in the Palladium Price since 2022. Over 200%. BUY
Why I think our Buy-setup in Palladium today has no much upside.
We have a bullish Head 'n' Shoulders on the 4HR timeframe. Right now price is giving you an even cheaper entry point before this pops!
So, is there demand for Palladium across the world? Take a read of this article from cmegroup.com
Why palladium matters to the growth of the platinum market
By World Platinum Investment Council - WPIC®
16 Jan 2024
Executive summary
Platinum is a critical mineral for the energy transition, and hydrogen-related demand for platinum is forecast to grow substantially through the remainder of the decade and beyond. Platinum catalysts in the electrolysis and fuel cell markets are expected to account for up to 15% of total platinum demand by 2030, reaching as much as 35% of total annual platinum demand by 2040.
The principal use of palladium in 2024 is in fossil fuel and hybrid vehicles, so the health of the automotive industry and the pace of transition to electric vehicles are the key drivers on the demand side.
From what I read, with electric-cars increasing there is not as much demand for catalyic-converters that are derived from palladium. However, there are other uses for palladium than electric cars and supply chains are continually disrupted by wars such as Russia and Ukraine.
All I see is the huge sell-off. I also see a monthly oversold condition for Platinum .

XPTUSD Strong buy on this 1W MA50 rebound.Our April 24 analysis (see chart below) on Platinum (XPTUSD) saw us struck Gold as we caught the exact Bullish Megaphone bottom which hit our 1060 Target:
The situation isn't all that different now as Platinum got close to those April levels, with last week's Low marginally breaking below the 1W MA50 (blue trend-line), managing however to close the candle above it.
This has been followed with a strong green 1W candle this week, which we expect to be the technical rebound towards at least Resistance 1 if not a new Higher High. Our Target is slightly lower than this at 1095.00.
-------------------------------------------------------------------------------
** Please LIKE 👍, FOLLOW ✅, SHARE 🙌 and COMMENT ✍ if you enjoy this idea! Also share your ideas and charts in the comments section below! This is best way to keep it relevant, support us, keep the content here free and allow the idea to reach as many people as possible. **
-------------------------------------------------------------------------------
💸💸💸💸💸💸
👇 👇 👇 👇 👇 👇

UPDATE: IMP continues to disappoint with the commoditiesM Formation is easily turning into a Triple Top
Price<20
Price>200
Need to wait for breakout for the confirmation. Then the first target will be at R38.07.
It's a bearish outlook for platinum and is a downer for the commodity, but hopefully we get a stock market run up to counter for the drop.

PLATINUM Massive profit last time. What's the next trade?Straight and plain success of our previous Platinum (XPTUSD) signal (April 24, see chart below), where we caught the exact Bullish Megaphone bottom and hit directly our 1060 Target:
The price could now enter a consolidation phase, the last accumulation, similar to November 15 - December 15 2022, when after it touched the 1D MA50 (blue trend-line), it rallied to the bottom of the Resistance Zone.
As a result, we are turning into buyers again, targeting 1100 (just below the Resistance Zone).
-------------------------------------------------------------------------------
** Please LIKE 👍, FOLLOW ✅, SHARE 🙌 and COMMENT ✍ if you enjoy this idea! Also share your ideas and charts in the comments section below! This is best way to keep it relevant, support us, keep the content here free and allow the idea to reach as many people as possible. **
-------------------------------------------------------------------------------
💸💸💸💸💸💸
👇 👇 👇 👇 👇 👇

In Platinum, Triangle formed. 1st Target 1882, 2nd Target 2763.Triangle Pattern formed in Platinum Future, wait for the Breakout. Because Breakout is the Confirmation market move to the Bullish Trend. And 1st Target price is 1882, 2nd Target price 2763.
This is for Long Term Analysis.
I want to help people to Make Profit all over the World.

XPTUSD Strong Higher Low buy opportunity. 1D Golden Cross formedPlatinum (XPTUSD) gave us an excellent bottom buy signal last time (March 13, see chart below), as the metal entered a Channel Up pattern following the bottom just below 880.00:
Currently we are on the 2nd Bearish Leg of the Bullish Megaphone pattern that emerged and will complete a Golden Cross on the 1D time-frame today. As per the December 02 2023 Golden Cross, which was formed after a similar rebound, but on a more aggressive Channel Up instead of a Megaphone, we should be expecting another Higher High near the 1.382 Fibonacci extension. Our Target is 1060.
-------------------------------------------------------------------------------
** Please LIKE 👍, FOLLOW ✅, SHARE 🙌 and COMMENT ✍ if you enjoy this idea! Also share your ideas and charts in the comments section below! This is best way to keep it relevant, support us, keep the content here free and allow the idea to reach as many people as possible. **
-------------------------------------------------------------------------------
💸💸💸💸💸💸
👇 👇 👇 👇 👇 👇

Platinum- Can it Bridge the Gap with Gold?For the past 10 months, OANDA:XPTUSD has been trading within a range between approximately 850 to 1000.
However, upon closer examination of this range, it appears to resemble a rounded bottom formation and also after dipping below 900 at the beginning of March, Platinum has been establishing higher lows, suggesting that the price is ready for a strong rise.
Conservative traders may want to consider waiting for a break above 1000.
In such an instance, the price could potentially accelerate and reach 1300 in the medium term.
On the other hand, more aggressive traders could opt to buy dips near 950.
With a stop loss set below 850 and a target of 1300, this strategy could potentially yield a risk-to-reward ratio of more than 1:3.

XPTUSD broke above the 1D MA200 and is ready to rally.Platinum (XPTUSD) broke above the 1D MA200 (orange trend-line), and being on 1D RSI Higher Lows, we may be having a strong rally in its early stages. At least this is what the very same Higher Lows RSI pattern has led to when Platinum made the very same 1D MA200 break-out on October 26 2022.
The result was a +28.50% instant rally from the bottom and then a finaly blow-out just below the 1.382 Fibonacci extension. As a result, we are bullish on Platinum targeting a minimum at 1060 (sub 1.382 Fib), even though it may very well reach the upper (red) Resistance Zone.
-------------------------------------------------------------------------------
** Please LIKE 👍, FOLLOW ✅, SHARE 🙌 and COMMENT ✍ if you enjoy this idea! Also share your ideas and charts in the comments section below! This is best way to keep it relevant, support us, keep the content here free and allow the idea to reach as many people as possible. **
-------------------------------------------------------------------------------
💸💸💸💸💸💸
👇 👇 👇 👇 👇 👇

Platinum welcomes Bull Market since April 2023SInce April, we've seen the price on a strong decline from $1,143 down to $843.
It then reached a low and has consolidated around forming a Triple Bottom.
The price has broken above the downtrend along with the neckline of the pattern.
This means, we are ina bull market.
But hold up. There are two ways this can go.
EIther the market continues to consolidate and move sideways which will be a drag holding onto platinum longs. Or the bulls will do what they can to push up and take us to the target.
With the Santa Claus Rally on the way and the positive sentiment reverberating world-side, I can only hope for the latter.
My first target will be $1,094.00.

XPTUSD About to test the 1D MA200. Strong buy above it.Platinum (XPTUSD) is going quite well since our October 25 buy call (see chart below) as we caught the bottom and the price is now rebounding:
The long term pattern is a Channel Up. At the moment the price is supported by the 1D MA50 (blue trend-line) buy restrained below the 1D MA200 (orange trend-line) where it got rejected on November 28. Even though the bottom of the Channel Up was made and the 1D RSI patterns between the two sequences are similar, we need confirmation for upward extension by a break above the 1D MA200.
If you didn't buy lower, you can wait until that level breaks, and then target the +28.55% range at $1100.
-------------------------------------------------------------------------------
** Please LIKE 👍, FOLLOW ✅, SHARE 🙌 and COMMENT ✍ if you enjoy this idea! Also share your ideas and charts in the comments section below! This is best way to keep it relevant, support us, keep the content here free and allow the idea to reach as many people as possible. **
-------------------------------------------------------------------------------
💸💸💸💸💸💸
👇 👇 👇 👇 👇 👇

XPTUSD bottomed and has almost +30% upside potential.Platinum (XPTUSD) is testing (and so far failing to break) the 1D MA50 (blue trend-line) after a rebound on the bottom (Higher Lows trend-line) of the long-term Channel Up structure. A break above the 1D MA50 but mostly the Lower Highs trend-line, would confirm the bullish bias on such a low price action, with considerable upside potential.
As you can see the current bottom formation is very similar to the one that led to the September 01 2022 Low. The 1D RSI fractals are identical and will be confirmed if it continues on Higher Lows.
As a result we do have a low risk buy signal on the current level but it is not confirmed yet and needs to break above the Lower Highs to do so. Our long-term target is the 1100, which represents a +28.55% rise from the bottom, similar to the November 11 2022 peak.
-------------------------------------------------------------------------------
** Please LIKE 👍, FOLLOW ✅, SHARE 🙌 and COMMENT ✍ if you enjoy this idea! Also share your ideas and charts in the comments section below! This is best way to keep it relevant, support us, keep the content here free and allow the idea to reach as many people as possible. **
-------------------------------------------------------------------------------
💸💸💸💸💸💸
👇 👇 👇 👇 👇 👇

XPTUSD Solid buy entry but not confirmed yet.Platinum (XPTUSD) is trading around the 1D MA50 (blue trend-line) after a rebound on the bottom (Higher Lows trend-line) of a potential long-term Channel Up structure. This is the 2nd time it bounces off the Higher Lows and the 4th within the 7-month Support Zone.
The 1D MACD made a Bullish Cross last week and is on Higher Lows since June 30. The very same Triple Bottom formation on a Higher Lows MACD can be seen on the previous bottom. The Lower Highs trend-line break-out didn't confirm the bullish signal, it had to be a break above the 1D MA200 (orange trend-line) to give the confirmation. As you can see on both fractals the price got rejected on the 1D MA200 (August 11 2022 and July 18 2023) before it bottomed.
As a result we may have a low risk buy signal on the current level but it is not confirmed yet and needs to break above the 1D MA200 to do so. Our long-term target is the Top of the Resistance Zone at 1130.
-------------------------------------------------------------------------------
** Please LIKE 👍, FOLLOW ✅, SHARE 🙌 and COMMENT ✍ if you enjoy this idea! Also share your ideas and charts in the comments section below! **
-------------------------------------------------------------------------------
💸💸💸💸💸💸
👇 👇 👇 👇 👇 👇
