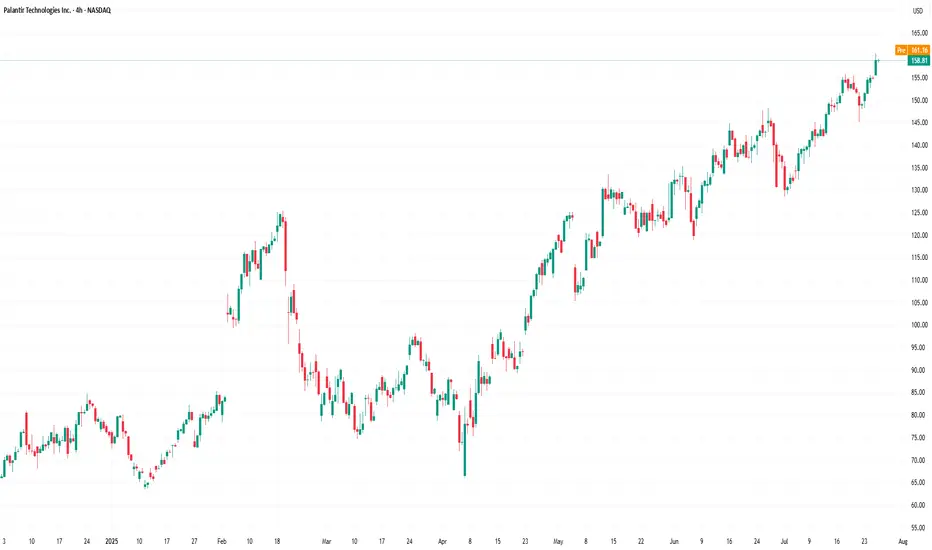
Palantir Technologies (PLTR) Shares Surpass $160Palantir Technologies (PLTR) Shares Surpass $160 for the First Time
Shares of Palantir Technologies (PLTR), a company specialising in big data analytics software, have continued their impressive performance. Following an extraordinary rally of approximately 340% in 2024, the stock remains among the top performers in the equity market:
→ since the beginning of 2025, the share price has climbed by approximately 113%;
→ on Friday, PLTR set another all-time high, with the share price exceeding $160 for the first time.
What Is Driving Palantir Technologies (PLTR) Higher?
The bullish sentiment is underpinned by the following factors:
→ Major partnerships. Among the contracts are an agreement with the US Army to develop a command system, collaboration with Accenture Federal Services, and many others.
→ Positive analyst outlooks , highlighting Palantir’s unique growth model and high margins. Analysts at Piper Sandler have set a price target of $170 for PLTR, while Wedbush recently raised their target to $160.
In addition, investors are looking ahead with optimism to the upcoming quarterly report scheduled for 4 August, which is expected to reinforce Palantir’s leadership position in a market increasingly driven by AI technologies.
Technical Analysis of Palantir Technologies (PLTR) Chart
Price action has formed an ascending channel (shown in blue), with a notable bullish pattern: each pullback (marked with arrows) has been followed by:
→ a lack of further downside momentum;
→ a rebound above the level where the decline began.
From a sentiment perspective, it is reasonable to infer that price dips are perceived not as warning signs, but as opportunities to accumulate a high-performing stock at a relative discount.
Given these factors, we expect that the upcoming earnings report could propel PLTR shares towards the upper boundary of the blue channel.
This article represents the opinion of the Companies operating under the FXOpen brand only. It is not to be construed as an offer, solicitation, or recommendation with respect to products and services provided by the Companies operating under the FXOpen brand, nor is it to be considered financial advice.
PLTR
PLTR is doing it... pullback honeyThis video has my thoughts about PLTR and a trading view tip... the data window!!! Who knew?
Hope the talk inspires you as you decide on future investments; especially when it's stalling or pulling back.
My short term bias is bearish for a pullback on PLTR. Not sure when it will happen, but <155 is my trigger to see what I see.
What do you see?
**>162... slow your roll to see if 160 holds.

PLTR moving higherPLTR expected to move higher.
The price is bouncing off the 20MA and respecting it.
Making new higher/highs and higher lows.
Earnings is due shortly, which could have a negative impact to the price.
However, the long term outlook for the company is still strong.
Anyone else have thoughts on this stock?

PALANTIR REMAINS YOUR TRADING GOAL, DOUBLING IN PRICE IN 2025In the Faraway Kingdom... In the Thirtieth Realm....
Somewhere in another Galaxy.. in late December, 2024 (yet before The Second Coming of Trump), @TradingView asked at it awesome Giveaway: Happy Holidays & Merry Christmas .
1️⃣ What was your best trade this year?
2️⃣ What is your trading goal for 2025?
Here's what we answered:
1️⃣ What was your best trade this year?
- Surely Palantir NASDAQ:PLTR 💖
I followed Palantir all the year since January, 2024, from $16 per share, watch here .
Current result is 5X, to $80 per share.
Also I added more Palantir after SP500 Index inclusion in September 2024 watch here .
Current result is 2.6X, from $30 to $80 per share.
2️⃣ What is your trading goal for 2025?
- Once again, surely Palantir NASDAQ:PLTR 💖
It's gone 7 months or so... (Wow... 7 months really? 😸😸😸)
Let see what's happened next at the main graph of Palantir stock, to LEARN WHY PALANTIR REMAINS THE TRADING GOAL, DOUBLING IN PRICE IN 2025...
Palantir stock remains an attractive trading goal for several compelling reasons rooted in its strong market performance, innovative technology, and robust growth prospects, particularly in the artificial intelligence (AI) sector.
1. Exceptional Stock Performance and Momentum.
Palantir Technologies has been one of the best-performing stocks in 2025, surging over 80% in the first half of the year alone, vastly outperforming the S&P 500’s modest 5.5% gain. The stock recently hit all-time highs around $149, reflecting a nearly 400% increase year-over-year, underscoring its strong momentum and investor enthusiasm. This surge positions Palantir as a top AI stock to watch, attracting both retail and institutional investors, including conservative entities like the Czech National Bank.
2. Leadership in AI and Data Analytics.
Palantir is not just a data analytics company; it has transformed into a major AI software provider with its Artificial Intelligence Platform (AIP). This platform extends beyond government contracts into commercial sectors such as healthcare, energy, and automotive, fueling significant revenue growth. The company reported a 39% revenue increase to $883.9 million in Q1 2025, driven largely by AI adoption. Its AI platform is gaining traction globally, with many companies rapidly adopting Palantir’s software through short training bootcamps, demonstrating scalable and fast integration.
3. Strong Government and Commercial Contracts.
Palantir’s roots in government intelligence and defense continue to be a significant revenue driver. The U.S. government division alone generated $373 million in Q1 2025, with overall government revenue up 45% year-over-year. Strategic partnerships, such as with Accenture to streamline federal operations and projects like the U.S. Navy’s ‘Warp Speed for Warships,’ highlight Palantir’s expanding footprint in critical government sectors. Simultaneously, the commercial segment is booming, with revenue soaring 71% to $255 million in Q1 and projected to reach $1.178 billion in 2025.
4. Financial Health and Growth Outlook.
Palantir’s financials are strengthening, with no debt and adjusted free cash flow more than doubling to $370.4 million in the recent quarter. Analysts forecast the company’s revenue to exceed $3.5 billion in 2025, up from $2.23 billion the previous year, and project potential revenue of $7 billion by 2028. Operating margins are improving, with a recent quarter reporting a 26% margin, the highest in company history. This solid financial foundation supports further investment in AI innovation and market expansion.
5. Market Position and Competitive Edge.
While Palantir competes with tech giants like Microsoft, Amazon, and Google in the AI and data analytics space, it has carved out a unique niche with its specialized government contracts and AI-driven software solutions. Its ability to integrate complex datasets for real-world operational use distinguishes it from competitors, fostering a loyal investor base and a "cult-like" following among retail investors.
6. High Valuation Reflects Growth Expectations.
Despite a high price-to-earnings ratio (PE around 621), reflecting elevated expectations, many analysts remain optimistic about Palantir’s long-term potential due to its rapid growth and expanding AI capabilities. The company’s market capitalization has soared above $330 billion, surpassing many established corporations, signaling strong market confidence.
7. Palantir stock is a compelling trading goal because it combines robust growth, cutting-edge AI technology, strong government and commercial contracts, and solid financial health.
8. In conclusion, Palantir remarkable stock performance and strategic positioning in the booming AI sector make it a promising investment for traders seeking exposure to transformative technology with significant upside potential.
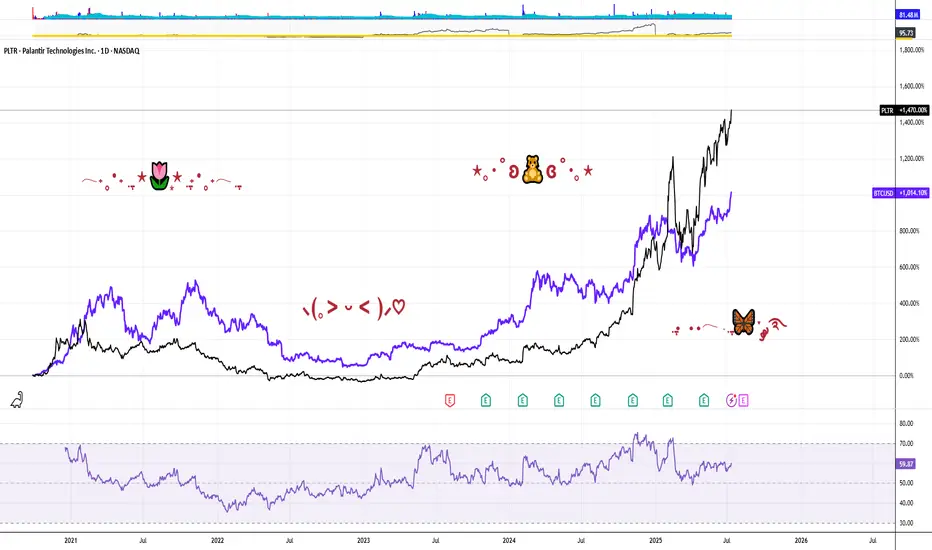
9. ...and yet, Palantir performance since inception (It ultimately went public on the New York Stock Exchange through a direct public offering on September 30, 2020) is better, rather then Bitcoin.
--
Best wishes,
@PandorraResearch Team 😎
PLTR - Palantir Technologies: Why PLTR is the Perfect PlayExceptional Performance Leadership
Palantir Technologies has established itself as the undisputed champion of the U.S. stock market in 2025. The stock has delivered extraordinary returns of 402.92% over the past 12 months and 87.89% year-to-date, making it the best-performing stock in both the S&P 500 and Nasdaq-100 indices. Currently trading at $142.10, the stock has surged from lows around $21, representing one of the most dramatic momentum plays in modern market history.
Powerful AI-Driven Revenue Growth
The company's financial performance has been nothing short of spectacular. Palantir's U.S. commercial AIP (Artificial Intelligence Platform) revenue has surpassed a $1 billion annual run rate with 71% year-over-year growth. The company reported Q1 2025 revenue of $883.86 million, beating consensus estimates and growing 39% year-over-year. This growth trajectory is being driven by unprecedented demand for AI solutions across both commercial and government sectors.
The company's customer base has expanded to 769 total customers, up 39% year-over-year, with 44% of revenue now coming from commercial clients. This diversification away from pure government dependency represents a significant strategic achievement that provides multiple growth vectors.
Strategic Government AI Dominance
Maven Smart System Contract Expansion
Palantir's government business has reached new heights with its Maven Smart System contract being increased by $795 million, bringing the total value to over $1.3 billion through 2029. Pentagon leaders boosted the contract citing "growing demand" for the system across all military branches, including the Army, Navy, Air Force, Space Force, and Marine Corps.
Stargate AI Initiative Leadership
The company holds a central position in the $500 billion Stargate AI infrastructure project, positioning it as a backbone for America's AI future. This initiative represents one of the largest technological undertakings in U.S. history, designed to establish domestic AI superiority and reduce reliance on foreign systems.
Strategic Partnerships
Palantir has formed landmark partnerships with Microsoft for classified AI deployment and Accenture Federal Services for comprehensive government AI implementation. These alliances significantly expand the company's reach and delivery capabilities across the federal ecosystem.
Technical Momentum Confirmation
Bullish Technical Setup
The stock exhibits exceptional technical strength with multiple confirmation signals:
Moving Average Alignment : All major moving averages (20-day, 50-day, 200-day) are positioned bullishly below the current price, indicating sustained upward momentum
RSI Positioning: At 58.42, the RSI shows healthy momentum without being overbought, providing room for continued advancement
Volume Confirmation: Recent trading volumes have consistently exceeded 50 million shares daily, indicating strong institutional participation
Golden Cross Pattern: The 50-day moving average at $131.9 remains above the 200-day moving average at $101.7, confirming the bullish trend
Breakout Pattern
The stock has successfully broken above the $140 resistance level with strong volume, targeting the $175-$220 range based on technical analysis. The pennant pattern breakout above $140 has been confirmed by institutional buying pressure and retail momentum.
Institutional Investment Surge
Record Institutional Participation
Institutional ownership has reached 45.65% of outstanding shares, with $19.19 billion in institutional inflows over the past 12 months versus only $10.43 billion in outflows. This represents a net institutional buying pressure of nearly $9 billion, demonstrating strong professional investor confidence.
Premium Analyst Coverage
Wedbush Securities has raised its price target to $160, calling Palantir the "Messi of AI" and positioning it as a top pick in their "IVES AI 30" list. The firm sees Palantir's AIP platform as foundational for the trillion-dollar AI spending wave and believes the company has a "golden path to become the next Oracle".
Competitive Advantages and Market Position
Architecture-Agnostic Platform
Palantir's AIP is architecture-agnostic, seamlessly integrating with both centralized cloud systems and decentralized frameworks. This versatility allows the company to serve diverse client needs across multiple sectors, from government defense to commercial healthcare.
Network Effects and Data Flywheel
The company benefits from powerful network effects where more customers generate more data, which improves AI models and increases retention rates. This creates a self-reinforcing competitive advantage that becomes stronger over time.
Government Moats
Palantir's deep government relationships and security clearances create substantial barriers to entry. Multi-year government contracts provide revenue stability and growth visibility that few technology companies can match.
Financial Strength and Profitability
The company has demonstrated seven consecutive quarters of GAAP profitability with expanding margins. Adjusted operating margins have improved to 36% in Q1 2025 from 29% previously, showing operational excellence alongside revenue growth. The company maintains a strong balance sheet with $4 billion in cash and equivalents.
Investment Thesis Summary
Palantir Technologies represents the perfect convergence of momentum, fundamentals, and catalysts that defines exceptional investment opportunities:
Momentum Factors:
402.92% twelve-month returns leading all major indices
Continuous institutional accumulation with $9 billion net inflows
Technical breakout above key resistance with volume confirmation
Fundamental Catalysts:
$1 billion+ AIP commercial revenue run rate with 71% growth
$1.3 billion+ government contract pipeline expansion
Central role in $500 billion Stargate AI infrastructure initiative
Strategic Positioning:
Architecture-agnostic platform creating multiple market opportunities
Government relationships providing defensive moats and growth visibility
Network effects and data flywheel creating competitive advantages
Risk-Adjusted Opportunity:
Clear support levels at $137-$140 range providing defined risk parameters
Multiple price targets ranging from $155-$220 suggesting significant upside potential
Strong balance sheet and cash generation providing downside protection
Palantir Technologies embodies the rare combination of explosive growth, defensive positioning, and strategic importance that creates generational investment opportunities. The company's leadership in AI government applications, combined with accelerating commercial adoption, positions it as a cornerstone holding for the AI revolution.

Why Palantir (PLTR) Could Be the NVDA of Government AI If you haven`t bought PLTR before the massive rally:
Palantir Technologies (PLTR) is proving it’s more than just another AI hype play — it’s becoming a core piece of the secure AI infrastructure for governments and large enterprises worldwide.
Key Bullish Arguments
1) Strong Government Moat
PLTR’s deep relationship with the U.S. government, NATO, and allies provides sticky, long-term revenue streams. In an age of geopolitical tension, this is exactly the type of mission-critical AI spending that stays funded.
2) Expanding Commercial Footprint
The commercial segment is no longer a side project. Palantir’s Foundry and Apollo platforms help enterprises deploy AI at scale — securely, in-house, and without sending sensitive data to open systems. Recent deals in healthcare, energy, and critical infrastructure show they’re broadening their customer base.
3) Profitability & Balance Sheet
Palantir is GAAP profitable for six consecutive quarters, with strong free cash flow and zero debt. For a growth stock in AI, this gives it rare staying power if macro conditions tighten.
4) Technical Strength
The stock broke out above ~$125–$130 support and is now testing key resistance in the $140–$148 range. Weekly momentum remains bullish, and institutional accumulation (A/D line) remains strong.
5) AI Tailwinds Remain
While the general AI trade has cooled for some names, PLTR’s unique moat in secure and domain-specific AI makes it more defensible than generic “AI SaaS” stocks. New contracts or AI platform updates could reignite momentum this summer.
Possible Summer Catalysts
New multi-year government deals — especially in defense and cybersecurity.
Major commercial partnerships — especially in healthcare or energy.
AI platform upgrades — more integrations with LLMs or domain-specific AI.
Inclusion in AI-focused ETFs — or further index rebalancing inflows.
Disclosure: I am part of Trade Nation's Influencer program and receive a monthly fee for using their TradingView charts in my analysis.
"Steal the Market: PLTR Trading Strategy Revealed!"🌟 Hola, Money Snatchers & Market Rogues! 🌟
Ready to hit the vault? 💰💸✈️
Here’s the ultimate plan for lifting loot from PLTR (Palantir Technologies Inc.) using the infamous Thief Trading Style. This is no rookie job—we’ve got the techs and the fundamentals to nail the target. Our sights are locked on the high-stakes Red Zone: nuclear resistance, overbought territory, trend reversals, and that sweet electric trap where traders and bearish bounty hunters lie in wait. 🏆💸 It’s time to bag those profits and live like a kingpin!
Entry Point 📈:
Doors are wide open! Snatch that bullish loot at any level—it’s a free-for-all! For extra stealth, set your buy limits around recent 15–30 min swing highs or lows. Pro tip: throw in some chart alerts to stay ahead of the game.
Stop Loss 🛑:
Our Thief SL lands at the recent 2h swing low (116.00) on a swing-trade basis—tight enough to dodge the cops but wide enough to let the heist breathe. Adjust based on your bankroll and risk appetite—don’t get greedy, and always plan your getaway.
🏴☠️ Target 🎯: 152.00—or duck out early if the sirens start blaring!
🧲 Scalpers, listen up 👀:
Only scalp on the long side—no backstabbing shorts here! If you’ve got the bankroll, go all-in; otherwise, team up with swing traders and ride the big wave. Use a trailing SL to keep your loot safe from sudden ambushes.
PLTR (Palantir Technologies Inc.) is on a bullish tear—thanks to a mix of market signals and that sweet fundamental juice:
📰🗞️ Stay locked in with the latest—fundamentals, macro reports, COT updates, geopolitical heat, sentiment, intermarket moves, index breakdowns, position shifts, and trend forecasts. Link’s in the bio—don’t miss it! 👉👉👉
📌 Pro Tip: Markets can flip faster than a getaway car—stay sharp and ready to pivot.
⚠️ Trading Alert:
News drops can spike the alarm system—here’s how to keep your loot safe:
🚫 Skip new trades during releases
🚏 Lock in profits with trailing stops—no one likes getting caught!
💖 Show some love for the crew—💥 Smash that Boost Button 💥—and keep the Thief Trading Style alive. Let’s make bank every day like true market outlaws! 🏆💪🤝❤️🎉🚀
Stay tuned—another big score’s just around the corner! 🤑🐱👤🤗🤩

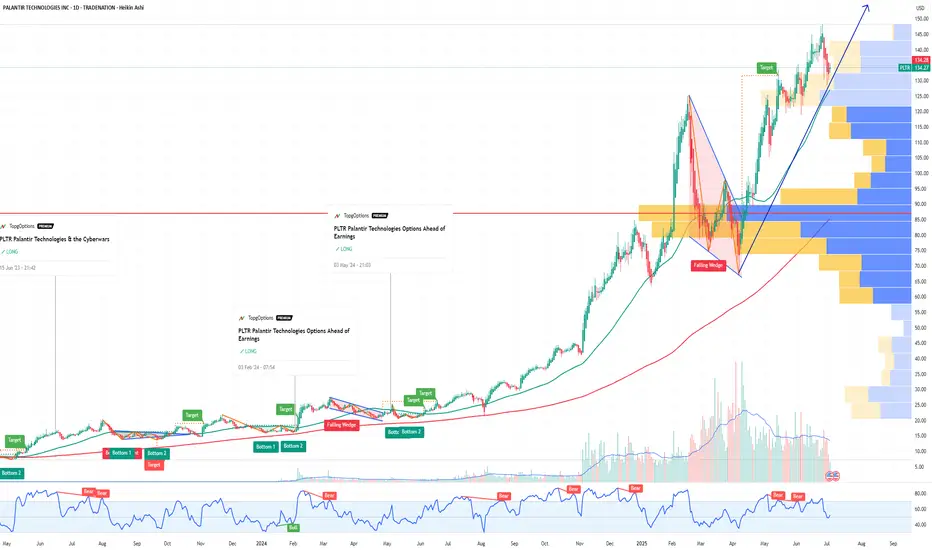
PLTR 1D — When the tea is brewed and the handle’s in placePalantir’s daily chart is shaping up a textbook cup with handle pattern — one of the most reliable continuation setups in technical analysis. The cup base was formed over several months and transitioned into a consolidation phase, building a rectangle structure where smart money likely accumulated positions before a breakout.
Now here’s the key: price has not only broken out — it’s settled above all major moving averages, including EMA 20/50/100/200 and MA 50/200. The breakout candle was supported by surging volume, signaling strong participation from institutional buyers. When all the averages start bending upwards, it's usually not by accident.
The breakout above the $121 resistance zone unlocked a pathway toward a target at $187 , derived by projecting the height of the cup upward from the breakout level. This kind of structure, once confirmed, often fuels aggressive continuation — and this one’s got the setup locked in.
From a fundamental perspective, Palantir is holding solid ground: strong earnings reports, expanding government and commercial contracts, and aggressive development in AI services. Institutional interest is rising steadily, and that momentum is visibly reflected in price action.
To sum it up: price has launched cleanly out of the consolidation zone, pierced all critical MAs and EMAs, and continues to gain momentum. While the market sips its tea, this cup is boiling hot. Just don’t forget your stop loss — this is a trading desk, not a tea party.
If you enjoy posts like this, drop a like, share it around, and let’s hear your thoughts below. It keeps ideas moving and the content flowing — free, sharp, and relevant.

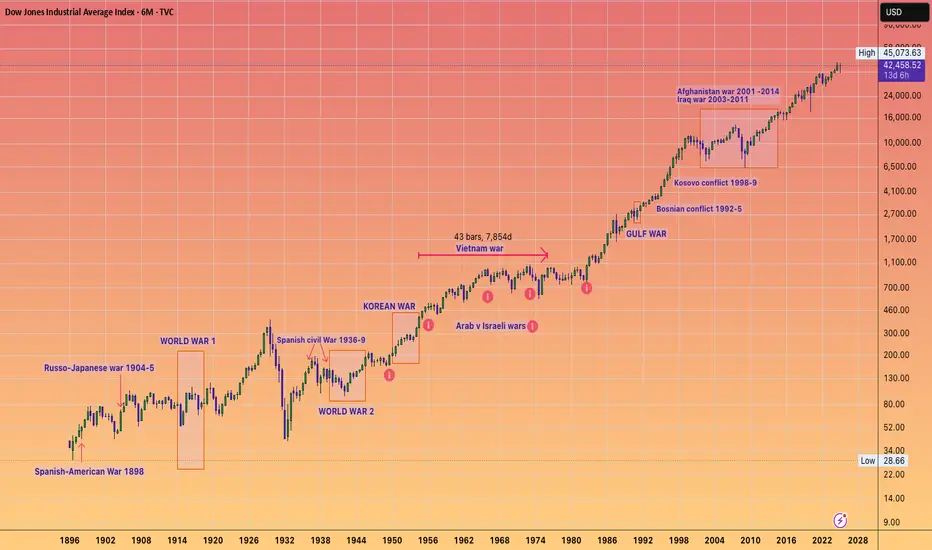
Don't SELL your bags Because of WAR FUDThey just end up turning up the money printer anyway...
DJI set amongst the major wars and conflicts the past century...
( I could have added way more wars to this chart but it would have been difficult to read all of them )
PLTR Bearish Swing Play – Trump Deal Fallout & Technical Breakdo📉 PLTR Bearish Swing Play – Trump Deal Fallout & Technical Breakdown
🗓️ Date: June 5, 2025
🧠 Strategy: Short-term momentum + sentiment swing
⏱️ Timeframe: 5–10 trading days
🔎 Multi-Model Analysis Summary
Model Bias Strike Entry Target Stop Confidence
Grok 🔻 Bearish 122 5.50 8.25 3.85 75%
Claude 🔻 Bearish 120 4.75 7.13 5.70 75%
Llama 🔻 Bearish 120 4.85 9.00 3.50 70%
Gemini 🔻 Bearish 120 4.80 9.00 3.50 70%
DeepSeek 🔻 Bearish 120 4.80 8.25 stock SL 75%
✅ Consensus: All models align on bearish momentum and bearish options flow
📉 Max pain + high open interest at $120 = gravitational magnet
🔻 Negative news on GOP scrutiny and Trump contract backlash → strong downside pressure
🧭 Technical & Sentiment Overview
Price Action: Below all major EMAs; 15m/daily charts breaking down
Momentum: MACD bearish cross, RSI oversold on 15m
Weekly Trend: Still bullish – could trigger mean-reverting bounce
Options Flow: Heavy OI at $120 puts, consistent sell pressure
Max Pain: $120 → bearish bias reinforced
News Flow: GOP/TikTok scrutiny, deal risk, broad tech pullback
✅ Recommended Trade Setup
Metric Value
Instrument PLTR
Direction PUT (Short)
Strike $122.00
Expiry 2025-06-20
Entry Price $5.60 (mid)
Profit Target $8.40 (+50%)
Stop-Loss $4.48 (-20%)
Position Size 1 contract
Confidence 75%
Entry Timing Market open
🎯 Trade Rationale
Aligns with cross-model agreement on direction and level
Captures max pain magnet at $120
Risk-managed with tight stop and defined 50% upside
Capitalizes on current negative news cycle + bearish technicals
⚠️ Key Risks to Watch
📈 Dead-cat bounce from oversold RSI on 15m
📉 Weekly trend still up — any bounce >$125 invalidates setup
🕓 Theta decay accelerates in week 2 → time-sensitive setup
🧾 News reversal or surprise PR from company can flip narrative fast

Is the push-up for PLTR over?Is the push-up for PLTR over?
Palantir stock has been supported by the ascending trendline shown on the chart for the past two days... hence acting as a good support.
The asset pushed up yesterday, but dropped a bit after hitting the descending TL acting as resistance, as shown.
VIEWS for entry
1. Enter with current market price
entry: $121.8
SL: $118.8
TP1: $133.8
2. Be conservative for a breakout
entry: $124 zone
SL: $120.9
TP2: $134
The two trades
RR 1:3.84 & 1:2.55

PALANTIR: Bullish breakout to $260 imminent.Palantir is on a strong bullish 1D technical outlook (RSI = 62.809, MACD = 6.320, ADX = 29.658) as it maintaines a Channel Up pattern that is supported by the 1D MA50. The starting point was of course the April 7th 2025 bottom and it looks very similar to the previous major bottom on the 1D MA200 on August 5th 2024. Expect the same total rise (+299%) before the next 1D MA50 test. TP = 260.
See how our prior idea has worked out:
## If you like our free content follow our profile to get more daily ideas. ##
## Comments and likes are greatly appreciated. ##

PLTR Weekly Options Outlook — June 1, 2025🚨 AI Consensus: Bullish Momentum with Caution on Short-Term Overbought Levels
🧠 AI Model Highlights
🔹 Grok (xAI)
Technicals: Strong uptrend, riding upper EMAs & Bollinger; RSI = 87.
Sentiment: VIX stable, bullish AI headlines; max pain at $122.
Trade: Buy $145C @ $0.88 → Target $1.06 (+20%), Stop $0.62 (−25%)
Confidence: 70%
🔹 Claude (Anthropic)
Technicals: Overbought on all frames; volume spike on red bars.
Sentiment: Positive news, but gravity toward $122.
Trade: Buy $120P @ $0.88 → Target $1.76 (+100%), Stop $0.44
Confidence: 75%
🔹 Gemini (Google)
Technicals: Bullish breakout; 5-min RSI hot, but daily trend intact.
Sentiment: Strong $145 call flow.
Trade: Buy $145C @ $0.88 → Target $1.54 (+75%), Stop $0.44
Confidence: 70%
🔹 Llama (Meta)
Technicals: Bullish daily, short-term overbought.
Sentiment: Bullish, but recommends waiting for pullback to $130–131.
Trade: No immediate entry; consider $132–133C later.
🔹 DeepSeek
Technicals: Bearish MACD cross; overbought RSI; resistance at $133.5.
Sentiment: Mixed flow; expects pullback.
Trade: Buy $125P @ $1.80 → Target double, Stop 50%, Size: 3
Confidence: 65%
✅ What They Agree On
📈 Strong rally across the board
⚠️ 5-min RSI > 85 = overbought condition
🧲 Max Pain at $122 = potential late-week gravity
📰 Bullish AI sentiment continues
🔄 Where They Disagree
🔺 Bulls (Grok, Gemini, Llama) favor calls, especially $145
🔻 Bears (Claude, DeepSeek) expect reversion to mean via puts
📆 Llama urges patience, others suggest open entry
🎯 Target gains range from 20% to 100%
🎯 Recommended Trade Setup
💡 Strategy: Bullish Naked Call
🔘 Ticker: PLTR
🔀 Direction: CALL (LONG)
🎯 Strike: $145
💵 Entry Price: $0.88
🎯 Profit Target: $1.54 (+75%)
🛑 Stop Loss: $0.44 (−50%)
📏 Size: 1 Contract
📆 Expiry: 2025-06-06 (Weekly)
⏰ Entry: At Market Open
📈 Confidence: 70%
⚠️ Risk Factors to Monitor
RSI overheated — watch for early week pullbacks
Max pain at $122 could drag later in week
Time decay (theta) rises sharply after Wednesday
Negative macro or AI-related headlines could reverse flow
📊 TRADE DETAILS (JSON)
json
Copy
Edit
{
"instrument": "PLTR",
"direction": "call",
"strike": 145.0,
"expiry": "2025-06-06",
"confidence": 0.70,
"profit_target": 1.54,
"stop_loss": 0.44,
"size": 1,
"entry_price": 0.88,
"entry_timing": "open",
"signal_publish_time": "2025-06-01 15:47:31 UTC-04:00"
}
PLTR still bullish - Cup n Handle patternPLTR in Cup and handle pattern, broke out.
The price closed on Friday is $131.78 (05.30.2025).
Desired entry price $127.88.
Target $147.58/ 164.99/ 183.41.
Stop loss $119.41.
IMO.

Palantir Goes to Repeat Tycoon Buffett Early 1990s AchievementSomewhere in another Galaxy, in late December, 2024 (yet before The Second Coming of Trump), @TradingView asked at it awesome Giveaway: Happy Holidays & Merry Christmas.
1️⃣ What was your best trade this year?
2️⃣ What is your trading goal for 2025?
Here's what we answered:
1️⃣ What was your best trade this year?
- Surely Palantir NASDAQ:PLTR 💖
I followed Palantir all the year since January, 2024, from $16 per share, watch here .
Current result is 5X, to $80 per share.
Also I added more Palantir after SP500 Index inclusion in September 2024 watch here .
Current result is 2.6X, from $30 to $80 per share.
2️⃣ What is your trading goal for 2025?
- Once again, surely Palantir NASDAQ:PLTR 💖
It's gone 4 months or so... (Duh..? Ahaha.. 4 months, really? 😸😸😸)
Let see what's happened next at the main graph PLTR/SPX
First of all, let me explain in a few words what does this graph mean.
Rising (Blue) candle means Palantir NASDAQ:PLTR monthly return is better vs SPX
Falling (Red) candle means Palantir NASDAQ:PLTR monthly return is worse vs SPX
Conclusion
Palantir. The stock that outperformed S&P 500 Index, 11 consecutive months in a row.
Palantir. The stock that printed 11x since inception. 5.5x over the past twelve month and 1.5x in the year 2025 (the best one result so far over the all S&P 500 Index components).
Palantir. The stock that goes to repeat Tycoon Buffett achievement early 1990s (in 1992-93 Berkshire Hathway outperformed S&P 500 Index for a straight TWELVE MONTHS.
Palantir. Were we right with this stock on contest and won it? Exactly! Even though our prize has been toadly strangled. 🤭
--
Best wishes,
Your Beloved @PandorraResearch Team 😎

PLTR Flag Breakout Near ATHSmall catalyst today. It sold off on it at the open and quickly took out its opening range. Ive added a position here in the 126s with a stop at the low of the day.
We have a nice flag pattern. With a ton of support at the 20sma.
We have dipped now multiple times into the 9/20 zone (shaded area) and its been absorbing each time.
This is a bullish sign its had multiple times where it looked like it could sell off only to get bought up.

PLTR: Potential for Further Upside in H2 2025Price is showing a constructive, low-volume pullback into rising EMAs - a healthy sign within an ongoing uptrend as long as price is holding above 118-110 support zone.
Daily trend structure:
Macro trend structure (Weekly):
Thank you for your attention and I wish you successful trading decisions!

PLTR Fails The BreakoutI've been a bag holder of NASDAQ:PLTR from $9. Don't give me too much credit; I bagheld down to $6. I still have the shares but as it makes an attempt to break the prior All Time High this week will close in failure = bearish.
When price makes a shot to a new major high or especially new ATH its of utmost importance that it follow through. You need that reckless YOLO abandon of buyers willing to buy the new highs and give a solid closing price for the Week above what was the prior ATH. That failing to happen is the most bearish of signals.
To that end; Puts... I consider them hedges on my shares taken out to August (for next earnings).

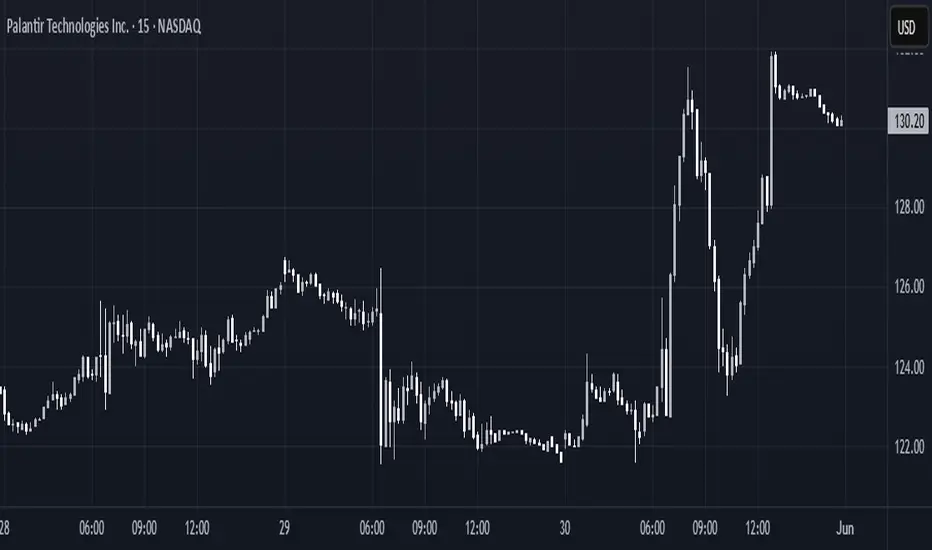
Palantir Technologies (PLTR) Shares Pull Back from Another HighPalantir Technologies (PLTR) Shares Pull Back from Another High
Shares in Palantir Technologies (PLTR), a company specialising in big data analytics software, have seen phenomenal growth in 2024, surging by approximately 340%, making it the top performer in the S&P 500 (US SPX 500 mini on FXOpen). This exceptional performance was driven by booming demand for artificial intelligence (AI) and machine learning technologies, which underpin Palantir’s products. The company has demonstrated steady growth in revenue and profitability, attracting major new clients across both the commercial and government sectors.
In 2025, PLTR remains among the market leaders, with its share price up roughly 60% year-to-date. In mid-May, it hit a fresh record high on the back of a strong fundamental backdrop. That backdrop was bolstered yesterday by news that the Pentagon had increased funding for its Maven Smart System programme — which involves deploying AI on the battlefield — to $1.3 billion through to 2029.
However, this news did not result in a new high. In fact, this week, PLTR stock have underperformed the broader stock market — and this may be explained by technical analysis.
Technical Analysis of the PLTR Chart
The interplay of supply and demand in 2025 has formed a broad ascending channel, characterised by:
→ The price breaking above the upper boundary in February following a strong earnings report, and dipping below the lower boundary in response to Donald Trump’s announcement of new international trade tariffs.
→ In mid-May (as shown by the arrow), the median line acted as support. However, after reaching the upper boundary, bullish momentum faded. As a result, the PLTR price has failed to hold recent highs and has fallen back below $130 — with market participants seemingly viewing the stock as overvalued, evidenced by false breakouts above previous peaks.
Given the above, it is reasonable to assume that PLTR may undergo a deeper pullback — potentially towards the median of the channel or even its lower boundary.
This article represents the opinion of the Companies operating under the FXOpen brand only. It is not to be construed as an offer, solicitation, or recommendation with respect to products and services provided by the Companies operating under the FXOpen brand, nor is it to be considered financial advice.

DOUBLED MONEY in 3 days! $6/share win for $0.50/share stop loss!🔥 +100% in 3 days ✅ $6 to $12 Swing Pick buy on Friday before market close at $6 NASDAQ:ASST
Just 3 days later it's $12 for a mega win!
And to make that much better the risk was only $0.50 per share while going for $6/share win so 1:12 risk/reward ratio

PLTR WAIT FOR THE CRACK!The double top is complemented with a bearish rising wedge stuck in a rising bearish F flag.
A straightforward, short setup if you wait for the CRACK!

PLTR, It's Been RealAt a high of 125, it's had a great run, but a double top has formed going into earnings and a US government which may be forced into austerity. Insiders have been selling for months with no net buys
- First Price target down to the neckline at 76
- Next price target would be 42 for the last real breakout test
- Final PT would be 24 if the double top played out completely

Potential W PLTRWeekly has a double top formation but if it can survive and not retrace much more than 30-40% from the top it could play out a W pattern which is one of the most bullish around
