Trading Plan on PLTR for the current range.Today we will take a look at PLTR.
a) The price is inside a range since March 2021. The support and the resistance zone define this range.
b) There is an accepted idea that the expected target of a range breakout is its length above or below it. Using this, we can project a minimum target on the yellow arrow if we have a bullish breakout. However, if the price keeps going up, the next resistance zone we may encounter is the previous ATH
c) Ok, great. But how do you plan to trade this? - We want to observe a corrective pattern on the edge of the range with the same proportions as the previous one. IF that happens, we will set pending orders on the green activation line. Our stop loss will be below the structure. The break-Even level is the range projection. Our Target will be 42.60 to be conservatives.
d) If everything goes as expected, we think the movement can take between 15 to 30 days
e) We will risk on a setup like this 1% of our Capital on the stop loss.
Thanks for reading!
PLTR

Palantir (PLTR) UpdatesI haven't talked about Palantir since March 2021,
I was certainly expecting better performances, but I am staying absolutely long for the long term.
The reasons why Palantir is a must-have stock are many and will be analyzed more carefully for the private group participants (stay tuned because there will be a special price at the launch), you just need to say that we are talking about one of the real big data giants. We speak of the present but also, indeed above all, of the future.
After the March investment, the price broke the resistance of $ 21 after testing the level twice, but it did not "lose" enough to be able to make another entry that I would have made if the tightening had occurred until the area of $ 12.
After the break in May, the price quickly and strongly resumed the price of $ 21, and then touched the area of $ 27 (corresponding to the 382 Fibonacci level, see chart).
After a foreseeable retracement again in the $ 21 area, a very important level for the future, after the Earnings on August 12, positive with a surprise of 13%, PLTR opened in the Gap and then basically remained stationary on Friday 13.
The uptrend may have started, we are on the "C" leg of the more classic ABCD pattern.
The key level that needs to be broken to the upside for Palantir to be sure to be in an uptrend is $ 27.52.
PLTR is part of my long-term portfolio, in August I don't usually trade with a few-day swing because the volumes are low and the American indices are at all-time highs.
It is reasonable to expect a pull-back in the short term, something will certainly happen when the Fed changes its interest rate policy.
Consequently, the new levels where you can enter or add size to the position are $ 21 and the "new" $ 17 marked in May.
The targets for those who instead moved with short time horizons:
27.52 $
34 $
45 $ (where I too would take home some profit)
DISCLAIMER: I am not a financial advisor nor a CPA. These posts, videos, and any other contents are for educational and entertainment purposes only. Investing of any kind involves risk. While it is possible to minimize risk, your investments are solely your responsibility. It is imperative that you conduct your own research. I am merely sharing my opinion with no guarantee of gains or losses on investments.

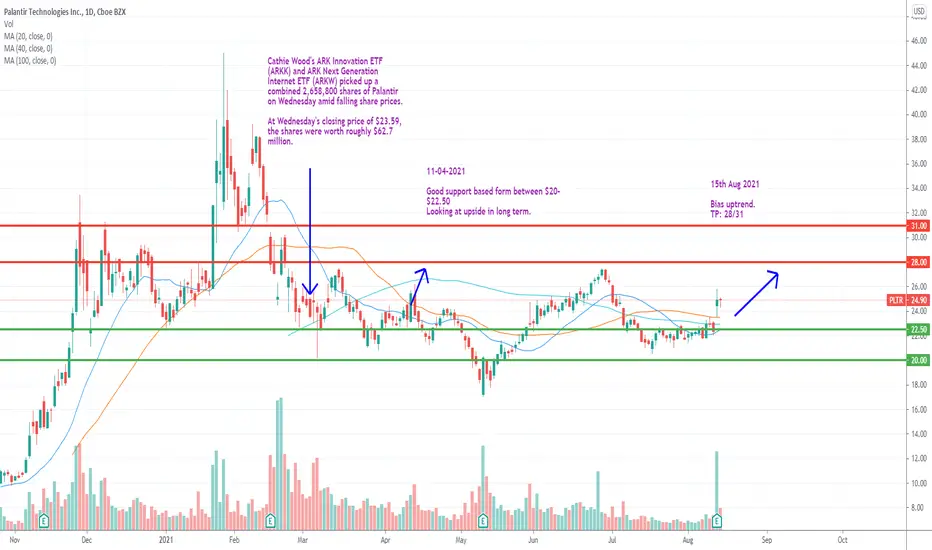
Good Earning Report, bias on upsideMid-long Term good counter.
$20 base was breach previously however the price managed to support overall.
Therefore, bias on upside.
PLTR - Short term Long (weekly)Disclaimer: I consider this a risky stock so I advise caution
We all saw PLTR have a good earnings release that caused the monolithic upwards gap last week and finally breaking out of its base. Since then the stock has been trending sideways creating a pennant. As a result of a good earnings release as well as Bullish ADX and DMI, I strongly believe that PLTR will hit the 27's (macro-structural resistance) by the end of this week.

the start of something big, +200% short term Palantir Technologies Inc. builds and deploys software platforms for the intelligence community in the United States to assist in counterterrorism investigations and operations.

PLTR Cup and Handle if the price penetrates the trend line with a good volume , it will give a good chance to fly to 37 .

$PLTR Target 33.39 for 56.41% $PLTR Target 33.39 for 56.41%
Or Next add at 22.88
I’m just going to aim right for that GAP. Target has not changed...
-----
—
On the far right of the chart is my Average (Grey) Current Target (Green), and Next Level to add (Red) Percentage to target is from my average.
ONLY ADD at support levels & FIB levels… labeled
I start every position with .5 - 1% of my account and build from there as needed and as possible.
I am not your financial advisor. Watch my setups first before you jump in… My trade set ups work very well and they are for my personal reference and if you decide to trade them you do so at your own risk. I will gladly answer questions to the best of my knowledge but ultimately the risk is on you. I will update targets as needed.
GL and happy trading.

A review on the bright side of the August!I have published a few analyses that need some review!:
Longs:
UPST
PLTR
SOFI
COIN
AI
Shorts:
TWTR
MRNA
NASDAQ:TSLA
NIO

PLTR could see a big move !!!PLTR setting up for an interesting move. 22.68 is a big pivot point if it breaks this we can see a run back up to 27.

PLTR: Good QR! More upside in upcoming weeksTechnically, PLTR is in an uptrend now with registered higher high and higher low.
The good quarterly report today pushed price up to an intermediate resistance. Might see a pullback to close the gap, but that could mean better entry for us.
Target profit 1 set at $27 i.e. next resistance.
Will observe price action again to see if target profit 2 ($31 area) is a good target.
Disclaimer: I'm not giving any trading and investing advice. I'm just sharing my chart observations.
If you have any symbols that you'd like me to analyze, feel free to drop me a comment.

PLTR: Complete Multiple Time Frame Analysis after Earnings!Hello traders and investors! Today PLTR reported its earnings, and the volatility increased, as expected. There are some key points we can use, and we’ll talk about them in this complete Multi Time Frame Analysis (MTFA) .
First, now it is too late to buy. The time to buy was during the Ignition Bar evidenced in the 1h chart, which was a classic bullish candlestick pattern, just above the support at the purple trendline.
What’s more, PLTR just filled the first Breakaway Gap , which was my first target since the analysis I did on July 20, “PLTR: A very Technical Bullish Thesis”, which is public, and the link to it is below this post. If you buy now, it feels like you’ll buy from someone who bought at the Ignition Bar down there, and will use you to book profits. Always try to buy from who’s panicking, not with the herd.
If I were out, I would wait for the Risk/Reward ratio to make sense again, probably after a correction, near a support level. This wouldn’t change the bullish bias seen on PLTR, as I still believe we’ll seek the next gap at $ 26.32. The daily chart reinforces the bullish thesis:
The daily chart suggests that we can seek the $ 27.47. We just defeated the 38.2% Fibonacci’s Retracement , which worked as a resistance at least 2 times (Jul 12 and Aug 10). We also defeated the 21 ema, and the situation is clearly bullish. It would be good if it corrects again, but we can’t count on that.
It is interesting to notice that PLTR has been doing many good and technical movements. The bottom seen last month was just a pullback to the 61.8% Fibonacci’s Retracement, and it did a perfect Piercing Line candlestick pattern on Jul 19.
However, I have one more key point for you, and this time it is in the weekly chart:
Although the $ 27.47 is the target in the daily chart, this is a bullish pivot point in the weekly chart . If triggered, PLTR has a good chance of retesting its All-Time High again.
To sum up, if you aim for the short-term, you have an opportunity to book profits now, as we just hit the first target in the 1h chart. If you aim for the mid-term, the $ 27.47 is the target for you. In a longer-term perspective, if PLTR triggers the pivot point in the weekly chart, the $ 45 is where you should aim.
In addition, if you still don’t follow me, I invite you to do so ! I write daily analysis here on Tradingview, and I’m sure you’ll find something interesting around.
Take care, my friends!

The next 400-700 million is important..!Just look at dollar value of the previous Price Reversal Zone to know why I say the next 300-700 million dollars is critical..!

Serving Technicals Up On A PLTRSo I plotted this fib retracement a while ago using all highs and lows since IPO. I also plotted out a trend line that seems to have been an interesting level between the 618 and 50 fib levels. Today's update included an extension of that trendline (in dotted orange). The interesting part of it all is that this remains a key level on the chart and is almost exactly where PLTR was denied after this epic gap-up. Now that it has reclaimed some ground, eyes are on this current resistance to turn support (for longs) as well as the 50 fib level if or when it establishes a new support "up here". With tech flip-flopping, it will be interesting to see how PLTR reacts after 8/12's session.
"One of the best performing industries over the past few months has been in tech stocks. The landscape has drastically changed thanks to the pandemic. Many companies have shifted their tech strategy to move more things online and to a virtual platform... One of the best performing industries over the past few months has been in tech stocks. The landscape has drastically changed thanks to the pandemic. Many companies have shifted their tech strategy to move more things online and to a virtual platform."
Quote & Learn More: Top Tech Penny Stocks To Watch For August 2021

What are the bullish evidence in Palantir chart???1- Closing above resistance level (Flat Top)
2- Increase +70% in trading value in comparison to average weekly trade, and +50% in comparison to monthly trade.
3- Crossing above 20 days EMA.
4- Long bullish candle that covers the buddy of the last 14 candles!
5- Closing above 20 EMA weekly ..!!!
* this is not on the chart but It is ranked 4th on WSB mentions today with 600% increase!
Please review my last 3 analysis on Palantir:
June 29th, 2021
keep it on your short watch list!
Trading volume Decreased from 140 M to 42 M, which means there is no buyer for Palantir at this level!
Wait for a clear short entry!
July 16, 2021:
Sensitive level of 21.50
21.50 is the most important level for Palantir to trade. In most cases, it has experienced a 12-27% bounce.
This is not a long-term trade setup!
August 5th, 2021:
Correction seems finished..!

PLTR Nice movement post ER. New cycle potential?We could see a similar move here as we saw last run up. I would be targeting 54-58.

Palantir is about to break outIf you are trading PLTR, wait for a break out from this rectangular consolidation and take a position accordingly.

PLTR ANALYSIS 12.08.2021Hello Traders, here is a full analysis for this asset. The entry will be taken only, if all rules of your trading plan are satisfied.
Therefore I suggest you keep this pair on your watchlist and see if all of your rules are satisfied.
Leave your thoughts in the comment section, I will reply to every single one of them.
_____________________________________________________________________________________________________________________________________________________________________

PLTR- $23.50-OPTIONS SWING TRADElooks like price is trying to hold...PT$23.50..sellers are disappearing as spreads are not giving a follow through. PT $23.50 but as we all know its tough to take all the pips.


PLTR: THIS COULD BE GOOD. PLTR:
PLTR's sitting at a critical moment, will it bounce off the bottom channel of the rising wedge or will it break lower? A break lower means long puts with profit targets set at $18 level, a bounce off the bottom wedge means long calls, target upper channel at 22.80 and a higher probability that the wedge will break igniting moves to 24(.5fib), 24.82(.618 fib), and $27.44(1:1 retracement). or.... we get a boring ass ping pong with the rising wedge contiuning.. hopefully not. curious to see where this goes. Will be keeping this on my watchlist. Waiting for this triangle break to present some good entries.

PLTR 1st target $22.90 or $23Let it go down near dotted line then take call..get out @23. Swing play.Don't wait ,let it go where ever it wants to go. Targets should be very clear. Try getting into it around $22.60 . Options swing play

Pltr $23 swing play optionsDon't dream big that it's gonna go to the moon.Earnings are there but be careful..Options swing PT $23.

target $23 options playPLTR is consolidating & It is not going down for sure.Option are risky so be careful
