PLTR WEEKLY TRADE IDEA (07/28/2025)
**🚀 PLTR WEEKLY TRADE IDEA (07/28/2025) 🚀**
**Momentum is 🔥 but Volume is the Missing Ingredient**
---
📈 **Momentum Snapshot:**
* **Daily RSI:** 71.9 ⬆️ (🚨 Overbought but still rising)
* **Weekly RSI:** 76.7 ⬆️ (📢 Clear Bullish Strength)
➡️ *Strong upside pressure, but entering the overbought zone*
📉 **Volume Insight:**
* Weekly Volume = **0.8x last week**
⚠️ *Weak institutional conviction during the breakout = yellow flag*
🔍 **Options Flow Check:**
* **Call/Put Ratio:** 1.09 = *Neutral*
➡️ Balanced flow = *no aggressive buying yet*
🌪️ **Volatility Environment:**
* **VIX = 15.4**
✅ Favorable for directional trades — low IV supports premium growth
---
📊 **Model Consensus Recap:**
✅ Bullish RSI momentum (unanimous)
✅ Volatility ideal for long calls
⚠️ Volume flagged as a concern by some models
📌 Final stance: **MODERATE BULLISH**
---
💥 **RECOMMENDED TRADE SETUP (Confidence: 65%)**
🎯 **Play:** Buy CALL Option
* **Strike:** \$167.50
* **Expiry:** Aug 1, 2025
* **Entry Price:** \~\$0.74
* **Profit Target:** \$1.48 (🟢 2x return)
* **Stop Loss:** \$0.37 (🔻-50%)
📆 **Entry Timing:** Market Open Monday
📦 **Size:** 1 Contract
---
⚠️ **Key Risks to Watch:**
* 📉 Weak volume = possible consolidation before next leg up
* ⏳ Premium decay risk into expiry
* 📊 No strong institutional footprint = stay nimble
---
📌 **JSON FORMAT TRADE DETAILS (Automation Ready):**
```json
{
"instrument": "PLTR",
"direction": "call",
"strike": 167.50,
"expiry": "2025-08-01",
"confidence": 0.65,
"profit_target": 1.48,
"stop_loss": 0.37,
"size": 1,
"entry_price": 0.74,
"entry_timing": "open",
"signal_publish_time": "2025-07-28 10:13:40 EDT"
}
```
---
🔥 TL;DR:
* Momentum is undeniable ✅
* Volume = suspect 🟡
* VIX = Green light for directional play ✅
💬 **\ NASDAQ:PLTR Bulls, are you ready or waiting for volume confirmation?**
\#PLTR #OptionsTrading #BullishSetup #UnusualOptions #MomentumPlay #TradingView #StockMarket
Pltranalysis

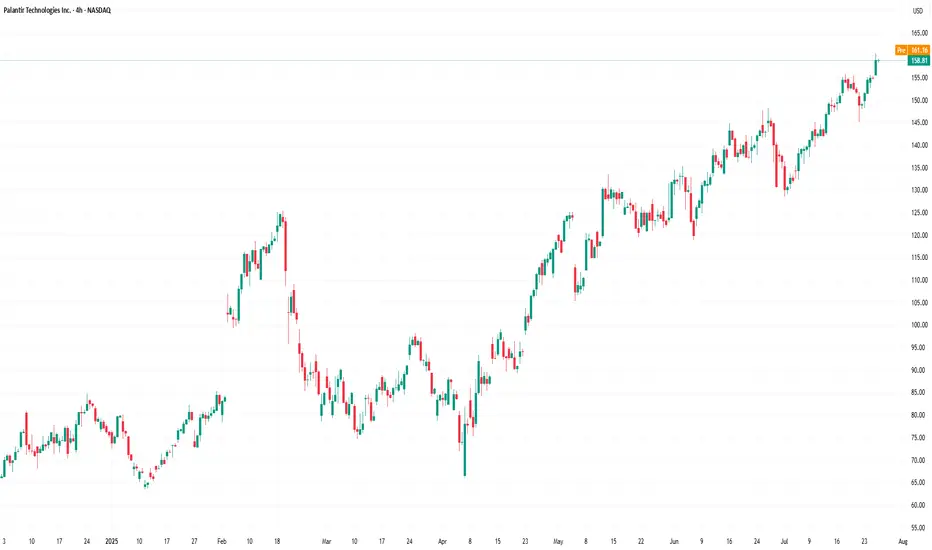
Palantir Technologies (PLTR) Shares Surpass $160Palantir Technologies (PLTR) Shares Surpass $160 for the First Time
Shares of Palantir Technologies (PLTR), a company specialising in big data analytics software, have continued their impressive performance. Following an extraordinary rally of approximately 340% in 2024, the stock remains among the top performers in the equity market:
→ since the beginning of 2025, the share price has climbed by approximately 113%;
→ on Friday, PLTR set another all-time high, with the share price exceeding $160 for the first time.
What Is Driving Palantir Technologies (PLTR) Higher?
The bullish sentiment is underpinned by the following factors:
→ Major partnerships. Among the contracts are an agreement with the US Army to develop a command system, collaboration with Accenture Federal Services, and many others.
→ Positive analyst outlooks , highlighting Palantir’s unique growth model and high margins. Analysts at Piper Sandler have set a price target of $170 for PLTR, while Wedbush recently raised their target to $160.
In addition, investors are looking ahead with optimism to the upcoming quarterly report scheduled for 4 August, which is expected to reinforce Palantir’s leadership position in a market increasingly driven by AI technologies.
Technical Analysis of Palantir Technologies (PLTR) Chart
Price action has formed an ascending channel (shown in blue), with a notable bullish pattern: each pullback (marked with arrows) has been followed by:
→ a lack of further downside momentum;
→ a rebound above the level where the decline began.
From a sentiment perspective, it is reasonable to infer that price dips are perceived not as warning signs, but as opportunities to accumulate a high-performing stock at a relative discount.
Given these factors, we expect that the upcoming earnings report could propel PLTR shares towards the upper boundary of the blue channel.
This article represents the opinion of the Companies operating under the FXOpen brand only. It is not to be construed as an offer, solicitation, or recommendation with respect to products and services provided by the Companies operating under the FXOpen brand, nor is it to be considered financial advice.
PLTR is doing it... pullback honeyThis video has my thoughts about PLTR and a trading view tip... the data window!!! Who knew?
Hope the talk inspires you as you decide on future investments; especially when it's stalling or pulling back.
My short term bias is bearish for a pullback on PLTR. Not sure when it will happen, but <155 is my trigger to see what I see.
What do you see?
**>162... slow your roll to see if 160 holds.

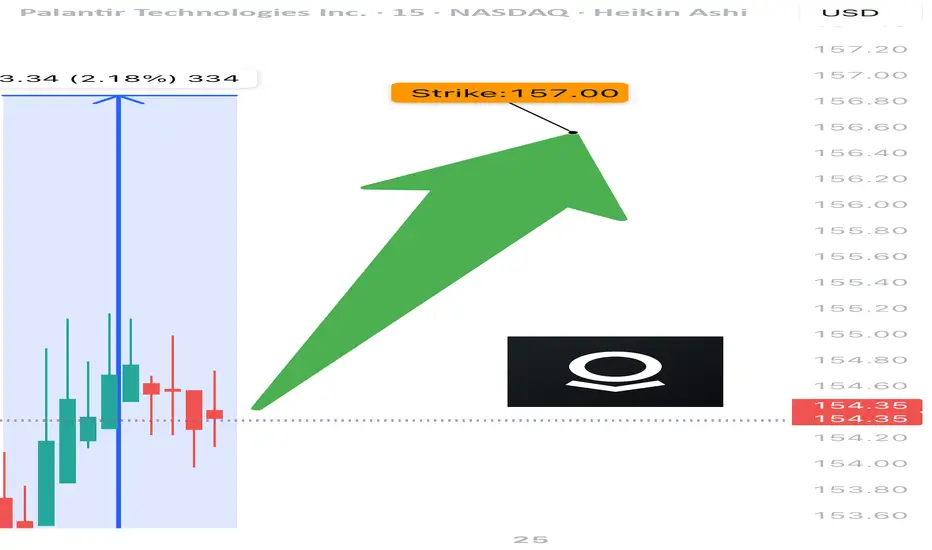
PLTR TRADE SIGNAL (07/24)
🚨 PLTR TRADE SIGNAL (07/24) 🚨
💥 Expiry in 1 day = HIGH GAMMA risk = BIG MOVES coming
🧠 Key Highlights:
• Call/Put Ratio: 1.40 → bullish options flow
• Strong institutional positioning 📈
• RSI cooling off = ⚠️ watch momentum
• Volume concerns → cautiously bullish
💥 TRADE SETUP
🟢 Buy PLTR $157.50 Call exp 7/25
💰 Entry: $0.59
🎯 Target: $0.89 (50%+)
🛑 Stop: $0.24
📈 Confidence: 65%
⚠️ Gamma + Time Decay = explosive but risky. Tight execution needed.
#PLTR #OptionsAlert #OptionsFlow #UnusualOptionsActivity #TechStocks #DayTrading #GammaSqueeze #TradingView #BullishSetup #CallOption
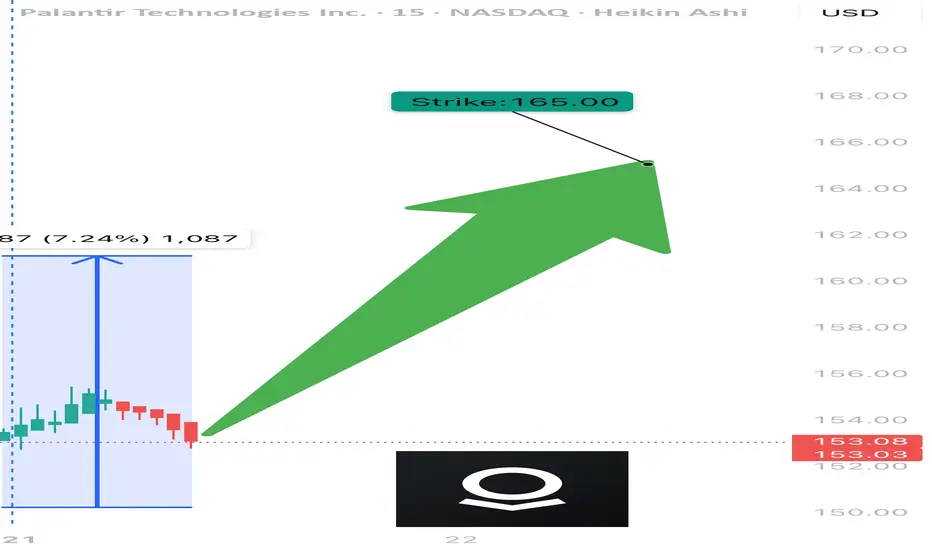
PLTR WEEKLY OPTIONS TRADE IDEA – JULY 21, 2025
🔥 NASDAQ:PLTR WEEKLY OPTIONS TRADE IDEA – JULY 21, 2025 🔥
Bullish Momentum + Strong Options Flow = Prime Setup 📈
⸻
📊 TRADE SETUP
🎯 Instrument: NASDAQ:PLTR
📈 Direction: CALL (LONG)
💵 Strike Price: $165.00
🟢 Entry Price: $0.59
🛑 Stop Loss: $0.30 (50% risk cap)
🎯 Profit Target: $1.18 (2x reward)
📅 Expiry: July 25, 2025 (Weekly)
📏 Size: 1 contract
💪 Confidence: 75%
⏰ Entry Timing: Market Open
⸻
📌 Why This Trade?
✅ RSI Strength: Daily RSI = 71.0 | Weekly RSI = 75.3 → Bullish continuation
✅ Weekly Range Positioning: Trading at 96.6% of weekly high
✅ Options Flow: Call/Put ratio = 1.47 — institutional bullish bias
✅ Strike Interest: Heavy OI @ $162.50 & $165.00 = strong magnet zones
🟡 VIX = 16.6 → Favorable volatility for short-term premium plays
⚠️ Volume is flat (1.0x) — no surge confirmation, so keep stops tight
⸻
🧠 Execution Plan
• Open position at the bell
• Mental stop at -50%, or ~$0.30
• Target 100% return = ~$1.18
• Exit ahead of Friday’s expiration unless the trade hits target early
⸻
💡 Key Levels to Watch
🔹 Resistance Zone: $155.68 – $156.59
🔹 Support Watch: Below $152 could break structure
🔹 Earnings Risk: Check calendar — volatility can spike unexpectedly
⸻
🏁 Verdict
• Momentum = 🔥
• Flow = 🚀
• Volume = 😐
➡️ Net Bias: MODERATE BULLISH — Risk-managed call with solid R:R
⸻
NASDAQ:PLTR Call @ $165 — Entry $0.59 → Risk $0.30 → Target $1.18 💥
Clean setup for disciplined bulls. Don’t overstay. Ride momentum. 🎯
⸻
#PLTR #OptionsTrading #WeeklyOptions #MomentumPlay #CallOptions #FlowTrade #TradingView #StockSignals #TradeSetup #RiskReward #SwingTrade #SmartMoneyFlow
"Steal the Market: PLTR Trading Strategy Revealed!"🌟 Hola, Money Snatchers & Market Rogues! 🌟
Ready to hit the vault? 💰💸✈️
Here’s the ultimate plan for lifting loot from PLTR (Palantir Technologies Inc.) using the infamous Thief Trading Style. This is no rookie job—we’ve got the techs and the fundamentals to nail the target. Our sights are locked on the high-stakes Red Zone: nuclear resistance, overbought territory, trend reversals, and that sweet electric trap where traders and bearish bounty hunters lie in wait. 🏆💸 It’s time to bag those profits and live like a kingpin!
Entry Point 📈:
Doors are wide open! Snatch that bullish loot at any level—it’s a free-for-all! For extra stealth, set your buy limits around recent 15–30 min swing highs or lows. Pro tip: throw in some chart alerts to stay ahead of the game.
Stop Loss 🛑:
Our Thief SL lands at the recent 2h swing low (116.00) on a swing-trade basis—tight enough to dodge the cops but wide enough to let the heist breathe. Adjust based on your bankroll and risk appetite—don’t get greedy, and always plan your getaway.
🏴☠️ Target 🎯: 152.00—or duck out early if the sirens start blaring!
🧲 Scalpers, listen up 👀:
Only scalp on the long side—no backstabbing shorts here! If you’ve got the bankroll, go all-in; otherwise, team up with swing traders and ride the big wave. Use a trailing SL to keep your loot safe from sudden ambushes.
PLTR (Palantir Technologies Inc.) is on a bullish tear—thanks to a mix of market signals and that sweet fundamental juice:
📰🗞️ Stay locked in with the latest—fundamentals, macro reports, COT updates, geopolitical heat, sentiment, intermarket moves, index breakdowns, position shifts, and trend forecasts. Link’s in the bio—don’t miss it! 👉👉👉
📌 Pro Tip: Markets can flip faster than a getaway car—stay sharp and ready to pivot.
⚠️ Trading Alert:
News drops can spike the alarm system—here’s how to keep your loot safe:
🚫 Skip new trades during releases
🚏 Lock in profits with trailing stops—no one likes getting caught!
💖 Show some love for the crew—💥 Smash that Boost Button 💥—and keep the Thief Trading Style alive. Let’s make bank every day like true market outlaws! 🏆💪🤝❤️🎉🚀
Stay tuned—another big score’s just around the corner! 🤑🐱👤🤗🤩

Is the push-up for PLTR over?Is the push-up for PLTR over?
Palantir stock has been supported by the ascending trendline shown on the chart for the past two days... hence acting as a good support.
The asset pushed up yesterday, but dropped a bit after hitting the descending TL acting as resistance, as shown.
VIEWS for entry
1. Enter with current market price
entry: $121.8
SL: $118.8
TP1: $133.8
2. Be conservative for a breakout
entry: $124 zone
SL: $120.9
TP2: $134
The two trades
RR 1:3.84 & 1:2.55

PLTR Weekly Options Outlook — June 1, 2025🚨 AI Consensus: Bullish Momentum with Caution on Short-Term Overbought Levels
🧠 AI Model Highlights
🔹 Grok (xAI)
Technicals: Strong uptrend, riding upper EMAs & Bollinger; RSI = 87.
Sentiment: VIX stable, bullish AI headlines; max pain at $122.
Trade: Buy $145C @ $0.88 → Target $1.06 (+20%), Stop $0.62 (−25%)
Confidence: 70%
🔹 Claude (Anthropic)
Technicals: Overbought on all frames; volume spike on red bars.
Sentiment: Positive news, but gravity toward $122.
Trade: Buy $120P @ $0.88 → Target $1.76 (+100%), Stop $0.44
Confidence: 75%
🔹 Gemini (Google)
Technicals: Bullish breakout; 5-min RSI hot, but daily trend intact.
Sentiment: Strong $145 call flow.
Trade: Buy $145C @ $0.88 → Target $1.54 (+75%), Stop $0.44
Confidence: 70%
🔹 Llama (Meta)
Technicals: Bullish daily, short-term overbought.
Sentiment: Bullish, but recommends waiting for pullback to $130–131.
Trade: No immediate entry; consider $132–133C later.
🔹 DeepSeek
Technicals: Bearish MACD cross; overbought RSI; resistance at $133.5.
Sentiment: Mixed flow; expects pullback.
Trade: Buy $125P @ $1.80 → Target double, Stop 50%, Size: 3
Confidence: 65%
✅ What They Agree On
📈 Strong rally across the board
⚠️ 5-min RSI > 85 = overbought condition
🧲 Max Pain at $122 = potential late-week gravity
📰 Bullish AI sentiment continues
🔄 Where They Disagree
🔺 Bulls (Grok, Gemini, Llama) favor calls, especially $145
🔻 Bears (Claude, DeepSeek) expect reversion to mean via puts
📆 Llama urges patience, others suggest open entry
🎯 Target gains range from 20% to 100%
🎯 Recommended Trade Setup
💡 Strategy: Bullish Naked Call
🔘 Ticker: PLTR
🔀 Direction: CALL (LONG)
🎯 Strike: $145
💵 Entry Price: $0.88
🎯 Profit Target: $1.54 (+75%)
🛑 Stop Loss: $0.44 (−50%)
📏 Size: 1 Contract
📆 Expiry: 2025-06-06 (Weekly)
⏰ Entry: At Market Open
📈 Confidence: 70%
⚠️ Risk Factors to Monitor
RSI overheated — watch for early week pullbacks
Max pain at $122 could drag later in week
Time decay (theta) rises sharply after Wednesday
Negative macro or AI-related headlines could reverse flow
📊 TRADE DETAILS (JSON)
json
Copy
Edit
{
"instrument": "PLTR",
"direction": "call",
"strike": 145.0,
"expiry": "2025-06-06",
"confidence": 0.70,
"profit_target": 1.54,
"stop_loss": 0.44,
"size": 1,
"entry_price": 0.88,
"entry_timing": "open",
"signal_publish_time": "2025-06-01 15:47:31 UTC-04:00"
}
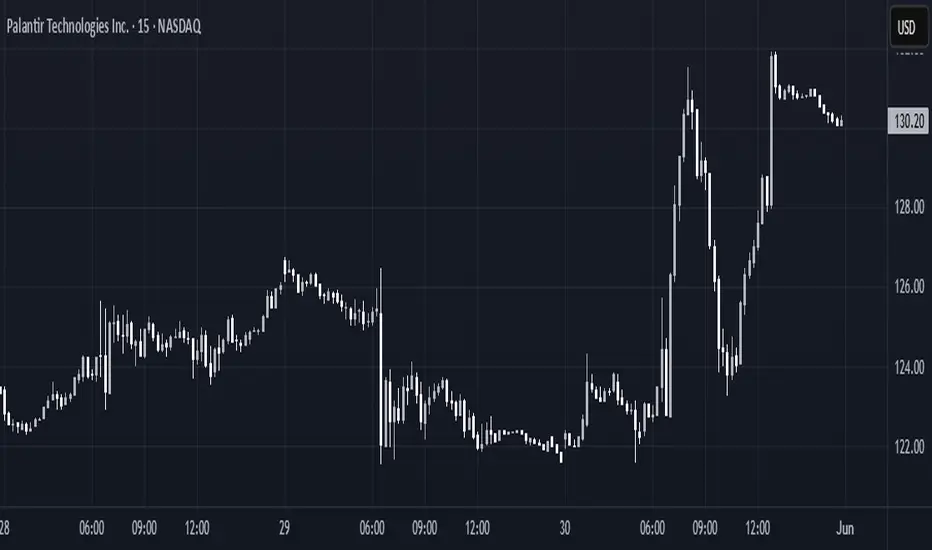
Palantir Technologies (PLTR) Shares Pull Back from Another HighPalantir Technologies (PLTR) Shares Pull Back from Another High
Shares in Palantir Technologies (PLTR), a company specialising in big data analytics software, have seen phenomenal growth in 2024, surging by approximately 340%, making it the top performer in the S&P 500 (US SPX 500 mini on FXOpen). This exceptional performance was driven by booming demand for artificial intelligence (AI) and machine learning technologies, which underpin Palantir’s products. The company has demonstrated steady growth in revenue and profitability, attracting major new clients across both the commercial and government sectors.
In 2025, PLTR remains among the market leaders, with its share price up roughly 60% year-to-date. In mid-May, it hit a fresh record high on the back of a strong fundamental backdrop. That backdrop was bolstered yesterday by news that the Pentagon had increased funding for its Maven Smart System programme — which involves deploying AI on the battlefield — to $1.3 billion through to 2029.
However, this news did not result in a new high. In fact, this week, PLTR stock have underperformed the broader stock market — and this may be explained by technical analysis.
Technical Analysis of the PLTR Chart
The interplay of supply and demand in 2025 has formed a broad ascending channel, characterised by:
→ The price breaking above the upper boundary in February following a strong earnings report, and dipping below the lower boundary in response to Donald Trump’s announcement of new international trade tariffs.
→ In mid-May (as shown by the arrow), the median line acted as support. However, after reaching the upper boundary, bullish momentum faded. As a result, the PLTR price has failed to hold recent highs and has fallen back below $130 — with market participants seemingly viewing the stock as overvalued, evidenced by false breakouts above previous peaks.
Given the above, it is reasonable to assume that PLTR may undergo a deeper pullback — potentially towards the median of the channel or even its lower boundary.
This article represents the opinion of the Companies operating under the FXOpen brand only. It is not to be construed as an offer, solicitation, or recommendation with respect to products and services provided by the Companies operating under the FXOpen brand, nor is it to be considered financial advice.

PLTR Weekly Options Trade Plan 2025-04-16NASDAQ:PLTR PLTR Weekly Analysis Summary (2025-04-16)
Below is the integrated analysis of all the model reports:
──────────────────────────────
SUMMARY OF EACH MODEL’S KEY POINTS
• Grok/xAI Report
– Technical indicators on both short‐term (5‑minute) and daily charts are bullish.
– The price is trading above all key EMAs and has recently made higher highs/lows.
– Although the 5‑minute RSI is overbought and MACD shows a slight negative reading, the daily chart is strongly bullish with a bullish MACD crossover.
– Options data shows a max pain at $92.00 (well below the current price), and Grok recommends buying a naked call at the $99 strike for the weekly expiration at an estimated premium of $0.55.
• Llama/Meta Report
– The short-term chart reveals a near-term consolidation: recent closes are mixed with a cooling RSI and a negative MACD histogram, hinting at possible short-term pullbacks.
– The daily picture remains upward with bullish trend indicators, though the report notes conflicting evidence about overbought conditions.
– Their overall bias is “moderately bullish” but they tilt toward caution by suggesting—in an alternate scenario—a naked put near $95 if the price reverses.
• Gemini/Google Report
– The daily trend is strongly bullish with price well above moving averages and positive MACD/histogram readings.
– The 5‑minute chart, while bullish, shows signs of consolidation near current highs (observed in Bollinger Band touches and slight RSI cooling).
– Despite the max pain level ($92.00) that could impose later headwinds, Gemini remains moderately bullish and recommends a naked call strategy at the $100 strike — with the plan to enter at the open but with strict risk measures.
• DeepSeek Report
– On short-term charts, DeepSeek notes bullish fundamentals but also flags very high recent gains (+27% in five days) and the pressure from a max pain level far below current levels.
– The s
hort-term indicators (MACD on the 5‑minute chart) even hint at a near-term pullback, making the overall picture mixed.
– Their conclusion is to hold off (“no trade”) given the conflicting signals; if forced, they would consider a bearish put (again near $95) rather than a call.
──────────────────────────────
AREAS OF AGREEMENT AND DISAGREEMENT
• Agreement
– All models agree that PLTR has been on a strong recent rally; technicals on the daily chart show a marked upward bias.
– Every analysis notes potential near-term caution: the fast rise, signals of consolidation on shorter timeframes, and the fact that the max pain level ($92.00) is far below the current price.
– There is consensus that if a trade is to be attempted, one must trade with a strict, short‑term (weekly) setup and disciplined risk management.
• Disagreement
– Grok and Gemini lean toward an intraday bullish play with a naked call, while Llama (and DeepSeek’s alternative scenario) bring up the possibility of a trade in the bearish direction (naked put) due to short-term pullback indicators.
– DeepSeek ultimately suggests sitting out rather than initiating a trade given the asymmetry between a bullish trend and the potential risk imposed by max pain; meanwhile, Grok and Gemini are prepared to buy call options if conditions hold at the open.
──────────────────────────────
CONCLUSION
Overall Market Direction Consensus:
While the daily trend is clearly bullish, all models signal that the stock is now extended and vulnerable to a short-term consolidation or pullback. In our integrated view, the directional bias is moderately bullish but not without risk.
Recommended Trade:
Based on the majority—especially the Grok and Gemini reports—and provided that the market opens in line with recent momentum, a cautious bullish play is recommended. We will trade weekly options only and use a naked call strategy. To keep our premium in the ideal range, we choose a strike that is close to t
he current price yet slightly out‐of‐the‐money.
• Trade: Buy a naked call option
• Strike: $99.00 (as recommended by Grok, and a reasonable compromise between the $99 and $100 levels)
• Expiration: Weekly options expiring on 2025‑04‑17
• Premium: Approximately $0.55 per contract (within our target range)
• Entry Timing: At the open
Risk & Considerations:
– There is a significant risk that—given the recent 27% rally and short‐term consolidation indicators—the stock could pause or pull back toward the max pain near $92.00.
– In the event of a sudden intraday reversal (for example, a move below key M5 support levels around $98.16–$98.29), the position should be exited promptly.
– The intraday volatility remains high (VIX around 30 but falling), so close monitoring is essential.
• Confidence Level: Approximately 75% based on the integrated view
──────────────────────────────
TRADE_DETAILS (JSON Format)
{
"instrument": "PLTR",
"direction": "call",
"strike": 99.0,
"expiry": "2025-04-17",
"confidence": 0.75,
"profit_target": 0.83,
"stop_loss": 0.37,
"size": 1,
"entry_price": 0.55,
"entry_timing": "open"
}

Palantir: Successful!PLTR effectively initiated a directional change within our now-gray Target Zone, and potential long trades opened within this range should already be significantly in the black. We locate the price in the corrective movement of the green wave , which should develop through the magenta waves (A) to (E) within a pink triangle formation. Ideally, the stock should remain above the low of wave (A), which has just been settled in our Target Zone. Only after the corrective movement has concluded do we expect the transition into the green wave , which should lead the stock to new highs. A premature breakout above the $125.40 mark is possible in our alternative scenario, but it is only rated with a 33% probability.

What’s Driving PLTR’s Recent Rally, and What’s Next?What’s Driving PLTR’s Recent Rally, and What’s Next?
Palantir Technologies (PLTR) has delivered a remarkable performance, surprising many investors and traders with its rapid ascent.
The stock surged from approximately $64 on December 20, 2024, to a peak of around $118 on February 11, 2025—an impressive 89% gain in less than two months.
This substantial rally raises an important question: Is PLTR at a critical turning point?
A key technical consideration is whether the stock will retrace to fill the $15 gap visible on the chart. Historically, gaps often get filled, but strong momentum can sometimes defy this pattern.
Traders and investors should closely monitor price action, volume trends, and any fundamental catalysts that could either sustain the uptrend or trigger a pullback.
As always, exercise caution and apply sound risk management strategies when trading.
📊 My chart analysis tells the story—trade wisely.

Palantir (PLTR) – What’s the Play?Hi all,
I've received a lot of questions about PLTR, so here’s my take:
Initially, if it were to approach $100 for the first time, I’d have nothing to say—it would be extremely risky, especially after the strong rally we've seen in recent months. The first approach to $100 can make strong retracements.
However, after analyzing the chart about a few weeks later, we got a solid weekly close above $100, which started forming a more structured setup. Now, there's at least a decent technical case for making a decision.
The highlighted box could be a reasonable buying zone—but keep in mind, this is still risky. Technically, it's shaping up, but your fundamental conviction should be strong.
Fun fact: In my home country, a well-known investor, Investor Toomas, has added PLTR to his portfolio. While that’s an interesting signal, we don’t know his holding strategy or reaction to current market moves but still, we can take it as a small confirmation from fundamental analysis.
Final Thought: Do your own research - buy it, skip it, the choice is yours! I can confirm that technically there is at least something to consider.
Cheers,
Vaido
🚀 Stay Ahead of the Markets - Get high-quality technical analysis, real investment ideas, and key price levels—without the noise.
📩 Subscribe to my Substack for expert insights that help you trade smarter!
📱 On mobile: Just scroll down and select your preferred language.
💻 On desktop: Find the links in my BIO —copy & paste or click the Website icon to go directly to Substack ENG.

$PLTR ready for a move (to the downside IMO)Clear squeeze setup forming at ATH after massive post-earnings momentum. Volume steadily declining over 5 days with significant volatility contraction. BB-KC squeeze (green bands compressing within Keltner) typically precedes major directional move.
Bearish thesis:
- Overbought conditions
- Volume decline
- Multiple timeframe squeeze potential
- Rich valuations
Trade plan if bearish break:
- Call credit spread above ATH wick
- Leveraged inverse ETF position
- Entries on volume confirmation + EMA breaks
- Stops: Above EMAs (if broken) or ATH (if holding)
Watching 4H/1D charts for squeeze alignment. Key trigger = strong red candle + volume spike.
⚠️ Risk management is critical here. Despite bearish setup, never underestimate bull market psychology on momentum names.
Position size accordingly. No trade is guaranteed.
#Trading #TechnicalAnalysis #PLTR
(Not financial advice - DYOR)

Palantir (NASDAQ: $PLTR) Soars 22% After Earnings BeatPalantir Technologies Inc. (NASDAQ: NASDAQ:PLTR ) has stunned the market once again, with its stock surging as much as 22% in extended trading following a blowout Q4 earnings report. The company not only exceeded analyst expectations but also provided an optimistic revenue outlook for 2025, further cementing its position as a dominant player in artificial intelligence and defense technology.
Strong Earnings and AI-Powered Growth
Palantir’s Q4 revenue came in at $828 million, significantly surpassing the estimated $776 million and reflecting a 36% year-over-year (YoY) growth from $608.4 million. The company also reported an adjusted earnings per share (EPS) of 14 cents, outperforming the expected 11 cents. Furthermore, adjusted income from operations stood at **$373 million**, representing an impressive **45% margin**.
These robust financial results were driven by increased demand for Palantir’s AI-powered software, particularly within its U.S. commercial and government sectors.
- U.S. Commercial Revenue: Up 64% YoY to $214 million.
- U.S. Government Revenue: Up 45% YoY to $343 million.
CEO Alex Karp highlighted Palantir’s early entry into the AI landscape, stating that the company’s vision for large language models has transitioned from theoretical to commercial reality. With AI adoption growing rapidly, Palantir’s position in the space continues to strengthen.
The company raised its Q1 2025 revenue forecast to between $858 million and $862 million, significantly above analysts’ estimates of $799 million. Additionally, Palantir now expects full-year revenue between $3.74 billion and $3.76 billion, outpacing the consensus projection of $3.52 billion.
Technical Analysis:
Palantir’s stock closed Monday’s extended session with a notable 22% surge, setting up a potential bullish momentum. As of Tuesday’s premarket trading, NASDAQ:PLTR was up 19%, signaling continued investor enthusiasm.
- Relative Strength Index (RSI): 65.49, indicating strong bullish momentum, though approaching overbought levels.
- Support Level: Immediate support lies at $77, aligning with the 38.2% Fibonacci retracement level. A drop to this level could present a buying opportunity.
- Resistance Level: A breakout above $97 could propel the stock toward $120, aligning with Palantir’s upward trajectory and bullish sentiment in AI stocks.
An important factor to note is the formation of an upside gap, which is a bullish signal but could eventually be filled over time. However, given Palantir’s strong fundamentals, the short-term technical outlook remains positive.
Analyst Upgrades: Bullish Targets Ahead
Several analysts have revised their price targets for Palantir following its strong earnings:
- BofA Securities raised its price target from $75 to $90, maintaining a Buy rating.
- DA Davidson increased its target from $47 to $105, while keeping a Neutral stance.
- Wedbush Securities’ Dan Ives compared Palantir to Oracle, predicting it could reach a trillion-dollar market cap in the coming years.
Conclusion:
With a massive earnings beat, strong revenue outlook, and AI-driven expansion, Palantir has reinforced its position as a market leader. Technically, the stock is experiencing a bullish breakout, and analysts remain optimistic about its long-term prospects. However, traders should be mindful of potential short-term pullbacks due to the recent gap-up in price.

Palantir: Get ready for earnings tomorrow!NASDAQ:PLTR earnings are on Monday
EPS: .11c
Rev.: 776M
I believe if they come in with 35% or higher revenue growth we will see George Washington!
If we see less than 30% growth, we will see $50's
What say you?!
Not financial advice

$PLTR - As I said: On a warpath to $100!NASDAQ:PLTR
Up 5% since I posted the original setup! 😉
$85 inbound!! 🎯
Not financial advice

Palantir - 30% Earnings move Inbound?!NASDAQ:PLTR
Are they gearing up for another big earnings move or will the expectations be too high?!
A breakout of this bull flag sends them higher!
🎯$85 🎯$95
Not financial advice

PLTR: Big Move Coming—Key Levels to WatchMorning Trading Family
PLTR is approaching a major decision point.
If the price breaks above $69.57, we could see a strong move up to $92 and beyond.
If the price falls below $66, the downside targets are $57–$59. If these levels don’t hold, watch for $49, $45, $39, and $36.
This is a critical moment—stay prepared for either direction!
Kris/Mindbloome Exchange
Trade What You See

Market Close Update: PLTR Continuation Outlook to New 52-Wk HighPLTR bounced on the Jan 3th, 2025, after finishing 2024 as the top stock in the S&P 500, rising 340% as it leaned heavily into artificial intelligence. It has since retraced and retested support, showing potential to continue pushing higher. We're looking for a current entry of around the $75 Price Levels to be positioned before tomorrow's Pre-Market Session, with a $74.60 Stop Loss and $79.98 Price Target going into the end of January. Even with it's recent bounce back, it's only $4.14 off it'sl 52-Week High meaning we could potentially see some heavy pushes higher above those $84 to at best, set new 52-Week Highs.
Follow us to connect and stay tuned for more at MyMI Wallet.
@MyMIWallet #MyMIWallet

Buy or Sell PLTR?Overview
Palantir ( NASDAQ:PLTR ) is a software company involved in data analytics and operations management. Its primary revenue is generated by subscriptions and government contracts. PLTR has been making headlines as a growth stock so the question remains, is it too late to get in on the action? The truth is that nobody knows so this is where the savvy investors will shine.
Fundamental Analysis
The stock is overvalued with a Price-to-Earnings (P/E) ratio of approximately 494. A massive P/E ratio tells you one of two things: (1) the stock is overweight and due for a correction or (2) there are high expectations for strong growth. The P/E ratio isn't the end all be all, but it's worth knowing to get a pulse on market sentiments.
YTD (EPS) Earnings-Per-Share: $390,982,000 / 2,459,589,000 = $0.16
(Q3 Nine Months Ended Net Income) / (Q3 Total Diluted Shares) = YTD EPS
P/E Ratio: 79.08 / 0.16 = 494.25
(Current Market Price) / (EPS) = P/E Ratio
This could be an exciting time to invest in PLTR, but precautions should be taken in the event that the Q4 Annual Report falls short of expectations and sends the share price barreling downwards. Expectations vary per analyst but here is what I would like to see on the next Earnings Release on Feb 12, 2025:
2024 Annual Revenue (approx): $2.9B (+30.34%)
2024 Annual Basic EPS (approx): $0.20 (+100.00%)
Q4 Revenue (approx): $849M (+17.02%)
Q4 Basic EPS (approx): $0.09 (+28.57%)
Since 2020, Palantir has experienced an average annual growth rate of 89.05% and became a profitable company in Q1 of 2023 (earnings released May 9, 2023). The share price has grown tenfold since then. If Palantir can maintain profitability and reliable growth, then the rally is probably far from being over.
Technical Analysis
There are no reliable technical patterns that can provide trading confidence at this moment. In times like this, I feel that less is more. I am only utilizing Fibonacci retracement levels and drawing basic support lines to dictate the depth of potential corrections. The use of oscillators such as MACD and RSI seem like they may prove to be more misleading than helpful.
Scenario 1:
If the share price continues to rally, then my short-term price target would be between $111 & $123 before I would expect to see any resistance. In the event mixed sentiments continue then Support 1 (white line) may not see the bulls taking control again until the price drops around $76.50. The 78.6% Fib level rests at $75.31 so any further drops from this price level would leave me hopeful of a strong support around $63.
Scenario 2:
If Support 1 fails entirely then Support 2 (yellow line) would likely contain the next significant support level. The share price could drop to as low as the mid 50s where there is a 50% Fib level.
Potential Trading Strategies
Getting a pulse on the market and financial health of a public company goes a long way to provide confidence, however, it's not airtight. A poor earnings release or unexpected bad news could deteriorate an investment in a short amount of time. Rather than staying out when in doubt, I've always enjoyed safely expanding my experience and awareness of available tools.
Stop-Loss Limit Orders
If I don't feel like supplementing my investment with derivatives then I place a stop-loss limit order to execute at whichever price level shakes my confidence. If the share price hits my stop-loss level then the next condition that needs to be met is my limit price. If the stop-loss was activated and the share price remains above my limit price, then it will automatically try to sell all of my specified shares at my limit price or higher.
Protective Puts:
Options contracts can be very intimidating for investors that aren't familiar with them. However, knowledge is power and options contracts can be very beneficial when used correctly. Whenever I buy shares in a company that I think is going to grow, but contradicts my impression of market direction, then I buy Protective Puts to shield my investment and give me peace of mind. This can either complement stop-loss orders or provide me the confidence to withstand turbulent price fluctuations without the risk of exiting my positions prematurely in the event that a stop-loss would become activated.
Cash-Secured Puts:
I'm new to writing contracts but I can see the allure. If I'm not confident that a share price is about to rally, or if I think that it may dip significantly, then I would consider a dollar-cost averaging strategy. My initial shares purchase would be a fraction of my available funds with the intentions of exposing my portfolio should the stock rally sooner than expected. In the meantime, I would write/sell Put contracts at strike price levels that I am both capable and comfortable of purchasing 100 shares per contract at. This strategy minimizes my exposure to gains and losses, while allowing me to collect premiums.
If those Cash-Secured Puts were exercised, then I would purchase 100 shares per contract at the contracts' strike price(s). This would effectively lower my cost-basis. If those contracts expire worthless then I get to keep the premium and my cash is freed up. If the stock begins to rally and I want to bail on my contract obligations so that I can get in on it, then I can buy-to-close the Puts at their lowered price and keep the difference as profits.

Next Small AI Stock Poised for a Breakout: $AIFU Next Small AI Stock Poised for a Breakout: NASDAQ:AIFU
AI stocks are the talk of the market, with explosive growth seen across the sector. Take NASDAQ:PDYN , for instance—it doubled in just two days! After digging into patterns behind such surges, I’ve spotted a small AI stock, NASDAQ:AIFU , that’s showing similar breakout potential.
### Why NASDAQ:AIFU Looks Promising:
1. Technical Pattern:
NASDAQ:AIFU ’s chart mirrors NASDAQ:PDYN ’s pre-surge behavior, forming a triangular consolidation pattern. With the stock near the apex and increasing volume, a breakout appears imminent.
2. Volume Spike:
Recent volume expansion is strikingly similar to NASDAQ:PDYN ’s activity before its massive price jumps, signaling heightened investor interest.
3. Fundamental Catalyst:
NASDAQ:AIFU recently completed a significant merger with BGM, which valued its assets far higher than expected. This deal is set to generate a notable accounting profit, likely to be reflected in its next earnings report—a potential game-changer.
### The Bottom Line:
Combining strong technical signals with a powerful fundamental catalyst, NASDAQ:AIFU could be the next big AI stock to surge. If you’re hunting for a hidden gem in the AI sector, keep an eye on this one!

A US Stock PLTR, Market structure update and strategy👋Hello Traders,
Our 🖥️ AI system detected that there is an D1 timeframe ICT Short setup in PLTR for Swing trade.
Technically it is clearly that a double top formation and a LG at second top.
Our idea:
if Closed below 71.0, it will find the next support level 63.6 above the demand zone.
There will be a good chance to buy after next accumulation next time.
Since we have stock on hand,
we will use Option strategy such as Short Call about 77 to collect premium.
For more ideas, you are welcome to visit our profile in tradingview.
Have a good day!
Please give this post a like if you like this kind of simple idea, your feedback will bring our signal to next better level, thanks for support!
