PLTR LongSo much confluence on this setup, with a good market sentiment and momentum i think it will have a huge run in no time. Very high watch for me, currently loading in the entry zone for starter position, will have a full position on the break of the wedge with volume. Happy trading :)
Pltranalysis

Bullish Divergence on the MACDBeginner Friendly
I love to see bullish divergence on the MACD(moving average convergence divergence) indicator. It usually always makes a bullish cross to the upside :)
Bullish Divergence:
To put it simple, when price action is making lower lows while the MACD is making higher lows, its considered bullish divergence. This is a good indication that a trend reversal is about to happen. Of course no one indicator is 100% accurate, so make sure to also evaluate the sentiment of the market/stock. I like to pair this indicator with the RSI (relative strength index) to get a better idea on where I should position myself in the trade.
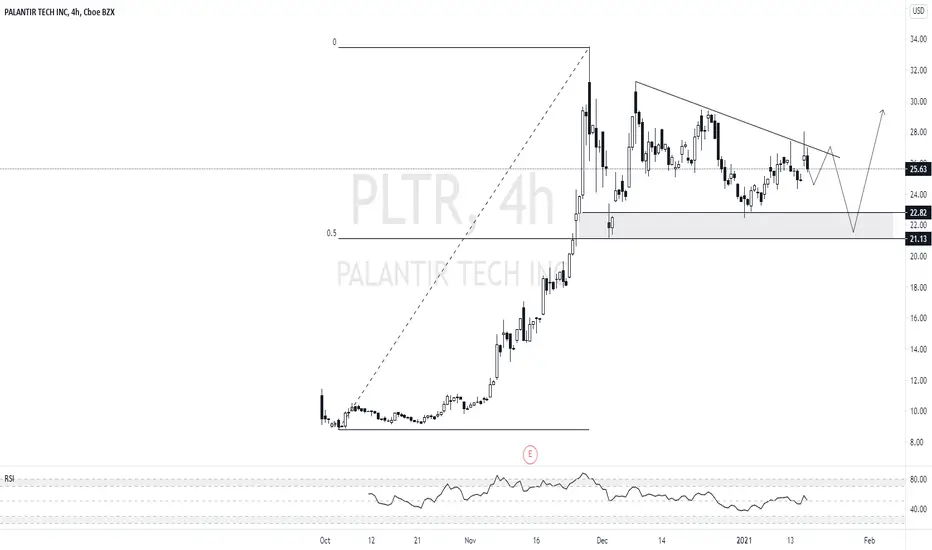
For example, lets take this PLTR chart:
Price Action is falling (making lower lows)
The MACD indicator is rising (making higher lows)
There was a bounce off of the support line as the MACD is crossing up
The RSI indicator is pretty low indicating that the stock is oversold
These make great conditions for a trend reversal. I would only take this trade once the cross is complete because remember, no indicator is 100% accurate. As stated in my previous post, I wont be hopping into this trade until a trend reversal is signaled because the market is too mixed for me.
I found a really awesome post that will help you understand different type of divergence's ---> Types Of Divergence
Thanks for reading, leave a comment and me know what you think!

PLTR to the moon !!!I have high hopes for PLTR it seems to have formed a pennant on the 4 hour timeframe and looks about ready to breakout. It is also respecting the support line that has been tested 4 times. Let's see what happens over the next day or two.
I'm already in multiple PLTR calls with April exp dates but am looking to size up should it break out of this formation with volume.
I'm not an expert and any critiques or advice is welcome :)

is $PLTR set for a new wave up ? PLTR has had a huge growth and is now facing major pullback, the price seems to be reacting to the previous support and looking for a bounce up.
Going long here seems to be a rational choice, but keep an eye on the $20-$22 range, because if the price goes below we may witness a huge sell-off.


PLTR *Potential* Inverse Head and Shoulders Potential inverse h/s forming. Note the volume on Friday. I have targets at 30, 32, and then 36.

PLTR BULLISH MOVEPLTR althought it was pretty red day i see inverted head and shoulders and im hoping it will bounce from here as it respect support area nicely aswell. still holding $
BEST DIP IF YOU WANNA BUY...

PLTR reversal to upside on huge volume & morning star pattern PLTR on 4 HR: showing signs of reversal to upside
RECENT NEWS
Cathie Wood's Ark Invest ETFs acquired over 6.8 million shares of PLTR last week.
TECHNICAL OBSERVATIONS
PLTR was trading in an upward channel but broke below the channel early last week (2/16).
Toward end of the week, PLTR recently bounced with huge volume with more institution buying.
NYSE:PLTR On the daily chart, the morning star candlestick pattern was created on Friday (2/19) which indicates a bullish reversal to upside.
SUPPORT & RESISTANCE
Resistance: $31.30 | $36.60 | $38.20 | $40
Support: $24.80 | $23.35

PLTR - DOUBLE TOP: LONG --> SHORTWe see a reversal pattern: "Double top". All the main conditions are met (volumes, uptrend, etc.). Now there is a breakdown of the "Neck" level. The theory tells us that after the breakdown of the "Neck" level, there is often a return movement to the "Neck" level, and then a further fall.
Plus, the drop is now at the 20 EMA (near $20), which often acts as a support level. This increases the probability of returning to the "Neck" level.
In this regard, it is advisable to open the Long to the level of the "Neck" (+8%), then turn over to the Short (+10%).

PLTR is clearly forming the McDonald's "Golden Arch" pattern. PLTR is clearly forming the McDonald's "Golden Arch" pattern. This is indicative of the prospect of the future price target being "Super-Sized".

PLTR load up... to the moon!PLTR after amazing an ER run up, stock price took a hard hit today as it dropped nearly 13%. PLTR earnings and beat analyst upgrades with a 41% growth in revenue from 2019 and is expecting to report a 30% yoy increase in revenue growth for 2021. Great add to your long term as they continue to spread their data analytic software to not only commercial customers but the government as well. Also founder of ARK Investment,Cathie Wood, has added this to her portfolio. From a TA standpoint, I can see more room for this to come down looking for a bounce near 24 to my wave c target to complete our abc correction before we start to form a 1-2 EW set up for a confirmed reversal. Now, if we gap up and we don't come down to get our dip entry, I wouldn't enter any short term swing and wait for a safe entry which would be a break and hold above 31. Good point here to go long with shares!
Key Levels:
Support: $25.30, $22.36
Resistance: $29.11, $30.92, $33.34, $37, $42.04, $45.19
Ways to Play This:
1. Buy Shares and HOLD!
2. LEAPS (year out option contracts, couple strikes OTM will suffice)
3. Swing minimum 3 week out exp. Option contracts
Option Ideas:
30C 3/5 2.30
30C 3/19 3.15
30C 1/21/2022 9.95
40C 1/21/2022 7.70
50C 1/21/2022 6.08
*Keep in mind these are contracts that catch my attention due to their liquidity (high vol and high OI) you can always go ITM or closer strike prices but my style is to go OTM unless ITM is cheap


Palantir should bounce here/ LONGPalantir is in a strong uptrend and I am expecting it to continue pushing higher, we should see storng PA at this level.

PLTR BULLISH LONGIf PLTR graph break occurs, BULLISH
Entry here is risky. Waiting for the chart break to buy the stock reduces the risk. Those who want to take risks can enter here and earn high profits.

PLTR Technical Gap Fill and Bounce UpDaily chart shows a small gap fill from a quick move to the upside. Once this gap fills from a pullback I see PLTR moving up from a bounce off the 9EMA
1HR and 4HR timeframes also show inverted head and shoulders pattern.

PLTR: Correction drop, but will be breakout again!PLTR: Considering some analysis to Palantir we can see that this company has a good standing, and also they are getting a lot of contracts. By technical view we can see that the stock is correcting itself now, after many traders were in, and it was expected a drop in price. But in the meantime if we see also with Fibonacci we can see a increase later on this stock. It was increased up to 40% in the begining, and now is stalling, but it will breakout on the days ahead.
In my opinion PLNTR is a worth investment. It is a bull stock!
NYSE:PLTR

PLTR stock was bought by ARK! where stock price go? Palantir (PLTR) we missed you in action in the last month and a half... I covered what the company does and how in the previous idea I wrote in Nov -link here
So Palantir acquired new contracts in the health sector last month and as it seems now – their technology can integrate in any major corporation and improve efficiency dramatically.
This means that Palantir will acquire new clients organically based on user experience that is proving as very efficient and successful – which is the best advertising you can ask for 😊
Shares of PLTR were acquired last night by the notorious ARK invest – they bought 497,100 shares exactly and this is the first time the company is acquiring PLTR which means to us they believe in the company but more importantly, they think the stock price is reasonable if not underpriced!
So, let’s go on technicals – this one is pretty easy and clear
• We had an impulse wave that took the stock above the 30$ line.
• Once wave ended and people abandoned the stock it dropped to 24$ line
• Now we see in the last month it formed a sideways trend between 24$ to 28$
• After ARK news I expect the stock to go to the 28$ line and retest resistance – this will be our first target
• Second target will be breaking through the 28$ and giving us a high on the 31$ line – touching previous resistance
• Third target will be after breaking the 31$ and going to 34$ where we have our highest high and doing accumulation on that level so the stock can potentially break out to new highs – even 40$, we saw the SAME exact behavior on JUMIA this month and it eventually broke out
If all targets are achieved in the upcoming week or two (the market is very fast these days) then we can aim to take some profits at 40$. if we see the PLTR dropping to the red zone on the chart at below 24.00$ we can assume this analysis is canceled and should be ignored
We at FDGT truly believe Palantir has a lot to offer and their product is going to disrupt technology and innovate it to new levels as artificial intelligence is here not just to stay but to take over and companies that will not combine artificial intelligence in their software will fall behind, so this is only the beginning of PLTR , and we are very bullish on this stock in the upcoming years
Closer look (1H chart) :
Please remember to do your own due diligence, we are not certified to give any financial advice.
Happy Friday !!! trade safe

US Stock In Play: $PLTR (Palantir Technologies Inc)$PLTR further reinforced its technical strength, with a rally of +11.20%, closing at an all time high level of $36.23 that was previously highlighted two days ago. The intraday trading range of $PLTR exceeded 35%, marking it as the most volatile session for $PLTR since its IPO. This is coupled with 191.35 millions worth of shares traded during the session, exceeding 165% of its average.
Price volatility for $PLTR continue to uptick towards its peak of $3.00/day, giving substantial traction to break $40 round number resistance ahead of its inaugural Demo Day today at 4.30pm US ET.


PLTR Support testAs we can see a range 25 novmenber. now we can expect a uper trend line test and then support test before bounce.
PLTR Moonshot - DAILY CHARTSee related ideas 👀🚀🚀🚀
I’m only posting this so you can see my trend lines and analysis on the daily chart which makes the intraday trading within the pennant more clear 🚀
