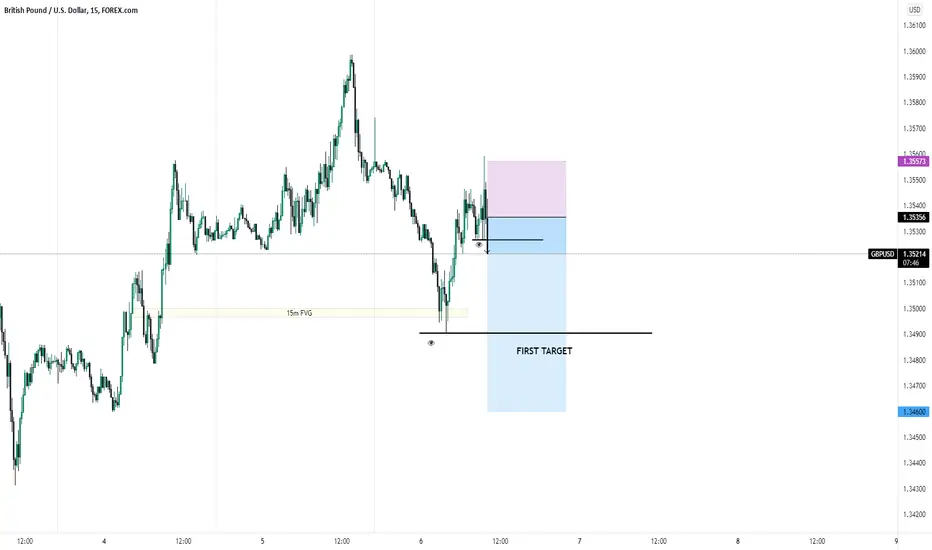
GBPUSD SELL trade ideaJust sold GBPUSD. After taking the buyside liquidity, after the PMI news release its going to take the sellside liquidity.
PMI
Euro edges lower as German PMI misses markWelcome to the first trading day of 2022! The euro is slightly lower in the European session, trading around 1.1350.
Eurozone Manufacturing PMIs for December pointed to growth across the bloc. France and Italy beat the consensus, while Spain and the all-eurozone PMIs were within expectations. The one disappointment was Germany, which came in at 57.4. This missed the forecast of 57.9 and was down from the November reading of 57.9. Supply constraints have hampered Germany's manufacturing sector and the pace of expansion has slowed significantly since the summer of 2021, when we were seeing readings in the mid-60s.
Germany will release Retail Sales on Tuesday. This key gauge of consumer spending has struggled, posting back-to-back declines. Another decline in December would raise a red flag and investors could sour on the euro.
Omicron cases continue to skyrocket, and although it is considered milder than other Covid variants, the sheer number of infected people is putting a heavy strain on health care systems worldwide. The US, Greece and other countries have shortened their isolation periods for infected people, and this could help cushion the economic blow from Omicron.
We are likely to see a surge in Omicron cases in the coming weeks, but the critical question for the markets is how sick are those people who are infected. Market sentiment has been high despite the soaring numbers, on the assumption that Omicron is not as severe as previous variants and will not cause a severe economic downturn. If we don't see a surge in hospitalisation rates and a return to lockdowns, I would expect risk sentiment to remain elevated.
EUR/USD has support at 1.1303. Below, there is support at 1.1232
There is resistance at 1.1456 and 1.1415

Long XLU short IWMIt is time to go defensive again. ISM PMI declining from expansion, historical high percentiles of distribution. US10Y going down together with ISM. Long Utilities as defensive sector, short IWM small-caps high-beta assets.
Best,

USD/CAD LongThis is a short term 4H long trade as we expect dollar to appreciate in value as the FOMC is expected to announce the tapering of the QE Program this week. The ISM manufacturing PMI at 4 PM GMT will be the key catalyst of this trade if it comes out POSITIVE and beat the market expectations. However is at 4 PM GMT the Manufacturing PMI comes out positive without the price reaching entry level, you are clear to take the trade.

EURUSD Going up - PMI beats estimatesHello Traders
Here is a new BUY Opportunity, Eurozone Preliminary Manufacturing PMI beats estimates with 58.5 in October
💹EUR/USD BUY STOP
✅ Entry @1.16450 or above
✅TP-1# 1.16650
✅TP-2# 1.16960
✅TP-3# 1.17450
✅SL# 1.15350
Source: www.fxstreet.com
JamdeJam will not accept any liability for loss or damage as a result of
reliance on the information contained within this channel including
data, quotes, charts and buy/sell signals

Triangle pattern In this post, we will analyze Forex Gold with the symbol XAU / USD. We review the fundamental news and perform a technical analysis according to the modern price action method and identify the appropriate points and signals.
Fall of gold
After the price of gold fell to 1722, gold entered a short-term uptrend, causing the price to jump to $ 1762.
Descending channel
In general, at intervals of more than 2 hours, gold is still inside a bearish channel and its price growth was up to the top of the bearish channel last night.
The downside of the channel acted as a resistance, pushing the price of gold to $ 1,751.
Triangle pattern
Now, in a period of 15 minutes, we see the creation of a triangular pattern whose lower side is between 1751 and 1750.
Fundamentals
The US PMI is scheduled to be released at 17:30 Tehran time. Forex analysts forecast a 0.3% decline.
The possibility of the dollar falling
But according to Powell and Ms Yellen yesterday, the PMI is expected to be lower than expected. This will weaken the dollar and strengthen gold.
So the formed triangular pattern can mark the green dots and the gold weekend will be bullish.
Signals
Suitable entrance area: 1752 to 1751
Profit Range Suitable Range: 1755, 1757, 1760
Suitable area Loss limit: 1749.5 to 1748.5

A prediction for eur/usdIn this post, we analyze the most popular Forex currency pairs, the EUR / USD or the Euro against the US Dollar. We identify important areas according to the fundamental news and modern price action and predict the signals.
A sharp drop in prices
Members of the Federal Reserve and the US Treasury Secretary commented on the decision to control inflation and reduce unemployment
Unemployment data from European countries such as Germany and France were also released.
European countries and the United States are in the post-corona era, accompanied by rising inflation, rising prices of labor and goods and services.
Rising inflation, on the one hand, and corona restrictions, on the other, have led to rising unemployment in Europe and the United States.
Federal Reserve
According to Mr. Powell, it is assumed that by the end of 2021 there will be no significant change in interest rates and inflation, and this will cause the dollar to depreciate.
Technical
The value of the euro against the dollar has reached one of its lowest levels in history, which was above the level of support from July 24 until yesterday. Level 1.156 is a strong resistance which is crossed several times during the night
The 1.159 ceiling is also an important resistance that was broken several times last night.
Forecast
I think the market is waiting for US PMI data to determine if the dollar is still falling. But according to the main news, the PMI is likely to be lower than expected.
This could weaken the dollar and strengthen the euro.
Signal
Buy between 1.157.6 and 1.157
Profits 1.159.8, 1.16, 1.162 and 1.165
Losses 1.156 to 1.155.5
Please read this prediction and comment

usdcad analysisIn the short term, there is an uptrend that is resisting at 1.27.
In the 1 hour time frame, there is a downward trend that started on September 20 and this trend continues due to the formation of successive H and L.
The downtrend will continue unless the price can cross the resistance level of 1.273.
Data on Canada's PMI and GDP will be released on Friday. This data is very important for the currency pair because it can have a direct impact on the value of the Canadian dollar against the US dollar.
In a period of 15 minutes, a triangular pattern is seen
However, in the downtrend, the price is likely to continue to the main level of 1.26 and then 1.258.
The stop loss in these transactions will be more than 1.273

MANU PMI - Green Agenda SchedulesSelections come into action the 3rd week of September,
when Global Derivatives square at the BIS.
Upcoming Elections:
Norway September 13, 2021
Russia September 19, 2021
CANADA September 20, 2021
Iceland September 25, 2021
Germany September 26, 2021

DXY - INDEX - 28 June 2021U.S. Dollar Currency Index Movements Analysis
Hope you use this carefully.
For More Tips and Education Follow and Please DO NOT Forget to Like :)

July PMI For 4 Major Economies (26 July 2021)Last Friday, IHS Markit released the preliminary PMI data for four major economies. Below are the key points from the individual reports.
United States
Services sector slowed down to a 5-month low pace due to labour shortages.
Manufacturing sector expanded at record high pace.
Prices of goods and services remained steep as firms pass on the high costs to consumers.
Total employment growth eased to 4-month low.
Business confidence declined to 7-month low mainly due to rising inflation, labour and material shortages, as well as rising concerns over the pandemic.
Europe
Services sector expanded at the fastest pace in 15 years due to reopening of economy from the lifting of COVID restrictions.
Manufacturing sector expanded at a slightly reduced pace due to supply constraints, which led to an increase in backlogs of work.
Employment continues to rise sharply.
Prices for goods and services rose as demand surpassed supply.
Business confidence declined to 5-month low as concerns over the COVID Delta variant grow.
United Kingdom
Business activities in the UK slowed down considerably due to shortages of workers and raw materials.
Backlogs declined due to a slowdown in business activities.
Business and consumer confidence fell due to the pandemic and Brexit-related difficulties with export sales.
Employment growth eased to the slowest level since March.
Australia
Services sector slipped into contraction for the first time in 11 months.
Renewed COVID restrictions caused by the spread of Delta variant affected demand and output in Australia.
Decline in demand in the services sector led to a decline in work outstanding.
Manufacturers continue to report shortages of supply, leading to an increase in work outstanding.
Employment in both the services and manufacturing sectors continue to grow.

The Fundamentals of Forex - Lesson 1 PMIIn the next following days I am going to work on a full education course designed for understanding the fundamentals behind Forex market and at the same time showing how it can be used for days trading using fundamental news strategy.
Our first lesson : U.S. ISM Manufacturing Purchasing Managers Index (PMI)
Understanding the ISM Manufacturing PMI and Non-Manufacturing Reports
The Service and Manufacturing sectors comprise the majority percentage of US GDP. As such it is important to gauge the overall health of these components. One of the most useful sentiment studies that can help traders and investors to forecast future economic trends is the ISM PMI Manufacturing report, and the ISM Non-Manufacturing report.
What is the ISM Non-Manufacturing Report ?
The Non Manufacturing Purchasing Managers Index (PMI) is released by the Institute of Supply Management (ISM). The Institute was founded in 1915, and was the first supply management institute in the world. The report on business is a composite index that helps measure the economic health of the US economy.
Though the Manufacturing PMI has been around for much longer, there was a need to measure the economic situation within the service sector as well. This is especially true since the service sector is attributed a majority percentage of US GDP in real terms As such the ISM Non-Manufacturing report was born. This report has been published by ISM starting in 1998.
The data is compiled from surveys of approximately 400 purchasing managers in over 65 various non-manufacturing industries including mining, agriculture transportation, retail, and more. The report is released on a monthly basis on the third day of each month and reflects the data for the previous month. The Non Manufacturing Composite Index (NMI) is based on four equally weighted indicators: New Orders, Business Activity, Employment, and Supplier Delivery. All of these indicators are seasonally adjusted expect for the Supplier deliveries.
Generally speaking, when the index is over 50, it demonstrates that the economy is growing, while an index of less than 50 signals a contracting economy. In addition, a better than expected reading is usually bullish for the US Dollar, and conversely a lower than anticipated reading is usually bearish for the US Dollar. Positive readings over time will also tend to help boost stock prices.
Typically, the ISM Non-Manufacturing Index has a somewhat diminished market impact compared to the Manufacturing PMI release. One reason for this is that the non-manufacturing sector is generally much less volatile and more foreseeable than its US Manufacturing Index counterpart.
What is the ISM PMI Manufacturing Index ?
PMI Manufacturing Index on trading view MAN_PMI chart
It measures the manufacturing output for a particular time horizon. The ISM PMI Manufacturing report is released every month, on the first business day of the month. The data reflects the prior month’s activity.
The manufacturing sector is an integral component of the overall economic health of a country. Although the manufacturing sector of the US economy is less than 15% of total GDP, it is nevertheless an important economic report and often highly watched by many Forex traders.
The report is produced by ISM and is a diffusion index, which basically means that it has various components that comprise the index. The resulting number is then updated to take into account seasonality factors. The PMI Index composite takes into account the following indicators: New Orders, Employment, Supplier Deliveries, and Inventories.
The ISM Manufacturing report is gathered by surveying over 400 Purchasing and Supply managers about their future expectations on production, inventories, employment, and new customer orders. The benchmark number is 50 for the index. So, if the number is higher than 50 then this hints of economic growth, while a reading of 50 or lower is considered to be contractionary.
The ISM PMI index is considered to be a leading indicator. It helps foretell future spending and expenditures that contribute to economic expansion. The indicator tends to reflect changes before the economy does. If there is an uptick in the PMI index, meaning there is more manufacturing output, then this is likely to lead to stronger economic considerations. And contrary to this, if there is a downtick in the PMI manufacturing index, meaning there is less manufacturing output, then this is likely to lead to weaker economic conditions.
Trading the ISM Numbers
As we have learned in the earlier section, an ISM composite index number above 50 indicates that the US economy is expanding. In addition, when the number has been above the 50 baseline for several months, it tells us that the economy is stable and strong.
Conversely, when the number is below 50 it indicates that the US economy is contracting. And a number that has been below the 50 baseline for several months, can warn us of a potential recession.
Aside from the longer term forecast that we can make using the ISM figures, short term traders, can take advantage of the ISM economic release for short term price movements. One of the more popular types of news trading methodologies using the ISM report is to trade a divergence between expected results and the actual figure that came in.
For example, if economists are expecting a reading over 55 and the actual index composite comes in at 52 or 53, then the market may react to this discrepancy after the release. In this case, fundamental news traders would likely expect the lower than expected figure to be bearish for the Dollar, and a day trading opportunity could exist to ride the short term momentum on a weakening Dollar.
You could sell the USD/JPY pair for example, or buy the EUR/USD pair for a short term day trade or scalp. However, this trading idea is a generalization and traders need to keep in mind other news events and/or technical levels that could override the ISM reading.
Real examples
For this analyse, lets take a look at EUR/USD pair since December 2020 using 15/30min time frame chart.
Rules :
Actual data is lower than forecast -> EURUSD LONG opportunity.
-> USDJPY SHORT opportunity
Actual data is higher than forecast -> EURUSD SHORT opportunity.
-> USDJPY LONG opportunity
Risk reward ratio : 1:1.5 OR 1:2
Also from my volatility calcuations over the last years, I found out that the best it should be to look for 10-20 pips movements in case of EUR/USD after the release of the PMI.
Release Date Time Actual Forecast Previous
Dec 01, 2020 (Nov) 11:00 57.5 58.0 59.3 -> EUR/ USD LONG OPPORTUNITY
In this case we would have won the trade
Release Date Time Actual Forecast Previous
Jan 05, 2021 (Dec) 11:00 60.7 56.6 57.5 -> EUR/ USD SHORT OPPORTUNITY
In this case we would have won the trade
Release Date Time Actual Forecast Previous
Feb 01, 2021 (Jan) 11:00 58.7 60.0 60.5 -> EUR/ USD LONG OPPORTUNITY
In this case we would have won the trade
Release Date Time Actual Forecast Previous
Mar 01, 2021 (Feb) 11:00 60.8 58.8 58.7 -> EUR/ USD SHORT OPPORTUNITY
In this case we would have lost the trade
Release Date Time Actual Forecast Previous
Apr 01, 2021 (Mar) 10:00 64.7 61.3 60.8 -> EUR/ USD SHORT OPPORTUNITY
In this case we would have lost the trade
Release Date Time Actual Forecast Previous
May 03, 2021 (Apr) 10:00 60.7 65.0 64.7 -> EUR/ USD LONG OPPORTUNITY
In this case we would have won the trade
Release Date Time Actual Forecast Previous
Jun 01, 2021 (May) 10:00 61.2 60.9 60.7 -> EUR/ USD SHORT OPPORTUNITY
In this case we would have lost the trade
Release Date Time Actual Forecast Previous
Jul 01, 2021 (Jun) 10:00 60.6 61.0 61.2 -> EUR/ USD SHORT OPPORTUNITY
In this case we would have won the trade
RESULTS
5 Wins and 3 Losses
Giving us a 60% win rate with a risk reward of 1:1.5

Gold fades bounce off 100-DMA inside $30 rangeGold prices remain pressured towards 100-DMA retests, reversing the previous day’s bounce, as the US dollar stays firmer and the market sentiment improves ahead of the key PMI data for July. Even so, the yellow metal stays inside the $1,795 to $1,825 trading range, comprising 100-DMA and 200-DMA in that order. It should be noted that the firmer PMIs are less welcomed as the virus resurgence pushes policymakers to keep the easy money flowing. The same could keep the range intact. However, stronger PMIs will back the Fed hawks ahead of next week's FOMC and drag the quote below $1,795, highlighting the importance of 61.8% Fibonacci retracement level and a four-month-old horizontal line, respectively around $1,767 and $1,756.
Should the gold buyers retake controls past PMI release, backed by market optimism, a confluence of 200-DMA and 38.2% Fibonacci retracement near $1,825 will be the key hurdle to cross. A daily closing beyond $1,825 will need only one validation from a monthly high of $1,834 before recalling the bulls targeting the early June lows near $1,855. Overall, gold prices remain lackluster and the monotony is likely to prevail for the rest of the week unless any big surprise shakes markets.

Brent oil buyers remain hopeful inside five-week-old channelAlthough the weekly falling trend line probes Brent oil buyers of late, the commodity prices remain inside an ascending trend channel from May 27, not to forget staying beyond 100-SMA. The same joins an upbeat RSI line to keep buyers directed towards an immediate resistance line of $76.00. However, any further upside will be questioned by the stated channel’s upper line, close to $77.50. In a case where the oil bulls remain dominant past $77.50, the late October peak surrounding $78.00 may test the rally targeting the $80.00 psychological magnet.
Meanwhile, pullback moves become less concerned until staying beyond the 100-SMA level of $74.10, needless to mention the channel support of $74.50. Also acting as a downside filter is the $74.00 mark, a break of which will make the quote vulnerable to decline towards the mid-June lows near $72.00. It’s worth noting that Thursday’s US ISM Manufacturing PMI and Friday’s US NFP, not to forget Thursday’s OPEC+ meeting, become the key events for energy traders.

Impact of cold winter retreat, US durable goods new orders rebouThe year-on-year increase of US durable goods reached 25.02% (previously 3.2%), with an absolute value of $256.3 billion (previously $254 billion).
Year-on-year increase of nondefense new orders for capital goods reached 11.59%, to $75.9 billion in March.
MM Analysis
As the impact of cold winter retreat, nondefense new orders for capital goods reached $75.9 billion in March.
The gap between the annual growth rate of new orders and the uncompleted orders continued to expand, indicating a large amount of backlog orders, it is still in the stage of restocking.
It is expected that in Q3, under a new round of 1.9 trillion fiscal spending, there would be a strong support (February savings rate: 13.6%). Driving companies to continue to invest in restocking inventory and continue the manufacturing restocking cycle as the March manufacturing PMI and retail sales data also set new highs at the same time.

US: Strong economic data lift stocks to record highsUS Non-farm Payrolls up 916K in March, unemployment rate dropped from 6.3% to 6%. The March Manufacturing PMI registered a record high 64.7 percent, and the March Services PMI registered at a 16-year record high 63.7 percent.
As we mentioned before, the US economy in Q2 would be benefited by the Manufacturing and Services industry.
MM Analysis
US Non-farm Payrolls up 916K in March, unemployment rate dropped from 6.3% to 6%. In particular the education and health services up by 101k and the professional and business services up by 66k, showing that the vacinnation has helped the SMEs to recover. Construction ( + 110k ) and Manufacturing ( +53k ) industries has also backed strong support on the US economy recovery.
The March Manufacturing PMI registered 64.7 percent, an increase of 3.9 percentage points from the February reading of 60.8 percent. New orders 68 percent, Production 68.1 percent and Backlog of Orders 67.5 percent are in a fast growing direction. Customers’ Inventories 29.9% has been at historically low levels.
Besides the above indexes, a low inventory-sale ratio on January shows that manufacturing cycle would continue due to the capital injection by the US government.
The March Services PMI registered at a 16-year record high 63.7 percent, an increase of 8.4 percentage points from the February reading of 55.3 percent. Employment 57.2%, comments from respondents include: “Have recalled everyone put on waivers and made new hires” and “Additional employees added to service the need of new customers at new locations.” Showing a high probability for corporate to hire more and a optimistic outlook on the labor market, boosting consumer confidence and the US Q2 economy.

VWO - Emerging Market Macro Analysis The macro data from this month's Markit PMI's is sending a bit of mixing signals from the countries that VWO has the most exposure to, but I am still optimistic as to the near-future performance of the emerging markets.
Before going into the macro analysis, whats the market allocation of this ETF.
The 80% market allocation is the following:
- China -> 42.5%
- Taiwan -> 16.5%
- India -> 11%
- Brazil -> 5.9%
- South Africa -> 4.1%
After a quick look at the list above, we can see that China and Taiwan are almost 50% of the market allocation, so it is important to follow their situation closer.
China Macro Overview
China PMI's are sending mixed signals regarding the growth of Chianese economy, with a possible hint as to slow down in the next few months.
The manufacturing report is showing a slow down in growth in the production and new orders.
The new export orders are declining again below the 50 level, which indicates a possibility of contraction, there is also an indication of rising costs.
And that's likely to reflect in the results of Q2, or even in the Q3.
Taiwan Macro Overview
In comparison to Chinese PMI's, Taiwanese reports are much more optimistic, with strong growth in the last months.
January Manufacturing PMI is reporting growth in Output and New Orders, which are leading indicators in themselves.
Employment has increased substantially, which is a good indicator as to the health of the Taiwanese economy in the current situation.
In my opinion, the Taiwanese companies will lead the performance in the VWO for the next few months.
Indian Macro overview
India is another country reporting growth in January if we keep in mind the allocation size in this country in this ETF, it gives an optimistic outlook for its performance.
New Orders, Exports and Outputs are rising for another consecutive month. The employment situation is still contracting but at lower levels than before. That may be an indication of possible employment growth soon.
The overall outlook for the Indian economy is positive and in conjunction with positive data from Taiwan, that's good news for the emerging markets.
Additional Macro overview
Brazil, South Africa are other countries in the top 5 of the allocations for this ETF. Their allocation size is reasonably smaller than the countries above so I won't go into much detail.
Brazil situation is not very bright, as to the information provided by PMI reports, even that manufacturing showed slight improvements, the services are contracting again.
The situation in South Africa seems to expand but at a slow pace, there are still many concerns as the effects of the pandemic on the overall economy.
Final Opinion.
As we can see from the macro overview of the countries, which are the key components of the market allocation of this ETF, the outlook is mostly positive.
Some may be concerned by the mixed data from the Chinese PMIs since China is the biggest player in this ETF, it may affect the performance. However, there is a positive outlook for Taiwan and India.
I believe they will compensate for the possible slow down in China, and it'll drive the EM performance for the next few months.
Sources:
- Caixin China General Manufacturing PMI
- Caixin China General Services PMI
- IHS Markit Taiwan Manufacturing PMI
- IHS Markit India Manufacturing PMI
- IHS Markit India Services PMI
- IHS Markit Brazil Manufacturing PMI
- IHS Markit Brazil Services PMI
- IHS Markit South Africa PMI

Dax daily: 24 Jul 2020For yesterday, we expected the retest of 13 235 followed by a possible correction to the downside. Buyers were not able to get all the way to this level as bears took dominance of the market. The whole intraday session was then characterized in a clear directional move to the downside and this lasted till the close. Dax corrected its uptrend of the past days and the pice is comfortably below 13 119 and near the support of 12 882.
Important zones
Resistance: 13 119, 13 235
Support: 12 882
Statistics for today
Detailed statistics in the Statistical Application
Macroeconomic releases
09:15 - 10:00 CEST - Eurozone PMIs
Today's session hypothesis
After seeing yesterday's price action with the close at its low, the scenario offered itself to break the previous day's low. Regardless, Dax opened with a descending gap and fulfilling this thesis right away. At the time of writing, the price is correcting its drop and chances are to see the gap closure early in the morning trading session. We anticipate today's session to remain above the support level of 12 882.

So... What is next? Shortest recession in play?Stock market - Against all odds, S&P index has risen almost 32% since hitting a low for the year on March 23. The fact that it happened after a ferocious plunge of 35% between Feb. 20 and March 23, the most devastating sell-off since the great depression, made the feat even more remarkable.
As a matter of fact, the market posted its best quarter since 1998, with Nasdaq leading the way by soaring 30.6% for the quarter, the most since 1999.
Some speculated that the fast recovery was due to the big outflow of money from the fixed-income market into the stock market as emerging market fails to meet its debt obligation.
Others credited young investors (medium age of 31) on Robinhood (3 millions user added 2020, 13 millions total) with stock market's spectacular rally.
I personally doubt that the combined purchasing power of all Robinhood users is strong enough to sway the stock market.
Nonetheless, the stock market performance is not representative of the entire economy as there are more than 30 millions small & mid-sized company not listed on major U.S stock exchanges
GDP - What is even more incredible about the stock market's recovery is that it all happened after various sources estimated the GDP contraction to be around 30% to 50% in second quarter
Recently, Fed and policymakers projected the economy to shrink 6.5% (medium projection) in 2020 and the unemployment rate to be 9.3% at the end of the year
Corporate earning - According to data from S&P Capital IQ, 40 percent of the S&P 500, about 200 companies, have withdrawn their guidance and declined to make EPS estimate in 2020.
This lack of guidance has caused a lot of problem for the prediction of corporate earning.
A recent analysis by CNBC earnings editor Robert Hum showed enormous differences at historical level between the high and low estimates for the largest stocks in the S&P 500.
According to numbers compiled by the data provider FactSet, second-quarter profits will fall more than 40 percent.
Refinitiv is projecting about a 43% drop in second-quarter earnings.
Expect to get a more clear picture of corporate earnings around mid-July as banks release their corporate earnings.
Even though the stock market is reflecting more of future sentiment than current economic condition, the speed of its recovery seems to indicate that most investors believe that not only will the market erase all the losses in 2020, but also it will quickly resume the long-term growth trend equals that of 2019, which seems highly unlikely to me.
Again, it is hard not to notice the massive distortion between the stock market's performance and corporate earning.
Unemployment - Initially, the hope is that most temporary layoffs would not turn into permanent job loss. However, as lockdown extends, many furloughed employees are at the risk of becoming unemployed as more and more small businesses going out of the business.
Roughly 20 million Americans are currently receiving unemployment benefits and the insured unemployment rate is still high at 13.4%.
BLS said that discrepancy in unemployment # due to "misclassification" has been adjusted accordingly. An alternative measure of unemployment that includes discouraged workers and the underemployed fell to 18% from 21.2%.
Overall, better than expected unemployment # and steadily declining initial claim and continuous claim # have painted a much better picture for the labor market.
However, unemployment remains at historic levels. Output and employment remain far below their pre-pandemic levels, according to Federal Reserve Chair Jerome Powell
Pandemic - WHO reported around 180,000 new coronavirus cases last Sunday, the single-largest increase since the pandemic began, with two thirds of new cases coming from the Americas. Around half of the 50 U.S. states were also reporting a rise in new coronavirus cases, most notable in southern states that were previously spared from the Covid-19 ravage.
On Tuesday, United States recorded the biggest single-day rise in new cases since the pandemic began.
According to Bloomberg report, most experts believe a vaccine won’t be ready until next year.
Other factors -
Trade war with China and upcoming election...
#1. Median existing-home price last month was $284,600, up 2.3% from May 2019.
#2. The 30-year fixed-rate mortgage averaged 3.13% for the week ending June 18. Mortgage rates have drop to another record low.
#3. The number of Americans applying for home mortgages has hit an 11-year high.
#4. An index measuring homes in contract to sell, or pending sales, jumped by a record 44% in May.
#5. A record spike in U.S. retail sales, though the recovery happened after a huge dive of retail sales a month earlier.
#6. PMI has surged sharply after a huge plunge since the pandemic started. It is possible that the # is skewed by the lack of small business participation and the effect of China re-opened its economy ahead of other major economy.
I believe most current home buyers are not heavily impacted during this economic downturn and their purchase decisions are probably not indicative of the economic recovery.
Shortest recession is made possible because this economic crash was driven by the uncertainty of pandemic rather than economic fundamentals? I don't know. But if you only look at real estate and stock market, it surely seems so.

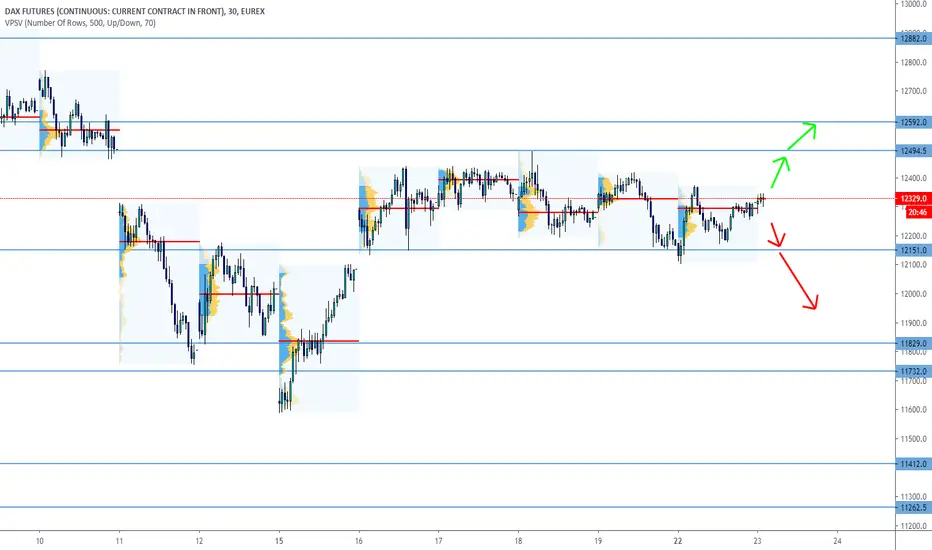
Dax daily: 01 Jul 2020Tuesday's session was considerably slower to what we are used to. Once the session opened, Dax took a direction to break the previous day high, as suggested by the Statistical application. The day was closed in the black numbers but the volatility was really low. Dax remains in the consolidation range where the odds are still neutral.
Important zones
Resistance: 12 494
Support: 12 151
Statistics for today
Detailed statistics in the Statistical Application
Macroeconomic releases
09:15 - 10:00 CEST - Eurozone PMIs
20:00 CEST - FOMC Meeting Minutes
Today's session hypothesis
The month of July opens with a descending gap and we expect the closure, also for the reasons that Dax is still in the consolidation range and the trading activity is mostly sideways. We don't have a clear directional bias and our key S/R zones remain unchanged. Keep an eye on the Eurozone PMI reports in the morning session and the FOMC later in the US session. There is no clear scenario as of now, and we're awaiting what markets offer.

Dax daily: 23 Jun 2020Dax gave us a fake signal yesterday when it faked-out below the 12 151 S/R zone. The price very quickly returned to the consolidation range of the past week, levelled between 12 151 and 12 494. The daily range was relatively standard and we haven't even seen much volatility.
Important zones
Resistance: 12 494
Support: 12 151
Statistics for today
Detailed statistics in the Statistical Application
Macroeconomic releases
09:15 - 10:00 CEST - Eurozone PMI reports
Today's session hypothesis
Considering the fact Dax hasn't moved away from its consolidation range lasting one week already, we have no reasons changing the outlook. The Statistical Application also doesn't generate any probabilities in these situations and Dax awaits any decisive catalyst that will propel the price development. This could be today's PMI reports from the Eurozone or volatility in the main US Indices. These appear to be on the crossroad between the artificial positivism of re-opening the US economy, as created by Trump's administration, and a fear of the upcoming second wave of the pandemic. We now need to monitor the price action but mainly the breakout from the current consolidation.
PHILIP MORRIS prediction till 2023 year by Powerful TradersHello everyone!
Traders, we do not like to write more.
The prediction of the PING AN' price you can find on a chart!
Regards, Team Traders "Powerful Traders"

USDCAD EYING 1.37USD/CAD breached the support at 1.3730 and moving short to 1.3600.
USD/CAD gained downside momentum as the U.S. dollar continued to lose ground against a broad basket of currencies.
The U.S. Dollar Index is trying to settle below the 98 level as the American currency is under pressure amid increased demand for riskier assets.
The U.S. Manufacturing PMI increased to 39.8 in May compared to 36.1 in April. Canada’s Manufacturing PMI also rebounded from 33 in April to 40.6 in May.
Numbers below 50 indicate contraction, but the rebound in PMI shows that economies are starting to recover from the acute phase of the coronavirus crisis.
Traders focused on the recovery from the coronavirus crisis, providing support to riskier currencies like the Canadian dollar.
Breakout Indicator signlling more short to come.
