PNUTUSDT Analysis D1PNUTUSDT Building Up For Solid Breakout, Test Descending Trendline & On Verge Of Solid Breakout, usually This Type Consolidation Under Resistance Lead Massive Breakout, Expecting 2x After Breakout.
PNUTUSDT

PNUTUSDT Ready to Rally!PNUTUSDT Technical analysis update
PNUTUSDT is breaking out of a wedge pattern on the daily chart after three months of formation. We also observed a bullish RSI divergence in the daily timeframe, along with a MACD bullish crossover a few days ago. A 50–100% move could be seen in the mid-term.

PNUTUSDT 1D AnalysisPNUT ~ 1D Analysis
#PNUT Buy gradually from here with a short -term target of at least 10%+ from here.

PNUT / USDT – Daily AnalysisBullish divergence spotted!
Price is printing lower lows, but RSI is making higher lows — a classic bullish divergence pattern. This signals potential trend exhaustion on the downside.
#PNUT is holding above a horizontal support level around 0.12–0.13 USDT, aligning with the divergence signal.
Volume is tapering off, indicating decreasing selling pressure.
RSI is currently around 37–38 and showing a higher low structure.
Key levels to watch:
Support: 0.1220–0.1300 USDT (current demand zone).
Resistance: 0.1650 USDT (local high), followed by stronger resistance at 0.2000–0.2200 USDT.
Scenario ideas:
If PNUT can hold above support and RSI continues climbing, we might see a relief rally towards the next resistance zones.
A breakdown below 0.1220 would invalidate this bullish setup and could lead to continuation of the downtrend. Still... bullish divergence then will become even more obvious....
Bias:
bullish short-term, watching for confirmation.
⚠️ Not financial advice. Always manage your risk!
#PNUT #Crypto #Altcoins #BullishDivergence #RSI #TradingView

Peanut the Squirrel PNUT price analysis🐿 For #PNUT holders, there is good news and a little bit of "not so good" news)
🟢 Good - the formation of a reversal pattern continues
🟡 Not so good - so far, buyers have not managed to gain a foothold above $0.26
As soon as this happens, OKX:PNUTUSDT price will go up to at least $0.40 and $0.57
_____________________
Did you like our analysis? Leave a comment, like, and follow to get more

PNUTUSDT 1DPNUT ~ 1D Analysis
#PNUT Buy after successfully penetrating this resistant line or buy after re -testing this support block with a short -term target of at least 15%+.

PNUT looks bearish (4H)It appears to be completing a triangle, currently in Wave E.
From the red zone, it may move downward.
Below the chart, there is a liquidity pool, which could be the price target for a sweep.
The invalidation level is slightly far, so proper risk management and position sizing should be maintained
For risk management, please don't forget stop loss and capital management
When we reach the first target, save some profit and then change the stop to entry
Comment if you have any questions
Thank You

PNUT Sell/Short Setup (2H)A large liquidity pool has formed below the price.
We have not yet seen a bearish CH on the chart, but in the supply zone, considering the invalidation level as a stop, we can enter a sell/short position.
If the invalidation level is touched, it will invalidate this setup.
Do not enter the position without capital management and stop setting
Comment if you have any questions
thank you

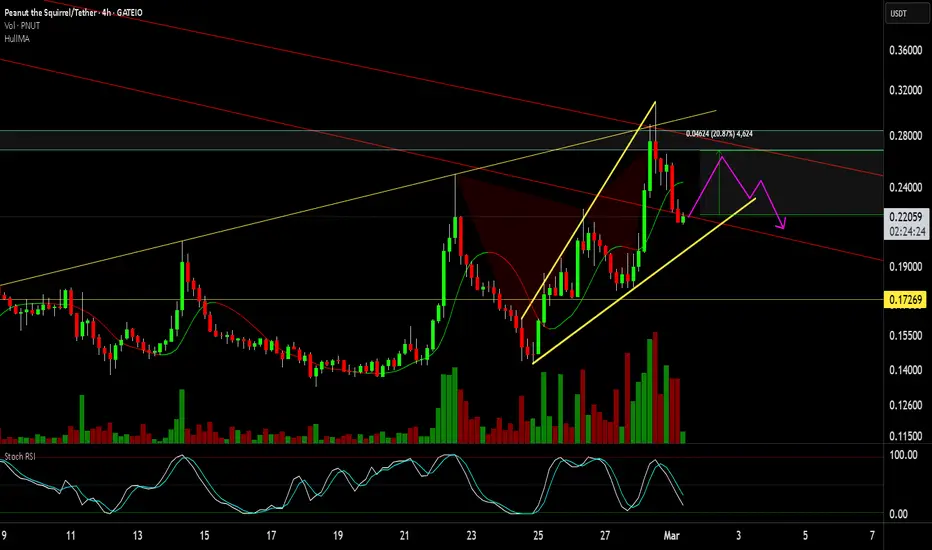
PNUT Ascending Broadening WedgePrice completed a Harmonic pattern with subsequent decline to 0.21 and is now within an Ascending Broadening Wedge, which is a bearish pattern. Just posting what I see and the potential that could play out...
PNUT price analysisPerhaps the #PNUT price is forming a reversal pattern
But until OKX:PNUTUSDT is firmly established above $0.26, the price will remain in the falling channel and you can get the “3rd bottom” as a gift...)
🔼 But above $0.26, there will be room for growth, at least to $0.57
_____________________
Did you like our analysis? Leave a comment, like, and follow to get more

Peanut the Squirrel (PNUT/USDT) - Bullish Setup 1HPNUT is showing strong bullish signals on the 1H chart. Several technical factors suggest a potential upward move:

PNUTUSDT(PeanuttheSquirrel) Updated till 22-02-25PNUTUSDT(PeanuttheSquirrel) Daily timeframe range. 0.1356 is like its last low from its old data. breaking that will push it down to price discovery. buyers trying to hold it now pushing it to 0.2273. thats recent resistance.

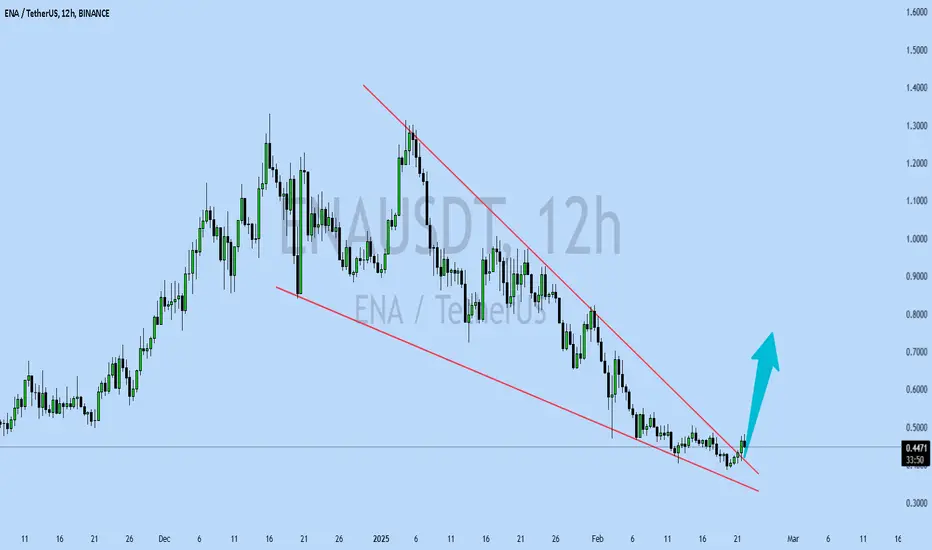
ENAUSDT UPDATEENAUSDT is a cryptocurrency trading at $0.4483. Its target price is $0.7500, indicating a potential 70%+ gain. The pattern is a Bullish Falling Wedge, a reversal pattern signaling a trend change. This pattern suggests the downward trend may be ending. A breakout from the wedge could lead to a strong upward move. The Bullish Falling Wedge is a positive signal, indicating a potential price surge. Investors are optimistic about ENAUSDT's future performance. The current price may be a buying opportunity. Reaching the target price would result in significant returns. ENAUSDT is poised for a potential breakout and substantial gains.
PNUT buy/long setup (4H)Given the clearance of the resistance order block, a bullish iCH, the formation of a support zone, and the preservation of the low, we can look for buy/long positions on PNUT with a setup that offers a favorable risk-to-reward ratio.
The green zone marks the entry area for the position, while the targets are indicated on the chart.
If the invalidation level is touched, this setup will be stopped.
For risk management, please don't forget stop loss and capital management
When we reach the first target, save some profit and then change the stop to entry
Comment if you have any questions
Thank You

$PNUT - The Peanut TrajectoryBINANCE:PNUTUSDT - Finally i think, its time to push massively on top after a huge bearish pullback from the highs. This zone looks about right to create some huge potential. Play it easy though as its very risky.

PNUT COIN PRICE ANALYSIS AND NEXT POSSIBLE MOVES!!$PNUT Coin Update!!
• Until Price Holding its current Support area... 30%-50% any time pottential bounce back expected in comming days.
• Without SL Don't Build any trade on it🚨
Warning : That's just my analysis DYOR Before taking any action🔥

$Pnut Buying CMP DCA 0.097
$0.2682
3.23% (1d)
Market cap
$268.2M
3.23%
Volume (24h)
$172.68M
23.39%
FDV
$268.2M
Vol/Mkt Cap (24h)
64.79%
Total supply
999.85M PNUT
Max. supply
--
Circulating supply
999.85M PNUT

PNUT Coin Price Analysis and Next Possible moves !!$PNUT Coin Update!!
• $PNUT Coin Break now its All support areas on HTF'S... Now any time bounce back expected in its price✅
• If it's price bounce back from current area then with SL I will build trade on it... Otherwise from 0.24$ & 0.225$ pottential bounce back expected🫡
Warning That's just my analysis DYOR Before taking any action🚨

PNUT COIN PRICE ANALYSIS AND NEXT SHOERT-TERM POSSBLE MOVES!!$PNUT Coin Updates!!
• In $PNUT Coin Near Me Potential Bounce back Expected from 0.325$-0.29$ area.. Where you are able to build proper trade setup.
•its current local support is0. 365$.
Warning : That's just my idea DYOR Before taking any risk🥷

PNUT buy/long setup (12H)We previously identified PNUT's fluctuations effectively.
Based on recent data, it’s better to expand the PNUT pattern and classify it under a larger Triangle or Diametric structure.
We are again looking for buy/long positions around the green zone. This is a strong origin kink.
Targets are marked on the chart.
A daily candle closing below the invalidation level will invalidate this view.
For risk management, please don't forget stop loss and capital management
Comment if you have any questions
Thank You

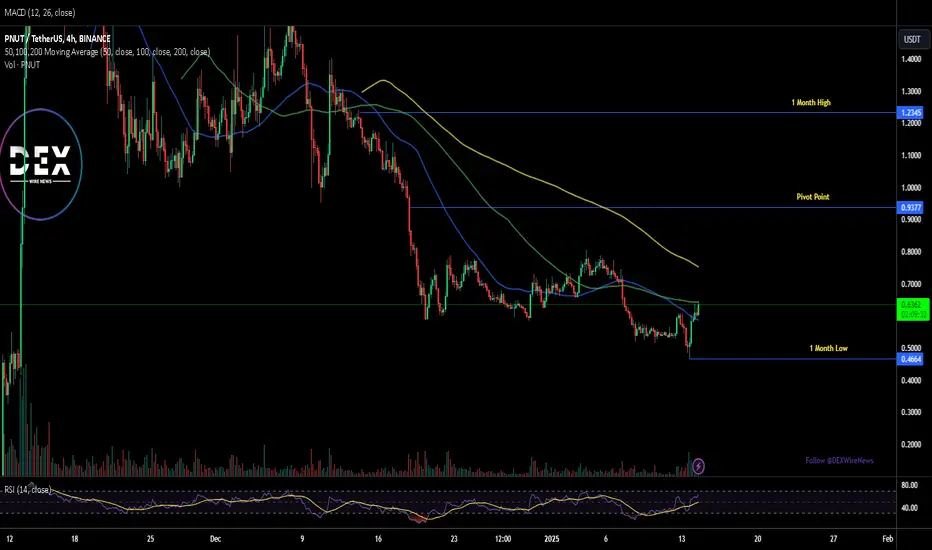
Just In: Coinbase Adds PNUT Meme Coin on Solana NetworkCoinbase has officially announced the listing of Peanut the Squirrel (PNUT), a Solana-based meme coin, for trading on January 14, 2025. The news has already sparked a 10% price surge for PNUT, though the token still trades below its all-time high. Let’s delve into the technical and fundamental aspects surrounding this development.
Key Highlights
1. Coinbase Listing Details:
- PNUT-USD trading pair launches on January 14, 2025, at 9:00 AM PT.
- Token transfers for PNUT are live on Coinbase and Coinbase Exchange.
- Trading will be rolled out in phases based on liquidity conditions.
2. Immediate Market Reaction:
- PNUT’s price rose from $0.48 to $0.59, a 10% increase.
- Trading volume surged over 107%, reaching $431.71 million.
- Despite the rebound, PNUT remains 79% below its all-time high of $2.47, recorded in November 2024.
3. Historical Context and Legal Challenges:
- PNUT originated in late 2024 following the controversial euthanasia of a pet squirrel named Peanut, which galvanized community support.
- Legal disputes have since arisen, with Mark Longo, Peanut’s owner, suing Binance for alleged unauthorized intellectual property usage to promote the coin.
Technical Analysis
From a technical perspective, PNUT exhibits strong potential for further gains: PNUT’s recent price action forms a bullish engulfing pattern, signalling a potential upward trend. The Relative Strength Index (RSI) indicates that PNUT is not yet overbought, providing room for further price growth.
Immediate support lies at the one-month low axis, providing a safety net in case of a pullback. The next resistance point aligns with the 38.2% Fibonacci retracement level, which traders are eyeing for a potential breakout.
PNUT’s unique narrative and community support position it as a potential standout in the meme coin category. The Coinbase listing, coupled with strong technical indicators, creates a favorable environment for a potential rally toward $1 and beyond.
Conclusion
The listing of PNUT on Coinbase marks a pivotal moment for the Solana-based meme coin. With a bullish technical setup and growing community support, PNUT is well-positioned to capitalize on its newfound exposure. However, investors should remain cautious of potential legal and market risks. As the crypto industry evolves, PNUT’s journey underscores the power of community-driven innovation and the unpredictable nature of meme coins.
Stay tuned for more updates as PNUT’s story unfolds in the coming weeks.
PnutBINANCE:PNUTUSDT
📊 **Pnut Current Price: 0.6058**
- We're currently facing a **resistance** level at this price 🔴.
💥 If we break this resistance, the next levels to watch are:
- **0.6534** 🚀 (First target)
- **0.7433** 📈 (Next level)
- **0.8000** 🌕 (Major resistance)
🔻 **If the price doesn't hold above 0.6058**, we might see a dip to **support levels**:
- **0.5500** ⚖️ (First support level)
- **0.4500** ⬇️ (Stronger support)
---
So, if the price breaks through resistance, we could see a bullish move. But if it falls below 0.6058, keep an eye on those support levels for possible rebounds! 💡
**Note:** This is not financial advice! Always do your own research. 📉📈

PNUTUSDT 12HPNUT ~ 12H
#PNUT One of these support blocks will bounce the price for this coin.
If you still have Conviction on this coin,. Buy on retest of this support
