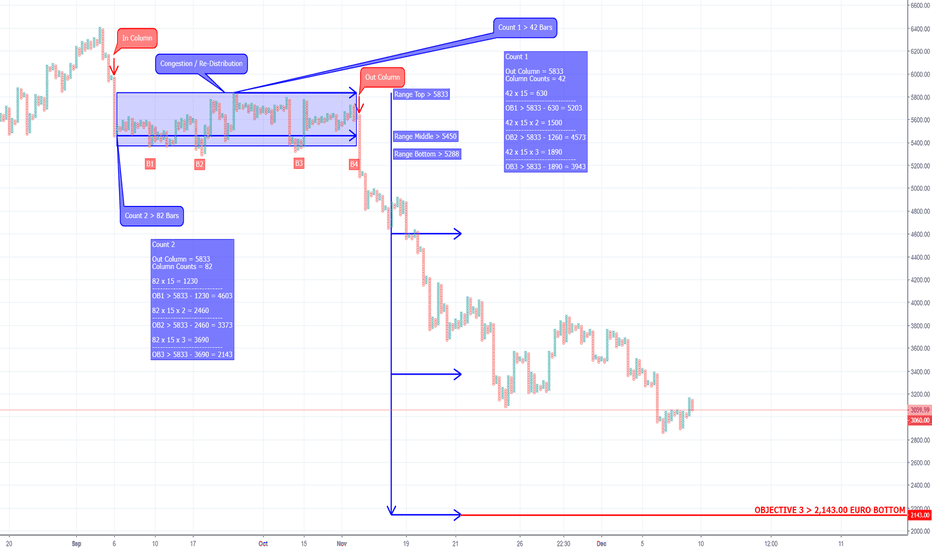
Point and Figure Trend Line Indicator with AlertsMy Pine Script indicator, "PnF Bullish and Bearish Trend Backgrounds," visualizes bullish and bearish trends using Point and Figure (PnF) methodology.
Summary:
Input Parameters:
Box Size: Determines the price movement sensitivity.
Bullish/Bearish Angles: Set angles for defining trend slopes.
Trend Calculation:
The script calculates slopes based on input angles and updates trendlines based on price actions.
Alerts:
It generates alerts when price breaks bullish or bearish trendlines, signaling potential buy/sell opportunities.
Visualization:
Trendlines are plotted in green (bullish) and red (bearish), with background colors highlighting trendline breaks.
Background: Green (uptrend) Red (Downtrend) Overlap or Black (Neutral)
Usage:
Add to Chart: Load the script on TradingView.
Monitor Alerts: Keep an eye on alerts for trendline breaks.
Analyze Trends: Use the visual cues to identify potential market movements.
I'll release a video explanation of this indictor soon.
Pointandfigurecharting
Point & Figure Charts DO WORK on TradingviewI have been studying Point and Figure (PnF) for some time now and was uninspired by the basic charts that were available. I noticed Tradingview did offer a Point and Figure chart but found it difficult to correctly configure the scales and relative 45 degrees angles as per the fundamentals.
After some tedious work I have produced an indicator that produces the correct scaled PnF angles as per the fundamentals and have found PnF a very successful way to trade.
PnF does work on Tradingview. If you are a fan of Price Action (because there is no time involved) this may be for you.
I'll make my indicators public shortly.
If you would like to discuss PnF or need help setting up the scales, please msg me.
Enjoy.
Devouring Netflix with Point&Figure analysis. Market Top. SHORT.Netflix hit an all-time high, then corrected. It crept below the uptrend line but didn't generate a sell-signal below it. It passed back above the uptrend line but hit the resistance roof. Again, it just crept below the uptrend line but without a sell-signal, suggesting that the trendline is acting as support, albeit loose support. The price climbed above again but then broke the uptrend line and generated a Double-Bottom sell-signal.
Following the double-bottom sell, it fell by a further two boxes before being supported by the original uptrend line. It then rallied upwards but couldn't reach the second uptrend line which suggests this trendline now may switch to a resistance role. The price sunk below the original trendline for the first time and generated another double-bottom sell at the level of penetration, falling a further two boxes after the double-bottom signal box. It barely snuck above the original trendline before sinking down, albeit at a higher low. What followed was a strong rally which broke through the original trendline but was met with resistance from the most validated trendline.
After very brief congestion, the price rallied through the most validated trendline by 4 boxes. This questioned the resistance power of this trendline. Though it is thought this 4 box rally above was an attempt to reach the previous all-time high. A pole developed and sunk the price through this trendline and then the original trendline again, and created a triple-bottom sell. The next X column failed to come close the original trendline. A catapult then formed with a double-bottom after the triple-bottom. The next X column failed to touch the original trendline before another double-bottom sell-signal was generated. Two downtrend lines have now formed but the area of support is yet to be full broken.
My impression is that we are experiencing a market top and that a potential reversal is imminent.
Things to look out for:
- Will minor downtrend be penetrated?
- Will major downtrend line be penetrated?
- Will the area of support be penetrated?
For a short, anticipate:
- the second downtrend line to be validated
- the area of support to be penetrated
- a double-bottom sell-signal or better


