PolkaDot (DOT) Structure Analysis (1D)BITGET:DOTUSDT is showing signs of strength after a deviation below the long-standing $3.70–$4.10 demand zone.
Key Levels
• 🟢 Demand Zone: $3.70–$4.10, respected since October 2023
• 🟡 Broken downtrend resistance, retested as support
• ⚪ Current falling channel (compression) following range high retest
• 🟥 Sell Order Block: $5.10–$5.40
• 🟧 Range Resistance: $5.40
• 🎯 Target on breakout: ~$7.00, potential extension to ~$7.50
Thesis
• The recent breakdown was quickly reclaimed, hinting at a possible spring/fakeout. After retesting the range high, price is now compressing within a descending channel, building energy just above demand.
• A breakout from the channel followed by an S/R flip of the $4.40–$4.60 region could trigger a rally toward the upper range.
Watching for
• Channel breakout with volume
• Clean break above $5.40 to confirm range expansion
Invalidation
• Sustained break below the $3.70–$4.10 demand zone
Polka

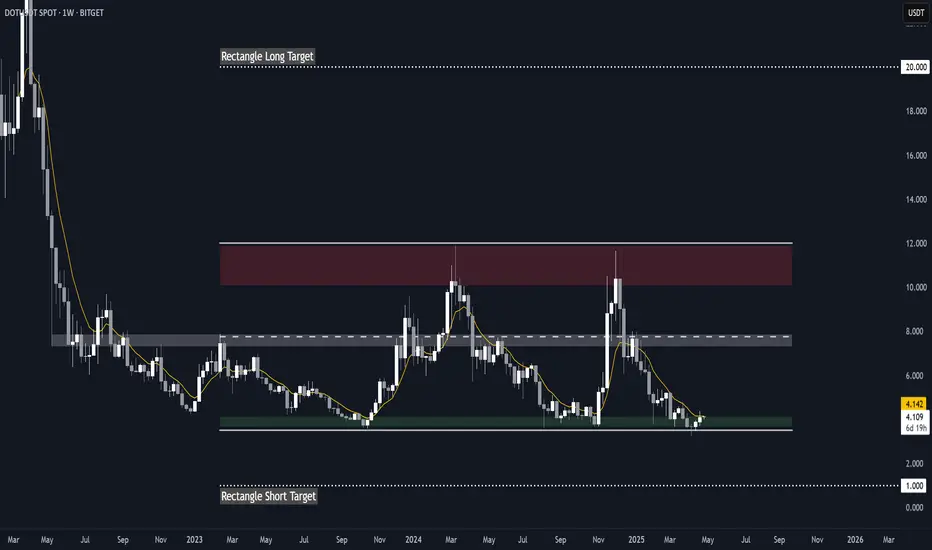
DOT RectangleBITGET:DOTUSDT has been trading in a rectangle since October 2023, with important key levels dating all the way back to May 2022. It also recently broke support, swept liquidity to $3.3 and reclaimed the demand zone, setting itself up for a potential rebound.
Key Levels to Watch
• $3.5-$4.0: Main demand zone
• ~$7.5: Rectangle midline + key S/R dating back to May 2022, could act as a strong resistance
• $10-$12: Main supply zone
Potential targets
Measured rectangle targets
• Breakout: $20
• Breakdown: $1.0
Other Considerations
Another laggard, similar to Filecoin ( ).
While it's still unclear whether these coins are rebounding or heading for a breakdown, they could offer some of the highest R/R potentials for longs, and they have very clear invalidations.
Triggers
• My long trigger for Polkadot would be a break above the 50-day EMA and the demand zone (~$4.0).
• Invalidation (and short trigger) would be a sustained break below $3.5 or a lower low below $3.3.
Polkadot (DOT) - Bearish Short TermPolkadot (DOT) has also fell below the 20-day EMA & 50-day EMA on April, 2nd. Previous support level for DOT has been broken at: $8.67. A daily candle is going to close bellow this support level and both EMA's which is extremely bearish short term. Due to this, bears could push the price action down towards to around $8.20 area.
However, If Polkadot bulls can hold the price and rebound off $8.20 by the end of this week. Bulls will create a rally to retest $9.74 target shown from the chart. A break above this, bulls will have more momentum and attempt to push the price further to $11.88.
Key Levels:
-New Support= $8.02
-Previous Broken Support Level= $8.67
-Target= $9.74
*Resistance= $11.88

We are on track with Polkadot
Update to our previous IDEA , Dot is playing out as we expected. Looking forward to see it hitting the 8.5 mark.

DOT strong supportDOT Polkadot has found a strong support at 17.50 from which we might see a reversal to the next resistance, 27usd.
Looking forward to read your opinion about it.

Polkadot wants to turn around$dot #polkadot HnS target listed but potential bounce off bottom of keltner channel with W reversal pattern in play if support holds.

PolkadotPolkadot its a good coin to buy and hold it for long term .Also its a fantastic coin for your trade.

POLKADOT ROCKET LAUNCHEDLet's go even higher. This insane ride will continue with a good amount of buyers VOLUME. So check it. Target zone is really strong so it is better reduce your long positions around that level.

DOT POLKADOT EXPECTED MOVES - DOTBTC DOTUSDC DOTUSDT POLKA DOTDOT POLKADOT EXPECTED MOVES - DOTBTC DOTUSDC DOTUSDT POLKA DOT


PolkaDOT fighting for life! This is my honest take on PolkaDOT. That bitcoin drop was harsh and sudden no doubt about it, but with every crash comes an opportunity. It's unclear what will happen in the next day or so, but here are some potential trade set-ups that can be made.
For a long position, I would like to see a close on the 4H chart above the .618 Fibonacci extension line. It has some slight resistance and would also show a reversal into a short-term bull trend. From there we could expect it to make it back to where it was consolidating before the crash.
For a short position, It's getting close to breaking through the previous support after that flash crash. From there I could assume that it will climb downwards to test the next support level. But... after that, if that breaks. It won't be pretty. All the gains from March and April would be erased and I would then predict a bear trend for Dot.
While the project has a lot of hype and overall I expect the bull trend to continue it all mainly depends on one large factor. BITCOIN. Only time will tell.
NOTE: This is not financial advice. Enter your own trades at your own risk with a plan!

DBC tweezer bottom weekly chartThe chart is still intact and i've spotted a weekly tweezer bottom which is very bullish in my eyes.
A 3x from here is still easily possible.
Like share, and buy this hidden GEM before you miss out.
Peace

DOT is getting ready to rock! Idea for DOT long term HODLers :DDOT is showing great bullish pattern. Support is very strong at around $32 and the upcoming Polka magic will do the rest of the work for us... We just have to break through that $40 resistance! HODL to 3 figure Polkadot in 2021!

As Polkadot broke all time high, $10 is next!As Polkadot broke all time high at $6.82 very significantly, the next stop where a major correction can be seen will be very likely at psychological resistance at $10 per Polkadot.
Technicals looks perfect as the price broke a new high.
See my fundamental analysis of DOT in the "related ideas".
Good luck with this Ethereum competitor,
Tibor

$POLS SAME PATTERN AGAIN AND AGAINHello traders,
I noticed this interesting pattern in $POLS, which is a great project, after every -20% next leg follows, currently I am expecting the same thing again.
Target is a great box, which is also about 50% up from here.

DOT insanityChurn your stomach for a couple of months then breakout of triangle and 2x in a couple of days. Completely missed this one it happened so fast. Target is $8.5

DOT potential cup and handleDOT broke through the midline of the channel and looks heading to the bottom of the channel. If it find support at the bottom of the channel that is very bullish and will result in a cup and handle pattern. However, if the channel is broken that is very bearish.

DOT.USDT (Y20.P5.E1).3 Reasons why its hardHi,
I would love to go long with DOT and UNI at this point, however each of them have their strong resistance.
It would be nice to see this break before BTC pulls back. The timing is important for we have a scenario where BTC hits its target and the Alts dump.
What's your thoughts on the ALTs?
Cheers,
S.SAri

Dot failed rallyor retest of descending channel ? Currently it found support and remains to be seen if it bounces.

Polkadot on his way backit's always very difficult to analyse new coins because more we can back in the past, more it's easy to find supports and resistances.
Dot is still performing a good come back as you can see by his multiple bounces on a forming uptrend Line. Like always the King is controling those coins by his dominance so you always have to check BTC before entering a trade and exit fast if a dip happens.
Simple Targets :
- TP1 4.80$ (38.2% retrace)
- TP2 5.50$ (61.8% retrace) - Strongest Resistance
Stop Loss : 3.90$
Happy Tr4Ding !

DOTUSD inverse head and shoulders completedtarget 5.22 . Might pullback to 4.1 if BTC pullbacks, but looking bullish.

DOT is dropping to complete next bullish setup for upto 190%The priceline of Polkadot (DOT) is completing the final leg of bullish BAT pattern, the targets as per the Fibonacci sequence of BAT are:
Potential reversal or buying zone: 0.00022208 to 0.00017438 btc
Fibonacci projection or sell zone: 0.00033582 to 0.00050650 btc
Regards,
Atif Akbar (moon333)

DOTUSDT completed Gartley | Upto 99% move expectedThe priceline of Polkadot (DOT) with USDT pair has formed bullish Gartley on the 2 day chart, the targets as per Fibonacci sequence of Gartley are:
Potential reversal or buying zone: $3.85 to $3.03 (this is stop loss as well)
Fibonacci projection or sell zone: $4.49 to $6.04
Regards,
Atif Akbar (moon333)
