Polkadot Targets For 2024-2025ETHEREUM CLASSIC COMPARISON
Ethereum Classic is a coin from around august 2016. It had its first bull run in 2017/2018. It had its second and most powerful bullrun in 2021, when it made an approximately 53x from its (double) bottom.
Coins that were "new" during one bull cycle often perform best in their second, more mature bull cycle. What can be observed with ETC, can also be observed with LTC, ADA, and plenty of other coins that had a first good bull cycle, but an even more impressive 2nd. After the 2nd cycle, the returns tend to diminish because of saturation, large amount of bagholders, and a larger marketcap.
POLKADOT
Polkadot is coincidentally a coin from around august 2020. It launched just in time to participate in the 2021 bull cycle. According to some, it under-performed compared to other cryptocurrencies.
As of July 2023, we can observe a double bottom pattern on the weekly BINANCE:DOTUSD chart, with the 50 weekly MA also flattening out, which is a positive sign for bulls as it shows a weakening bearish trend. Polkadot's BTC ( BINANCE:DOTBTC ) pair is also extremely oversold on the weekly chart.
PRICE TARGETS
Looking at COINBASE:ETCUSD , we can see that Ethereum Classic had a blow-off top to the 3.618 fib level in may 2021, reaching a price of over $165 dollars, or a 53x from its bear market lows.
If Polkadot were to perform similarly, it could potentially reach a price of $193, corresponding with its 3.618 FIB level. A 53x from its bottom would give us an approx. price of $220 per DOT sometime in 2024 or 2025.
PRELIMINARY TARGETS FOR DOT
Polkadot does not have extensive price history like bitcoin or ethereum classic. One of the most important indicators to watch is its 50 day weekly moving average, which currently sits at around $6.14. This price correlates with important horizontal S/R levels. If DOT manages to break past this level, which it currently is not far removed from, then we can expect a rapid appreciation of price. Targets to watch after breaching this level would be between $14 and $23.
WEN ATH?
I believe Polkadot's new ATH will coincide with that of the broader cryptocurrency markets. I believe Bitcoin will reach a new ATH between april 2024 and january 2025, so I expect DOT to reach a new USD-ATH within this same timeframe.
POLKADOT IS SAFU
Polkadot was one of few major PoS (Proof-of-Stake) cryptocurrencies not in the SEC's filings against Binance and Coinbase. This has to do with Polkadot/Web3 Foundation having successfully morphed Polkadot to become software, rather than a security. What sets Polkadot apart from other coins/projects such as ADA, Cosmos, etc. is that Polkadot was actually originally registered as a security. The teams behind the decentralized Polkadot project are doing everything according to US securities law. This could prove to be beneficial from Polkadot during the upcoming bull cycle.
POLKADOT IS THE MOST ACTIVELY DEVELOPED BLOCKCHAIN
Polkadot is one of the most actively developed blockchain, rivaling Ethereum and Cardano. Polkadot is an ecosystem and the people behind it are extremely talented and passionate and focus more on building rather than worrying about the token's price. Gavin Wood, the creator of Polkadot, is also one of the co-founders of Ethereum. The Web3 foundation is behind Polkadot – in fact, Polkadot is their flagship protocol.
Polkadot

The 4.605-5.408 section corresponds to the buy sectionHello?
Traders, welcome.
If you "Follow", you can always get new information quickly.
Please also click "Boost".
Have a good day.
-------------------------------------
(DOTUSDT chart)
The 4.605-5.408 section corresponds to the buy section.
Therefore, it is necessary to check whether it is supported and rises in the 4.605-5.408 section.
However, since the HA-Low indicator on the 1M chart is formed at the 6.640 point, it is recommended to take an aggressive buying approach.
1st: 6.280-6.640
2nd: 7.530-7.860
3rd: 9.262
Split selling is possible when there is resistance around the 1st - 3rd above.
-------------------------------------------------- -------------------------------------------
** All descriptions are for reference only and do not guarantee profit or loss in investment.
** Even if you know other people's know-how, it takes a considerable period of time to make it your own.
** This is a chart created with my know-how.
---------------------------------

DOT Rejection and ReboundDOT rejected and bounced back from its 4-hour 0 Fibonacci range at $5.24. The $4.8 range will be its support. The demand area is there.

Bullish Momentum and Important Resistance LevelsThe resistance range of $5.14 - $5.37 is being examined for DOT. If the price surpasses $5.37 level, it indicates a bullish signal, propelling it towards the resistance zone of $5.6-$6.00.
The supports are 4.70 and 4.37 levels.
The RSI level for DOT is currently at 68. The RSI is a momentum oscillator that measures the speed and change of price movements. A value of 68 suggests that DOT is experiencing relatively strong momentum and may be approaching overbought conditions. Traders and investors often consider RSI levels above 70 as an indication that an asset may be overbought and due for a potential price correction.

📉 Descending Broadening Wedge Spotted on $DOTHey traders! Today, I want to share an exciting chart pattern I've identified on MIL:DOT (Polkadot). Let's explore the descending broadening wedge and its implications for potential price action. 📊💡
Pattern: Descending Broadening Wedge 📉🔽
Symbol: MIL:DOT 💰
Overview:
A descending broadening wedge is a distinct chart pattern characterized by expanding price swings within converging trendlines. This pattern suggests increased volatility and the potential for a reversal. Let's dive into the descending broadening wedge pattern on MIL:DOT and assess its significance. ⚡💹
Key Features of the Descending Broadening Wedge on MIL:DOT :
Expanding Price Swings: Notice the widening price swings within the converging trendlines, creating the broadening pattern. This indicates growing volatility and potential market dynamics shift. 📈📉
Reversal Potential: Descending broadening wedges are often considered as reversal patterns, indicating a possible trend change. It's crucial to monitor price action for confirmation. 🚀📈
Trading Strategy:
Entry Point: Consider entering a position once MIL:DOT breaks out above the upper trendline of the descending broadening wedge. This breakout could signal a potential reversal and the beginning of an upward move. ⬆️💰
Stop-Loss: Implement a stop-loss order below the lower trendline to manage risk and protect against potential downside. ⛔️📉
Target Levels: Identify key resistance levels or previous swing highs as profit targets. Adjust your position size and take profits accordingly. 🎯📈
Risk Management:
Maintain proper risk management techniques, including position sizing, setting stop-loss orders, and adhering to your trading plan. Be aware of the risks associated with trading cryptocurrencies like $DOT. ⚠️💼💡
Disclaimer: Trading cryptocurrencies involves risks, and it's essential to conduct thorough analysis and seek professional advice before making any investment decisions.
#DescendingBroadeningWedge #DOT #Polkadot #Cryptocurrency #TrendReversal #TradingStrategy #TechnicalAnalysis #Volatility #RiskManagement
In conclusion, the descending broadening wedge pattern identified on MIL:DOT indicates a potential reversal in the making. However, it's crucial to wait for a confirmed breakout above the upper trendline before considering any trades. Stay tuned for further updates on $DOT! 💹🚀
(Note: This post is for informational purposes only and should not be considered as financial advice.) 💡💼📚

Polkadot going to $0,50? Polkadot dead?Polkadot is one of the worst performing altcoins.
On top of being a poor performer during the bullrun (compared to other coins), it is also the worst performer during the bear market.
It appears interest for polkadot has disappeared.
Polkadot has been in a downtrend for nearly 2 years. Downtrends tend to continue trending down until they continue up. There are no signs of a reversal. Based on the past history, it is possible polkadot will drop another 90% from its current valuation.
The chance of polkadot reaching its old all-time-high is, based on current situation, only 0.1%.

Bearish Trend Breaks Support, Await Signs of ReversalOver the past month, the price of DOT (Polkadot's currency) has faced considerable downward pressure, moving between the support level of $5.15 and the resistance level of $5.60. However, the price recently broke below the lower boundary of Polkadot's currency range channel, indicating a bearish trend. This selling pressure was so strong that it briefly dipped below the price floor of $4.23, which had been established at the end of 2022.
Interestingly, the price of Polkadot found significant monthly support within the range of $4.24 to $3.98 and responded positively to this support level. This suggests that there is a potential for a trend reversal and upward movement in price if we observe encouraging signs of a positive reaction and a change in the trend on the daily and four-hour time frames within this support range. These signs could indicate a reduction in selling pressure and a renewed demand for DOT.
However, at present, we do not see these favorable indications on the mentioned time frames. It may be necessary to wait for signs of a trend change in the short-term, particularly for lower time frame trades. For example, on the 15-minute time frame, if the resistance level between $4.53 and $4.57 is broken, it could serve as a signal for a short-term trend reversal. It is important to closely monitor how the market responds to this monthly support level, as a strong positive reaction could result in the price of Polkadot fluctuating within the range of $4 to $5 for a certain period of time.
Considering the current market conditions, it is crucial to remain cautious and wait for confirmation of a positive trend change before making any significant trading decisions. The RSI (Relative Strength Index) value of 34 on the 4-hour timeframe suggests that the market is in a slightly oversold condition, but further analysis and confirmation are necessary to determine the direction of the price movement.

DOTUSDTDOTUSDT was trading in range from sometime , and recently broke through the range and now testing the broken level. It also facing the pressure from declining trendline.
Will it head even lower ?

DOTUSD: Piercing Line at Shark PCZ with MACd Bullish DivergenceWe have a Piercing Line with Potential MACD Bullish DIvergence at the PCZ of a Bullish Shark on DOTUSD

DOT📊 #DOTUSDT
⏱ TIME: 1W
📝It is reaching very important areas for spot purchases, and you can make purchases in a gradual and managed manner. It has also been checked for fundamental analysis and is a sustainable and strong project for the future.
📍The initial buying limit: 4.4 $
📍The second buying limit: 3.8 $
📌TP1: 7.5 $
📌TP2: 10 $
📌TP3: 23 $
📌TP4: 54 $

POLKADOT - 1000% Move Coming!DOT has giving us an EASY trade setup.
The big wave 2 was an irregular FLAT correction, which consisted of an ABC wave (3-3-5 breakdown).
We are now in wave 3 and we've seen subwave 1 and currently in subwave 2. For confirmation of subwave 3, we can wait for the break of red trendline.
Trade Idea:
- Safe entry on break of red trendline
- Risk entry anywhere above invalidation level
- Stops below invalidation level
- Targets: 14, 24, 54, HODL the rest
Goodluck and as always, trade safe!

Polkadot - In accumulation phase - Best time to buyPolkadot is in a big accumulation phase. This is when you buy into the ticket and wait. Depending on asset it could take months to years. In this case I would consider years. Eventually it will break up above 12$ and the recovery phase will begin.
Right now polkadot is very undervalued due to whats being built on their chain.

✴️ Polkadot Set To GrowWe have a double bottom on the Polkadot (DOTUSDT) chart, a strong support level has been activated.
✔️ If this support level breaks, we can get something like Dec./Jan., support recovery.
✔️ If this support level holds, we can get straight up and hit a new high compared to February this year.
It doesn't matter which if shows up, Polkadot Is Set To Grow!
Namaste.

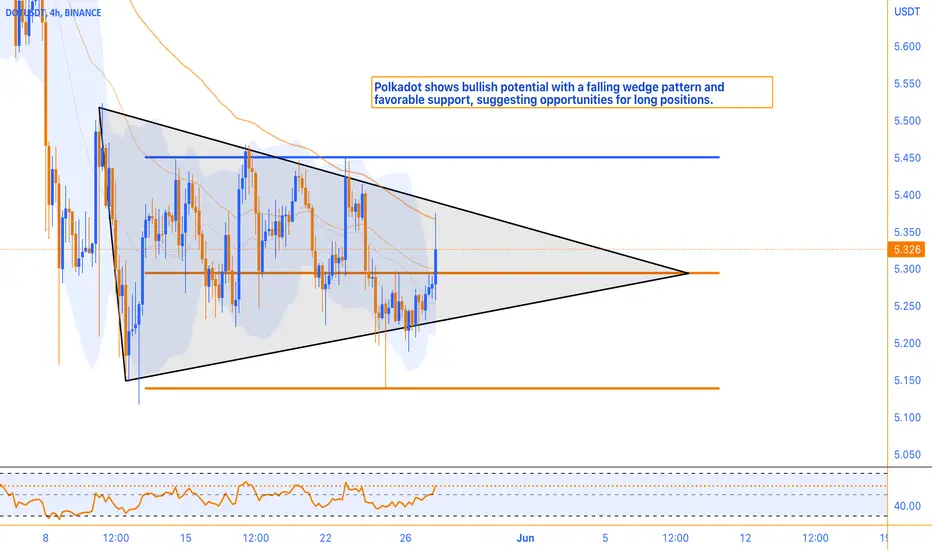
Falling Wedge Pattern, and Moderate Bullish MomentumPolkadot is currently being traded within a significant support zone, presenting a favorable trading opportunity. On smaller timeframes, a falling wedge pattern has emerged, indicating the potential for an imminent breakout from this triangular formation. Moreover, the Relative Strength Index (RSI) is currently at the 58 level, suggesting moderate bullish momentum in the stock. This implies that buying pressure is stronger than selling pressure, yet it has not reached an overbought condition. With these factors in mind, traders can consider building a long position at the support level while implementing proper risk management techniques. This analysis indicates a potential upward movement in DOT's price in the near future.
DOT short testing Alpha PhantomHello friends, I'm testing my first phantom indicator, be patient, hopefully it will work well and by itself, it's on a 15min timeframe, so I'll be surprised, I'm not dealing with SL for now, I'll do it with pyramiding and moderate leverage with a low deposit.

DOT: analysis for buying bagsMy impression is that DOT will move further toward my 1st target although eventually it just follows BTC and when I say follows I mean literally mimic it with a magnified movement. This means that despite DOT showing signs of bearishness if BTC starts pumping it will pump along.
On D1 I see many wicks on the bottom of the candles which means sells were absorbed but at the same time means that SL were triggered and people must have placed many orders below those wicks, orders which looks tasty to liquidity hunters.
On weekly the impression is we'll have a "darth maul" candles thich is sign of indecision (due to BTC ranging) but to which very often follows a continuation.
Here the chart:
I personally would love DOT below 5 USDT but this will happen only if BTC allows it. If all of a sudden we see a candlestick over 5.63 with enough volume this bearish scenario is invalidated.
This TA is just for long time frame investment, can give ideas for short terms trade but I think it's more useful in case you plan to buy since we're close to the bottom UNLESS I'm wrong and the bottom is in.
Good luck

Is Polkadot better than Ethereum? hello dearc trader
Is Polkadot better than Ethereum?
Ethereum requires many validators per shard to provide strong validity guarantees while Polkadot can provide stronger guarantees with fewer validators per shard
you can buy in this area for mid and longterm ...
However, the Trading Beasts believe that it will stick to around $44 by the end of 2023

🔥DOT IS AT STRONG SUPPORT: 2 TARGETS AFTER THE KEY LEVEL TEST🔥Hi, friends! DOT reach the strong support level and already make a false breakout which shows the price strength.
📊 TRADING PLAN FOR DOT:
1. the false breakout of the key level(already happened)
2. volume growth at the bottom
3. bullish BTC is a must-have for altcoins growth
✅ THE MAIN TARGETS FOR DOT:
🔥 $6.2-6.4 - the value area and strong resistance
🔥 $7 - the key level
💻Friends, press the "boost"🚀 button, write comments, and share with your friends - it will be the best THANK YOU.
P.S. Personally, I open an entry if the price shows it according to my strategy.
Always do your analysis before making a trade.

Polkadot DOT. Maybe it's time to start growing, or not?)Dot's price was in the "group of leaders" that were the first to break out of the prolonged downward trend.
However, "the winner music didn't last long", after a 2-month rise in the DOTUSDT price with a result of +90%, consolidation has been going on for the 3rd month.
Roughly speaking, there is nowhere to fall below the price of the Polkadot token. The critical level from below is $4.83.
If we model Elliot waves on the current trading situation on the DOTUSD chart, we can assume that wave (2) is close to completion.
The next wave is an upward wave (3), with the most conservative targets for its growth ranging from $10-10.50 to $12.30.
_____________________
Did you like our analysis? Leave a comment, like, and follow to get more

Peaks and ValleysThe value of Polkadat has exhibited a consistent decline over the course of the past month. Notably, the currency experienced a significant decrease of 26% in its price, responding unfavorably to resistance encountered at the precise level of $7. Subsequently, the previously established price floor of this currency was temporarily breached within the $5.15 range, followed by a positive recovery within said range.
A promising long-term scenario emerges if the resistance levels of $5.62 and $5.80 are successfully surpassed, indicating a potentially bullish trend within the 4-hour time frame for this currency. In such an event, buyers may set their targets within the price range of $6, $6.30, $7, and $8 to $8.40.
Currently, there is an observed corner pattern occurring between the upper limit of the medium-term descending channel and the descending trend line. Thus, breaking through these resistance levels would confirm the pattern.
Considering the short term, it is worth noting that a former robust support has now transformed into a formidable resistance, while a lower support range remains strong. Consequently, there exists the possibility of a range-bound trend.

LINK, FIL, SOL , DOT and QNT entries and targets for best RRR Some possible targets and entries for better RRR . We may have more than 10x in some coins

POLKADOT: Classic Accumulation, Rally Phase NextBINANCE:DOTUSDT
Hi Traders, Investors and Speculators of the Charts 📈📉
Ev here. Been trading crypto since 2017 and later got into stocks. I have 3 board exams on financial markets and studied economics from a top tier university for a year.
In today's analysis, POLKADOT presents a great buying opportunity with a low risk and high reward setup. Currently trading in accumulation phase of the Wyckoff Method market cycle phases, you may still get another chance to buy lower BUT expect the price to continue trading in the accumulation zone ranges (within the support zone and resistance one pointed out in the green box) . The timeframe of six months is significant because most market cycles / phases start to show signs of change after 6 months of a specific trend being observed as in this case, a bearish trend was observed for about 6 months.
After successfully confirming a bottom on both the chart as well as on the Technical Indicator, flashing an oversold with the built in RSI, it seems that the most logical next phase is the upwards phase, however you might need some patience as to "when" this rally will happen.
_______________________
📢Follow us here on TradingView for daily updates and trade ideas on crypto , stocks and commodities 💎Hit like & Follow 👍
We thank you for your support !
CryptoCheck

Dot Looking Good For decent recovery Has Already Bottomed Out Falling wedge breakout Has Already Done Retesting In Process Incase Of Successful Retest Expecting Decent Recovery Expecting 240 to 270% Bullish Move
