Polkadot
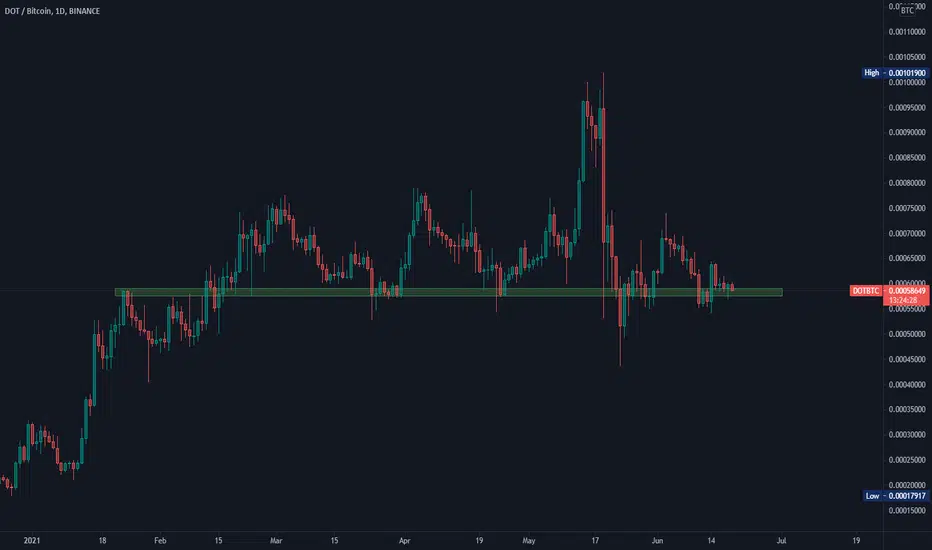
Trading Idea 022: PolkadotMarket Conditions:
- trend reversal situation
- consolidation around the resistance
- bullish sentiment in the market
Key Level and Lines:
- $6.50 resistance
- downtrend line
Trading Ideas:
- go long after consolidation below the resistance if the price moves above it
- go short if the price bounces from the resistance supported by bearish sentiment.

DOTUSDT - Ending diagonalNice run up.
Bearish divergence on H4.
Now for a possible ending diagonal. Last Wave E with target of $3.60.
Good luck!

Polkadot DOT price growth is still aheadIt is very likely that the DOTUSDT price is currently in the process of forming a global reversal trend pattern - "Inverted Head and Shoulders"
Of course, the final confirmation of the pattern's formation will come after the DOT price is firmly established above $10, and buyers will need to make a lot of effort to achieve this.
Looking at the chart, we can say that the rebound of the DOTUSD price from the bottom can be called quite weak compared to other altcoins.
Buyers of Polkadot token have not broken "shorts stops" yet, which are most likely hiding above levels $7.20 and $8.20, which are the first targets for growth.
Once this target will reach - when the shorts' stops are broken - a price correction may begin.
The medium-term target for DOT price is growth to $10+.
Long-term target - growth in the range of $19-23.5
_____________________
Did you like our analysis? Leave a comment, like, and follow to get more

Price growth could continue to the $9.680 rangeGiven that the potential for an intraday trend reversal has emerged for DOT, if buyers can keep the price above $6.523, price growth could continue into the $9.680 range in the medium term. If the resistance of the ceiling of the descending channel is completely broken, it will be possible to reach the target of $9.680. Of course, pullbacks should not be ignored, and a return to the lows in the $5.102 - $5.374 range is possible. The last point is that if the previous ceiling at $6.523 is broken before the pullback, we can consider the $6.523 support as a safe zone for a pullback.

DOTUSDT | DECRYPTERS |POLKADOT Hi people welcome to Team Decrypters
We are buying DOT in spot for MID - Short term and Allocating 2% of portfolio
#Decrypters #dot #dotusdt #usdt #polkadot
Reasons :-
--A trendline breakout is a situation in which the price of an asset moves outside of a previously established trendline. This can signal a potential change in the direction of the trend and can be used as a buy or sell signal by traders
--Volume Profile is a charting technique that uses historical volume data to display the distribution of trading activity at different price levels., Traders use this information to identify areas of support and resistance, as well as to identify potential trading opportunities

💥☃️🌲Polkadot Analyze (Road Map)!!!🗺️💥☃️🌲(+200%😱)❗️❓Today, I showed you the Polkadot road map🗺️.
Polkadot is running near the heavy support zone.
I expect Polkadot will go down a little more and then start to rise to a heavy resistance zone( about +200%)😱.
🔆Suggestion: If you want to add DOT to your portfolio, you can wait to break the downtrend line and SMA 100(Daily TF).
Polkadot Analyze ( DOTUSDT ) Timeframe Weekly⏰ (Log Scale).
Do not forget to put Stop loss for your positions (For every position you want to open).
Please follow your strategy, this is just my idea, and I will be glad to see your ideas in this post.
Please do not forget the ✅' like '✅ button 🙏😊 & Share it with your friends; thanks, and Trade safe.

DOT/USDT Breaking LTB After Reaction at POCBINANCE:DOTUSDTPERP
DOT is breaking the long-term LTB after suffering a price reaction in the POC of a session between August and December 2020, see that this zone remained reactive for prices.
But now it's easy to think like that since it already happened, however, here I'm going to leave a study done on May 11, 2022 where the 4.39 range was already plotted on my screen, waiting for a price reaction.
These plotted regions were reactive, some more, some less, but if you see the price reaching a certain region and consider it important, you can operate more objectively.
See how the price arriving in an area where it is interested in being traded works
Let's dissect this movement, the numbers are clear possible trades in my view.
See that on possible entry 1 it was a falling knife buy, few traders have the stomach for limit buys against the move, but the price level showed strong supply absorption and paid a great risk return.
Next we have the possible entry, number 2, see that this is already a clearer and calmer entry for many operators, either by buying limited below the last minimum, with the reading of 3 consecutive breakout failures or the purchase with a stop order at signal bar breakout with projected movement objective.
If the operator was unsure with entry number 2, he would have confirmation a few bars ahead, with an opportunity for entry number 3, with a slightly higher price and even so with a potential risk, favorable return, see that this is the entry of the late ones, it sometimes does not occur.
And finally entry number 4, which can also be a position increase, this operation 4 would be the purchase of a pullback in the price RANGE in which the buying demand managed to absorb the offer, and consequently the demand should take the market to at least a test in extreme zones where the greatest supply of assets will be found.
So the point here is, mark your charts here on TradingView in order to find the best zones where the price should show strength, be it buying or selling and trade in favor of the price reaction.
At the moment DOT/USDT is working in an area that is not very favorable for purchases, but these are the levels that I am looking to trade
Daily and 4 hours - 5.29 / 5.10 / 4.68
For those who like Fibonacci, the 5.29 and 5.00 range is also important and is confluent with the reference ranges plotted in the study.
This idea intends to find relevant zones for Pullbacks in DOT/USDT in search of a purchase for a new high Swing, if these zones do not show a reaction, it is possible that the balance of forces returns in the market and the context becomes more lateral.
🚨Disclaimer: The comments above reflect solely and exclusively my opinion, this is not a recommendation to buy or sell. Just a series of published studies, so that with the community we can discuss tactics and operational techniques.

MARSH $1.10 | Your First 10x++ come 2022 Low Cost High Reward
with the Three Kings in the SPACE #eth #bnb #dot
for a seamless flawless flow of data forever
Cap: $8M
Float: 7m coins
Daily Turn: $3M
Catalyst: UVM Unusual Value Turn
Validation: $1.31 syndicate Breakout
Strategy: Position Size
==


POLKADOT : Approach to important support area in medium termPOLKADOT : Approach to important support area in medium term
Crypto Analysis
Please, support our idea with Comment & Like 💖💖💖

$DOT broke LONG TERM down trendDon't care for $DOT but you can't ignore this
RSI could be better but this looks GOOD
#PolkaDot

Dotusdt Finally Falling Wedge Breakout Confirmed Expecting 120 to 140% Bulish Move
Entry Can Be Taken Now Between 4.90 to 5.10
Safe Stoploss Would be 4.30 You Can Set Target According Your risk To Reward ratio

Polkadot key levels, support and resistance levelsThe primary trend is short. DOT has reached the resistance zone. We are waiting for the secondary trend to break.
Key levels
Supports levels:
4.300
3.800
Resistance levels:
4.700
5.100
5.700

Polkadat ROAD MAPI think we are in a big diametric that we are about to complete wave e. From the announcement zone to the announcement range we can go up and complete wave D

✴️ Polkadot | The Beauty of TradingHere what's great about trading cryptocurrencies.
The beauty of trading in general... Endless opportunities.
If you miss one pair, one asset, crypto or stock... There is always another one and another one and another one.
It doesn't matter if you like to be LONG or SHORT, the market will provide opportunities always, in all timeframes you just have to do your job.
That's why my focus is 100% on studying and personal growth.
In order to be able to grow money, to make money "fast", I have to be able to make it slow and since opportunities are endless, I can take my time in preparation because when I am ready, the market will still be there waiting... Without the right preparation we make mistakes and these mistake will lead us to lose money instead of earn.
There can never be a hurry... If by any chance you have to hurry, you are desperate, you can take this as the strongest signal that you have to wait and can't trade.
I use this all the time.
If I want to do something and I get excited about it, that's the signal that I am not ready I need more time before I get this done.
It applies to trading... If you have to "run", "do it fast"... Then you might want to sit it out and see what happens... If you miss an opportunity no problem, endless opportunities are available within the financial markets and honestly all throughout this world.
Here is Polkadot (DOTUSDT), just today the downtrend is broken, which opens the door for additional growth.
So, if you missed one pair, here is another one.
Once we start looking at the smaller altcoins, pretty soon, we will find more and more and more and more...
If you feel you missed anything do not fret about it.
You can come right here to this very platform and visit my profile, you will find so many opportunities it will be hard to pick one.
We had plenty of time to prepare... But it is never too late to get started, whatever happened just adapt and change.
Namaste.

DOTUSD Broke above the 2 year Falling Wedge!Polkadot (DOTUSD) just broke above the Falling Wedge pattern that was in effect since early 2021. This 2-year pattern has been basically dictating the pace of the current Bear Cycle but as you see on this 1W chart, it eventually ran out of room, was trading tightly within its top (Lower Highs trend-line) and bottom (Lower Lows trend-line) in the past 2 months and eventually broke to the upside.
This alone is a major bullish development but we would like to see a closing above the 1D MA200 (orange trend-line) in order to confirm the end of the Bear Cycle. If broken, it will be the first time the price is above the 1D MA200 in more than a year (since January 05 2022). In that case, the Fibonacci retracement levels can be targeted in succession, with the 0.5 (Fib) at 15.50 estimated to get reached by August 2023.
A strong sign that shows that the market has priced its bottom is the 1W RSI, which has been flat on its Support since June 2022 and also broke above the Lower Highs trend-line that started all the way back to the February 2021 High.
-------------------------------------------------------------------------------
** Please LIKE 👍, FOLLOW ✅, SHARE 🙌 and COMMENT ✍ if you enjoy this idea! Also share your ideas and charts in the comments section below! **
-------------------------------------------------------------------------------
💸💸💸💸💸💸
👇 👇 👇 👇 👇 👇

Polkadot: Lucky Day! 🍀The date may write Friday the 13th, but we're feeling pretty lucky. Polkadot continues to rise and should climb above the resistance line at $5.36 to finish the yellow wave i. After completion, the coin should fall into a correction and end the orange wave ii below the $5.36-mark.

Polkadot Black Friday- Everything is in graph.
- Weekly predominant bullish divergence on RSI.
----------------------------------------------------------------------
- i won't speak "Price to Buy", but WHEN to buy :
----------------------------------------------------------------------
- Buy a Dip and wait for the end of this triangle.
or
- Buy a Breakout from the same triangle.
----------------------------------------------------------------------
- Black Friday is Real.
Happy Tr4Ding !

Polkadot (DOT) formed Gartley | A good buy opportunityHi dear friends, hope you are well and welcome to the new trade setup of Polkadot (DOT) with Bitcoin pair.
On a 4-hr time frame, DOT has formed a bullish Gartley move.
Note: Above idea is for educational purpose only. It is advised to diversify and strictly follow the stop loss, and don't get stuck with trade

An 3W swing trade scenario w/ FibonacciHi traders. I'm bringing in this weekly chart a simple draw of a smart money strategy based on the price action with Fibonacci Retracement 14.6% key level as a worth and effective take profit. I'm using a Ehler's smoothed stochastic to show a logical possible reversal wave to come in the 3W term.

DOT Zones: Falling Wedge Breakout Incoming? Here we are looking at DOTUSD on the Daily TF…
For this analysis, we will keep it brief as the chart here is very simple.
As you can see we are in a falling wedge which consists of downwards sloping resistance and a descending line of support. The descending line of support stretches all the way to the lows (at the time) made back in July of 2021. Every time DOT has tested this line, it has bounced (so far), but we will continue to monitor the charts as the space between support and resistance continue to squeeze closer.
What do you think DOTUSD will do next? Let me know in the comments!
Cheers!

PolkaDot | Heating up for Massive BREAKOUT..!!
#DOT is heating up for Massive Breakout 🔥
Forming Falling Wedge in Weekly timeframe Chart.
Seems like Bottomed out but not out of Woods yet.
Bulls need to Close the Weekly Candle above 4.90 to Confirm the Wedge Upside Breakout.
Looks Promising for Q1 2023, +300-380% Profit Potential in the Midterm.. ✍️
Please like the idea for Support & Subscribe for More ideas like this and share your ideas and charts in Comments Section..!!
Thanks for Your Love & Support..!!
