DOT hitting my targetI had this 2 targets for accumulating DOT and as you can see the first one has been hit, however if you check BTC I really don't think this dumping is over (here the weekly chart: ). At this point I'm not gonna buy because I expect my second target to get hit (3.68 $USDT).
This is not the bottom but we're close... let's see if I'm right!
Good luck
Polkadot

🟪 #DOT/USDT - Short Scalp Opportunity🟪 #DOT/USDT - Short Scalp Opportunity
• 🐻 Strategy: Short
• 👉 Exchange: Bybit
• 👉 Entry mode: Market order in range
• 🚫 Stop: 5.29 (-34.2%)
• 💰 Entry: 5.115 ⌁ 5.166
• ⎿ Current market price: 5.105
• ⎿ Target 1 : 5.06 10.8%
• ⎿ Target 2 : 5.009 20.7%
• ⎿ Target 3 : 4.96 30.3%
• ⎿ Target 4 : 4.906 40.9%
• ⎿ Target 5 : 4.856 50.6%

DOTUSDT Daily TF: 11/12/2022You can see all the impartant zone on the chart.
💡Wait for update!
🗓️07/12/2022
🔎 DYOR
💌It is my honor to share your comments with me💌

The price is still sitting on an important support level!DOT has been trending down over the past week. The price is still sitting on an important support level in the range of $5.20-$5.25, and there is no sign of positive reaction and price growth from this level. Last week, an uptrend line was broken to the bottom, signaled by the RSI indicator's negative divergence. Only the specified support level is considered the last valid short-term support for the short term.
If the selling pressure increases on Polkadot, by breaking this support, the price can continue down to the $4.50-$3.60 range, and the bottom of the descending channel can be fake broken. As soon as the price hits the indicated monthly support, we can expect a strong positive reaction. Considering that the price of the Polkadot currency has reached good support levels, there is a possibility that some market whales will take action to activate the loss limit of buying transactions and fake breaks. For a less risky situation, you should wait until the break of the new downward trend line and the confirmation of the downward angle pattern.

🔥🚩DOT WILL MAKE IT AFTER THE FALSE BREAKOUT❗🔥 Hi friends! DOT is making a pullback after the false breakout of $5.7 key level. All these movement is highly expected, because BTC also make a false breakout of the local highs and fall from $17 000 to $16 600 today.
✅ Remember that 99% of all the altcoins follow BTC!
📊 Now I have the next trading plan for DOT:
🔥 false breakout of the current $5.22 key level
🔥 volume growth which confirm the pressence of the whales
🔥 bullish BTC is a must have for the altcoins grow
🚩 I think that after this local correction and the pullbacks, DOT have a strong chances to reach the next targets:
1. $5.7-5.9 - the closest value area which become the resistance
2. $6.2-6.5 - big value area, huge resistance for the price
3. $7.4 - the local highs and key level
Traders, remember to book the profit by parts. I recommend you to book at least 65-70% when the price reach the 2nd target.
💻Friends, press the "boost"🚀 button, write comments and share with your friends - it will be the best THANK YOU.
P.S. Personally, I open an entry if the price shows it according to my strategy.
Always do your analysis before making a trade.

#Polkadot Sellers in A Commanding Position, Will DOT break $5.8?Past Performance of Polkadot
The general trajectory of DOT is southwards. Despite attempts higher in the second half of November, bulls are yet to follow through, confirming the upside. Thus far, sellers are in a commanding position with the path of least resistance defined. Though prices are stable, even printing higher, participation levels are comparatively low, questioning the resilience and conviction of traders.
#Polkadot Technical Analysis
Polkadot traders appear hesitant. Of note, prices are still being shaped by the bearish engulfing bars of early November. As it is, DOT has support at around $5. There were higher highs in late November and early December. However, it appears bulls couldn't sustain the move higher. This means the immediate resistance and buy trigger is around $5.80, or last week's highs. For DOT buyers to take control, a move above this line could see the coin rise to retest $7.45—or November lows. All the same, price action favors sellers. Therefore, aggressive traders can unload the coin, targeting $5. Further losses could see DOT drop to $4.50.
What to Expect from #DOT?
The Polkadot ecosystem is growing, overly bullish for DOT, which is the network's utility coin. Price charts point to general weakness and the continuation of a trend of the past year. Gains above last week's highs could relieve traders angling to retest November highs or post better results in Q4 2022.
Resistance level to watch out for: $5.80
Support level to watch out for: $5
Disclaimer: Opinions expressed are not investment advice. Do your research.

Whether it can rise above 5.67 is the keyHello?
Traders, welcome.
If you "Follow", you can always get new information quickly.
Please also click "Boost".
Have a good day.
-------------------------------------
(DOTBTC 1W chart)
It must rise above 0.0003 911 to gain the power of rising.
----------------------------------------
(DOTUSDT 1M Chart)
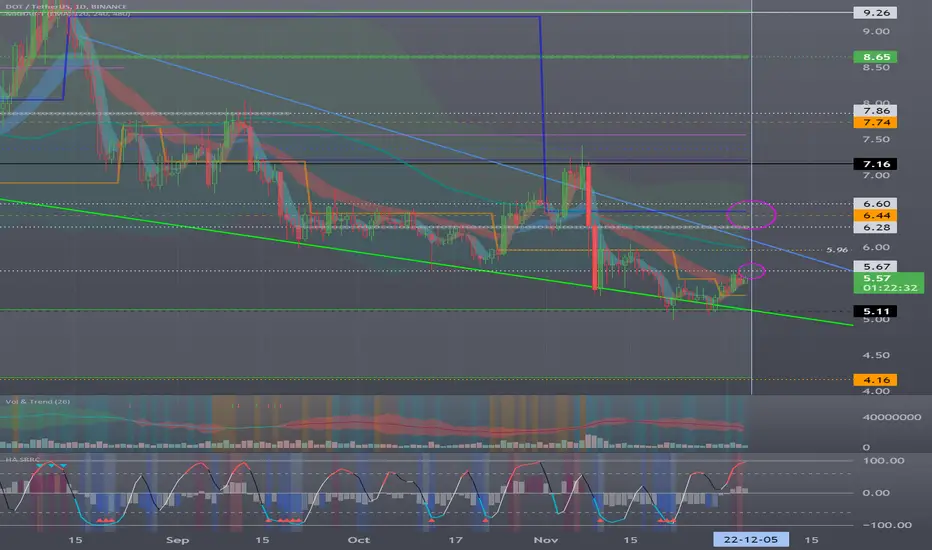
Whether it can rise above 7.16-9.26 is the key.
(1W chart)
The key is whether it can be supported and rise at 5.11 and rise above 7.16.
(1D chart)
The key is whether it rises above 5.67 between December 4-6 and receives support.
Since the volume profile section is formed in the 6.28-6.60 section, it is important to rise above this section.
If not, you need to make sure it is supported in section 4.16-5.11.
-------------------------------------------------- -------------------------------------------
** All descriptions are for reference only and do not guarantee profit or loss in investment.
** If you share this chart, you can use the indicators normally.
** The MRHAB-T indicator includes indicators that indicate points of support and resistance.
** HA SRRC indicators are displayed as StochRSI (line), RSI (columns), and CCI (bgcolor).
** The CCI indicator is displayed in the overbought section (CCI > +100) and oversold section (CCI < -100).
(Short-term Stop Loss can be said to be a point where profit or loss can be preserved or additional entry can be made by split trading. This is a short-term investment perspective.)
---------------------------------
DOT had good price growth over the past week!DOT had good price growth over the past week. Considering that the price had hit the bottom of the descending channel in the range of $5 in the high time frames, we saw the formation of a double bottom pattern and the return of the price above the range of $5.4. This pattern, which is clearly recognizable in the 4-hour time frame, has confirmed the break of this resistance pattern as the pattern's neckline was formed at the $5.4 range.
In the same period of time, we can expect further growth up to the short-term target range of $6 by considering an upward trend line on the last pivots and until this dynamic support is fully maintained. The trend is still bearish until the $6 resistance is broken. There is a possibility of a larger twin bottom pattern forming on the intraday, where the $5.10-$5.30 support level could be a good support area to retest demand.

DOT IDEAHello guys this is my trading idea about DOTUSDT .
LIKES AND FOLLOW for more ideas Thanks you .

DOTUSDTFormed Massive Falling Wedge On Daily Timeframe
Rsi Printed Massive Bulish Divergence
Macd Crossover
Price Action and Indicators Are Indicating Massive bulish
Always Wait Confirmed Breakout
Its Not Financial advice Do Your TRsearch Before Taking Any Action

Polkadot Starts Forming Bottom PatternWe will look at two more Altcoins that are starting to show early bottom/reversal signals, even if it is for just a relief rally.
First one is Polkadot (DOTUSDT), the other is The Sandbox (SANDUSDT).
Let's start with Polkadot.
We can see the rounded bottom in June/July before the upwards correction took place.
Now we are seeing a similar pattern with another bullish signal supporting it.
We have bullish divergence between DOTUSDT and the RSI.
A strong divergence started forming since August.
On the short-term side, we see prices trading above EMA10 and moving pass EMA21.
This happens while aiming at MA200 or $7.275 as potential target.
(A nice 30% potential growth).
We know that Polkadot moves together with Bitcoin... Almost all major Altcoins do.
So it is a positive signal when we see it go green as Bitcoin is correcting short-term.
Additional details on the chart (support & resistance levels).
Namaste.

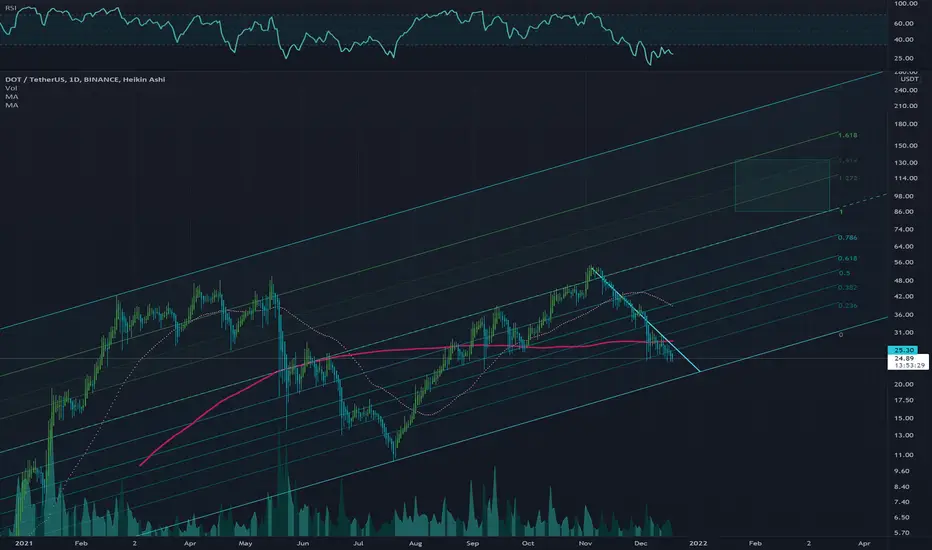
Completion of correction is coming soon!📣 Hello everyone! - I bring to your attention my global view of the DOT (Polkadot) coin exclusively from the point of view of TA, namely the Elliot Wave Theory.
⚠️ Everything is indicated on the chart, I wish you good luck in making your own considered trading decisions and profit ✊ Bye!

DOTUSD Log ChannelDOTUSD Log Channel Polkadot USD, log channel analysis with fib channels used for resistance/support and an analysis of the last downtrend.
Important minor support!DOT continued its downward trend during the last week. But by accurately hitting the bottom of its medium-term descending channel, the price increased just like the Cardano chart. But this increase in price has not shown high power from the buyer. Considering that the price is completely in a downward trend until the resistance of the $6 range becomes support, these reversals can be considered a corrective wave. But on the one hand, because a downward trend line within the channel has been broken upwards, and the last downward wave was a pullback to this trend line, if the short-term market conditions are maintained, the possibility of forming a double bottom pattern for There is a medium-term uptrend.
But its confirmation requires breaking the $6 resistance. Also, breaking the $6 resistance can make the 4-hour trend upward. At the time of writing this analysis, the biggest time frame in which the upward trend can be seen is the 1-hour time frame. As long as the minor support level of $5.25-$5.20 is not broken, this short-term uptrend can continue toward the $6 target.

Polkadot longPolkadot broke trough the descending trendline. Asset broke trough the resistance level. Bullish movement to resistance level at 5.77 is expected to happen.

DOTUSD Accumulation . 6 months+ - 1year+ HOLDDOTUSD Buy : 5.5$
DCA : 4.8$ , 3.8$
Hold 6months - 1.5 years
3xbuy signals

Polkadot (DOT) - November 23Hello?
Traders, welcome.
If you "Follow", you can always get new information quickly.
Please also click "Boost".
Have a good day.
-------------------------------------
(DOTBTC 1W chart)
The price needs to stay above 0.0003 517 to gain strength.
-------------------------------------
(DOTUSDT 1W Chart)
Whether it can rise above 11.72 is the key.
To do so, we need to see if we can keep the price above 7.16.
(1D chart)
It is a matter of getting support in the 4.16-5.11 section or higher and being able to rise to the 5.67-6.60 section.
In particular, we need to see if we can break out of the downtrend channel.
-------------------------------------------------- -------------------------------------------
** All descriptions are for reference only and do not guarantee profit or loss in investment.
** If you share this chart, you can use the indicators normally.
** The MRHAB-T indicator includes indicators that indicate points of support and resistance.
** HA SRRC indicators are displayed as StochRSI (line), RSI (columns), and CCI (bgcolor).
** The CCI indicator is displayed in the overbought section (CCI > +100) and oversold section (CCI < -100).
(Short-term Stop Loss can be said to be a point where profit or loss can be preserved or additional entry can be made by split trading. This is a short-term investment perspective.)
---------------------------------

DOTUSDT - SETUPDOT's Price slipped down and broke a short-term range. This opens doors towards 4.0$ but if we reach that area there will be a strong upside possible towards 5.30$ - 6.0$ and also 6.50 can be achieveable. So trade accordingly until a clear price action emerges.

polkadot Target 5.20$polkadot Trade in the middle of Wave C that Target level 5.20 .... Break Under 5.55 Confirm the C Wave .... Close above 5.80 Cancel this Idea

DOT: sit and waitThere's an high chance that DOT, which basically mimics BTC but with higher volatility, will go below 5 USDT and a fair chance that it'll go below 4 USDT.
I'm currently not buying to hold anything but if DOT goes to those prices I'm definitely buying some!

#Polkadot Slumps 90% from Peaks; DOT May drop below $5.3Past Performance of Polkadot
After soaring to as highs as $55 in November 2021, DOT is now 89 percent from all-time highs and wallowing against a wave of intense selling pressure. From the daily chart, bears are squarely in charge, and November 16 losses offer no reprieve for buyers. The immediate support lies at $5.3, while any gains above $6.3 may lift Polkadot back to November highs.
#Polkadot Technical Analysis
DOT prices are inside a bear flag, trending within the two defining bear bars of November 8 and 9. The failure of bulls to flow back, reverse losses of last week, and build on November 10 hints at weakness. Therefore, since prices are below $6.3, trending with low volumes, and inside a bear flag, sellers can double down, targeting $5.3 in the short term. This preview will only shift once DOT surges above $6.3, breaking above the bear flag. Then, the coin might fly to November highs at 7.3.
What to Expect from #DOT?
Like the rest of the market, Polkadot is under immense selling pressure. After shrinking roughly 90 percent from peaks, there could be more drawdown if immediate support at $5.3 doesn't hold.
Resistance level to watch out for: $6.3
Support level to watch out for: $5.3
Disclaimer: Opinions expressed are not investment advice. Do your research.

🔥HUGE falling wedge on DOT❗️The MAIN trading plan here🚀🔥Hi friends! Poldatot is most promises altcoin except ETH. The bridge between the blockhains is very usefull tool in crypto world, especially for the payment services.
Now DOT consolidate in the HUGE falling wedge and make LL and LH. It's not good, cause some of altcoin still make HH and HL, showing the strength. It can be related to the amoun of retail traders that entered DOT during the bull market and not sell most of their holdings.
🚩 At every low we can see EXTREMELY HUGE❗️ spike of volumes which shows how many coins retailers had. I think that the third DUMP is still possible. It will be related to the BTC dump to $12-13k. The $3-4 is a good key level for the long-term entry point.
✅ The local picture is the consolidation inside the range and breakout of the trendline with targets that I mention below.
📊 The main preconditions to open a long:
1. consolidation in the range with manipulation by the whales
2. squeeze to the trendline
3. bullish BTC
🚩 Just my recommendation is to use DOM and Footprint to identify the whales sell and buy orders. These tools will help you to increase the winrate by 25-35%.
✅ My 3 targets for DOT:
🔥 $6.05 - the key level
🔥 $7.3 - the key level and local high
🔥 $9.6 - the key level and local high
Traders, what do you think about DOT? Do it have a change to reach $30-40 on BTC rebound? Write your thoughts in the comments!
💻Friends, press the "boost"🚀 button, write comments and share with your friends - it will be the best THANK YOU.
P.S. Personally, I open an entry if the price shows it according to my strategy.
Always do your analysis before making a trade

DOT | What is in my Mind This is My Idea About Polkadot since 2022-2026
Dot Can be Rich to Minimum 210 $ in 2025
Also In My Mind Dot is Second ETH
But it is Better Than ETH
