DOT - Its Time Will Come!Hello TradingView Family / Fellow Traders. This is Richard, as known as theSignalyst.
DOT has been overall bearish for a while and it is now approaching a strong weekly support and round number 5.0 in green.
DOT is forming a channel in red but the upper trendline is not valid yet, so we are waiting for a new swing low to form around it to consider it our trigger swing.
For the bulls to take over from a long-term perspective, we need a break above the channel and last major high in gray.
Meanwhile, until the buy is activated, DOT would be overall bearish and can still trade lower inside the 5.0 support.
In this case, as price approaches the support again, we will be looking for short-term buy setups.
Always follow your trading plan regarding entry, risk management, and trade management.
Good luck!
All Strategies Are Good; If Managed Properly!
~Rich
Polkadot

CryptoMania- in 2018-2019-2020, Cryptos markets fluctuated bewteen 100 Billlions to 400 Billions.
- At the start of this BullRun, we got a push of 2000%! Rockected to 2.5 Trillions !
- Now and it's totally Logic that we retraced 50%ish and back to 1.20 Trillions, according to Elliot Wave, we just finished Wave 4 Retracement. Remember always that Cryptos are most fast than you, for the push and also for the dip !
- The Next push should propulse us to 3.5 Trillions Total Crypto Market ( +200% ish), 161.8 Fibo.
- This trend is theorical but clearly possible and very preservative, i had to made it to make peoples understand that we are just at the beginning of this fabulous Journey.
You are parts of the Web3.0 Story, Defi, Decentralisation, Swap money from your computer and so much more is coming.. could u imagine that 10 years ago ?
- With time the old banking system will be obsolet and die slowly.
Don't lose your faith in cryptos!
Long Cryptos, Short Banks !
Happy Tr4Ding !

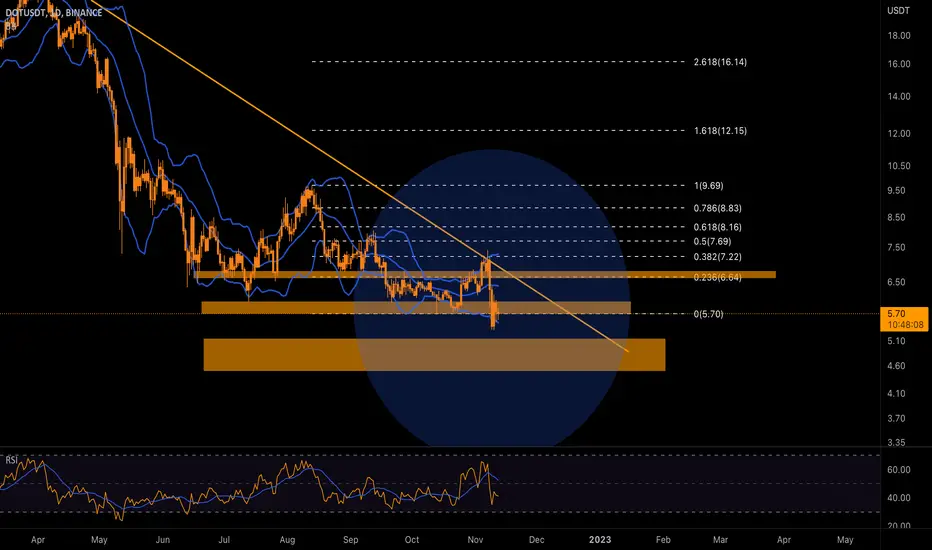
DOTUSD Can't stop this death spiral unless the 1D MA200 breaks.Polkadot (DOTUSD) has been trading within a Channel Down pattern since the November 08 2021 High. Our previous DOT analysis was on July 16, which hit its target with the help of that pattern:
In early November the price broke above it marginally but as it failed to cross the 1D MA200 (orange trend-line), the 1D RSI formed a top (red circle) and caused the price to drop. As you see, this pattern is consistent with both previous Lower Highs, a 1D RSI on these levels forms a top and causes the price to drop aggressively.
This 'Death spiral' can only stop with a break above the 1D MA200, which is the Resistance since January 05. Until then, we can expect DOT to make a new Lower Low either on the 0.786 Fib around 5.00 or even lower on the 0.618 Fib (4.50 - 4.00) before the end of the year.
-------------------------------------------------------------------------------
** Please LIKE 👍, SUBSCRIBE ✅, SHARE 🙌 and COMMENT ✍ if you enjoy this idea! Also share your ideas and charts in the comments section below! This is best way to keep it relevant, support me, keep the content here free and allow the idea to reach as many people as possible. **
-------------------------------------------------------------------------------
You may also TELL ME 🙋♀️🙋♂️ in the comments section which symbol you want me to analyze next and on which time-frame. The one with the most posts will be published tomorrow! 👏🎁
-------------------------------------------------------------------------------
👇 👇 👇 👇 👇 👇
💸💸💸💸💸💸
👇 👇 👇 👇 👇 👇

You have to wait until the price stabilizes on the levels!DOT had a sharp downtrend over the past week. The price of this currency registered a sharp decline after failing to stabilize above the resistance range of $6.6-6.8, and the selling pressure broke the support of the $5.7-6 range. This bearish trend could continue if Bitcoin breaks back below the $16,000 range, taking the price down to key support in the $4.5-$5.14 area.
Selling pressure and sellers' strength is still high, and this can be seen from the upper angle of the descending wave with the horizontal axis. To see the signs of reduction and removal of selling pressure, we can consider the positive divergence of the RSI indicator, the volume divergence, and a complete pullback to the downward trend line. With a higher probability in the channel range of $4, there is a possibility of a complete price reversal and trend change. Therefore, you should wait until the price stabilizes at the specified levels.
$DOTUSDT UPDATE!!!Hi Snipers,
Please refer to the recording for the next price levels and scenarios.
Thanks
MS

Polkadot DOT price has nowhere to fall below. It's time for longIt's been a while since we did a DOTUSDT idea, then it's time to refresh our thoughts.
As you can see from the chart, the DOT price is clearly moving from one liquidity level to another, we have marked them nicely on the chart.
So, we assume that the price of the Polkadot token will consolidate a little more, buyers will gain strength and break up from the falling channel.
Therefore, we make an assumption for ourselves about the possible movement of the DOTUSD price
Long to $6.60 - correction - long to $7.90 - correction - long to $9.50-10
_____________________
Did you like our analysis? Leave a comment, like, and follow to get more

Polkadot - I'm Interested..Polkadot is one I am eyeing closely for the next bullrun - with everything going on with Solana who knows what develops over the coming months/year.
I have my bids below if we get there, but clearly short-term resistances above and a key s/r level we're trading below as of now.
Daily candle closes in a couple hours and I think that will be telling of where it heads in the coming weeks.
Let me know your thoughts in the comments!
Cheers


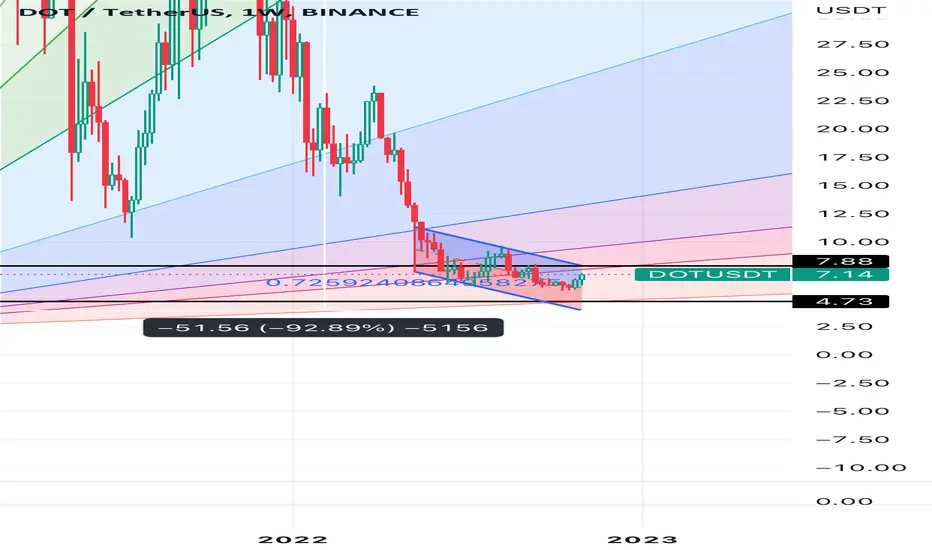
Dot update Ill take profit in my long position at 7.88$
I bought it at 5.8 $
Was good scalping for dot around 2 weeks
Then ill sell spot at 7.88 $
To 5-4.7 $
GOOD LUCK
#dotusdt Trade setup: Following a bearish breakout from Sideways Channel ($7.00-10.00), price reached June lows of $6 and bounced up. Now approaching $7 resistance. (set a price alert).
Trend: Neutral on Short- and Medium-Term basis and Downtrend on Long-Term basis.
Momentum is Bullish ( MACD Line is above MACD Signal Line and RSI is above 55).
OBV (On Balance Volume): is flat, indicating that volume on Up days is equal to volume on Down days. Hence, demand from buyers and supply from sellers are in equilibrium
Support and Resistance: Nearest Support Zone is $6. The nearest Resistance Zone is $7 (previous support), then $10.

POLKADOT UPDATE | DOTUSDWould be great to see a breakout above the falling wedge upper line with a retest to form inverse H&S
If that happens, could easily run 50% towards $9.3-9.5 area
Things take time.

Dot bearish trade 4HDot is in a support that now is a resistance so as we know if a lvl that before was a support or resistance is broke the next time that the que price goes to the lvl is the opposite ,that's the case of DOT the support works well but now isn't a support anymore so that means a long trade is absurd just for where is the price right now .

Polkadot - Market Structure Break!I got stopped out recently, but my bullish bias is still in play.
We have a bullish market structure break on the weekly with a retest of the bullish order block.

#Polkadot Bottoming up, DOT up 16% as Bulls Aim at $8Past Performance of Polkadot
Polkadot prices are down 30 percent from the August 2022 peaks, per the formation in the daily chart. Although the community expects DOT prices to recover after posting sharp double-digit losses from 2021 peaks, bears still have the upper hand. However, if DOT pierces above critical ceilings, the coin may surge to new Q4 2022 highs in a welcomed move.
#Polkadot Technical Analysis
Buyers are in control, and every low is an opportunity to accumulate. After sinking to register new 2022 lows in October, bottoming up from $5.74, the coin has since rallied 16 percent. At spot rates, there are bullish bars along the upper BB, pointing to solid upside momentum and support by traders. The spark is because of the wide-ranging bull bar of October 22 that pushed the coin above the resistance line, the middle BB, with expanding volumes. Even though the current coin's trade ranges are comparatively low to then, bulls have been resilient. Therefore, as long as DOT is above the middle BB and $6.28, the coin may race to September highs at around $8.
What to Expect from #DOT?
Buyers are bullish, and DOT is breaking out--a net positive. Prices are still within a bullish breakout formation as buyers press on. Since DOT is above the middle BB and $6.28 support, traders can target new Q4 2022 highs at $8 or better.
Resistance level to watch out for: $8
Support level to watch out for: $6.28
Disclaimer: Opinions expressed are not investment advice. Do your research.

Polkadot (DOT) - November 1Hello?
Welcome, traders.
By "following", you can always get new information quickly.
Please also click "Boost".
Have a good day.
-------------------------------------
(DOTUSDT 1W Chart)
It is important to be able to rise above the 11.72-14.93 section.
To do that, we need to see if we can sustain the price above 7.74.
(1D chart)
The key is whether it can be supported in the 6.28-6.60 section or higher.
If not, you need to make sure it is supported at 5.96 or higher.
If support is found above 6.60, it is expected to lead to an attempt to move above 7.16.
------------------------------------------------------------ -------------------------------------------
** All descriptions are for reference only and do not guarantee a profit or loss in investment.
** If you share this chart, you can use the indicators normally.
** The MRHAB-T indicator contains indicators that indicate support and resistance points.
** HA SRRC indicators are expressed as StochRSI(line), RSI(columns), CCI(bgcolor).
** CCI indicator is expressed as overbought range (CCI > +100) and oversold range (CCI < -100).
(Short-term Stop Loss can be said to be a point where profit and loss can be preserved or additional entry through split trading. It is a short-term investment perspective.)
---------------------------------

DOT | Ready for Massive Breakout..!!
#DOT Looks Promising here 🧐
- Forming Falling Wedge in 3-days TF Chart.
- RSI is Printing Bullish Divergence.
- Massive Buying Volume Coming in.
In Case of Wedge Upside Breakout, Expecting +300-360% Bullish Wave in Midterm.
Please like the idea for Support & Subscribe for More ideas like this and share your ideas and charts in Comments Section..!!
Thanks for Your Love & Support..!!

DOT is going to reach 4.9$ or 7.7$DOT is in a Descending Channel. The Price Right now is at the Top of the channel, which means The Price would Touch the Bottom of the channel. If that Happens,Price will reach around 4.9$. there is a little chance that a Bullish Break out Happens and the Price would reach 7.7$
-Dot is in a Descending Channel
-Price is at the top of the channel
-It will reach 4.9$ or Do a Break out to reach 7.7$ (Little Chance)
_ _ _ _ _ _ _ _ _ _ _ _ _ _ _ _ _ _ _ _ _ _ _ _ _ _ _ _ _ _ _ _ _
🌍Thank you for seeing idea .
Have a nice day and Good luck

no one is asking me but DOT is not in a good place dat and cardano both are in an important resistance in the case of dot beggin 6.45 to 6.90$ in this zone the long isn't a good idea the trigger for a possible short trade has to be search in 1h chart.

Mean Reversion Play for Summer 2022 Be careful700-750 target
it probably rallies some this summer, but don't get fooled into Diamond Handing the Mean reversion. it will rug you again in the late summer or fall
“The meeting of two personalities is like the contact of two chemical substances: if there is any reaction, both are transformed.” ...
“Everything that irritates us about others can lead us to an understanding of ourselves.” ...
“Your visions will become clear only when you can look into your own heart.

DOTUSDT Long Setup!DOTUSDT Technical analysis update
Buy zone : $6.15 - $6.27
Stop loss : $5.70
TP 1 : $6.70
TP 2 : $7.40
TP 3 : $8.00
TP 4 : $9.00
Always keep stop loss

PolkaDot - A Good Opportunity in Long term? Current trading values are similar to the ones in 2020 December when the coin was first launched.
I believe we will see Polka rising to its former Higher Highs before the end of this year.

Polkadot (DOT) - October 25Hello?
Welcome, traders.
By "following", you can always get new information quickly.
Please also click "Boost".
Have a good day.
-------------------------------------
(DOTUSDT 1W Chart)
Whether or not it can move higher than 7.16 is the key.
(1D chart)
In order to get out of the mid- to long-term investment area, it should rise more than 7.16-7.74.
To do this, it is necessary to check whether it can be supported in the 6.28-6.60 section or higher.
------------------------------------------------------------ -------------------------------------------
** All descriptions are for reference only and do not guarantee a profit or loss in investment.
** If you share this chart, you can use the indicators normally.
** The MRHAB-T indicator contains indicators that indicate support and resistance points.
** SR_R_C indicators are displayed as StochRSI(line), RSI(columns), CCI(bgcolor).
** CCI indicator is expressed as overbought range (CCI > +100) and oversold range (CCI < -100).
(Short-term Stop Loss can be said to be a point where profit and loss can be preserved or additional entry can be made through split trading. It is a short-term investment perspective.)
---------------------------------
