What do you think?Let's try
I have below the reference link, which is mine too.
I did it first on CMC and was like "Hey why not post it on TradingView while we're at it"
And here I am now :'D
Polkadot

short on DOT$DOT is facing a strong resistance area created by the descending trendline and the mirror level. Decline to local low at 9.3$ is possible.

Polkadot Sell Hello , we are in the resisment and we had good Engulfing bar candle with doji so open sell possession

DOT 4h shortSetup: Dot is bearish on both the 1 h and 4 h timeframe. It shows signs of constantly getting rejected by the POC which is confluent with the 50 EMA. Furthermore, it is currently ranging but the OBV is making a lower low, signifying a divergence.
Entry: 10.096
SL: Trail using the SAR( currently at 11.486 which is above the POC)
TP: 6

Polkadot (DOT) - May 18hello?
Traders, welcome.
By "following", you can always get new information quickly.
Please also click "Like".
Have a nice day.
-------------------------------------
(DOTUSDT 1W Chart)
The key is whether you can get support and rise in the volume profile section formed in the section 9.26-10.13.
In order to continue the upward trend in the medium to long term, it should rise above the 18.42-19.37 section.
(1D chart)
Since 9.26-10.13 is a mid- to long-term investment area, careful trading is required.
Therefore, it is important to see support by moving above 13.64.
However, since a volume profile section is also formed around 19.37, it is expected that the upward trend can be continued only when it rises above 19.37.
Therefore, below the 19.37 point, you need to conduct a transaction by purchase unit price to increase the number of coins you have in a transaction method that increases the number of coins for profit.
If possible, we recommend making a full-fledged investment in Jinhae after confirming the support at 19.37.
------------------------------------------------------------ -------------------------------------------
** All indicators are lagging indicators.
Therefore, it is important to be aware that the indicator will move accordingly as price and volume move.
However, for the sake of convenience, we are talking in reverse for the interpretation of the indicator.
** The MRHAB-T indicator used in the chart is an indicator of our channel that has not been released yet.
** The OBV indicator was re-created by applying a formula to the DepthHouse Trading indicator, an indicator disclosed by oh92. (Thanks for this.)
** Support or resistance is based on the closing price of the 1D chart.
** All descriptions are for reference only and do not guarantee a profit or loss in investment.
(Short-term Stop Loss can be said to be a point where profit and loss can be preserved or additional entry can be made through split trading. It is a short-term investment perspective.)
---------------------------------

POLKADOTDOT/USDT i saw 2 Strong Support Resistance if Broke first resistance we going to 2rd resistance but if dont broke first resistance i Will take SHORT position on this Coin Good luck

$DOT 3D Support Break + Adam and Eve Variation$DOT / Polkadot has broken a huge 3D support around 10.57, shown with the recent 3D candle's retest and failure, thus far. Big sell volume as well on the drop indicating it is likely a true move and not a fake.
I have not traded an Adam and Eve before, and this looks to be a variation of such, I think, don't quote me.
Levels are as follows, invalidated above 10.6 close.

short trem dot i think she made the pattern of the flag and it is inappropriate to enter after leaving in any direction


Polkadot: Taking a HeaderSplash! Polkadot has taken a header into our blue trading area, a shape we generally use to mark long-term entry opportunities in our chart analyses. As soon as the altcoin has finished wave ii in magenta there, we expect it to move upwards. Once it has climbed above the resistance at $22.50, Polkadot should have enough drive to make it above the next mark at $50.55 as well.

POLS/USDT -63% Down After our Exit point And $0.50 Target Hit#POLS/USDT Profit update:-
$POLS currently trading at $0.54 and went down till $0.0503
Our Target perfect hit.
-63% down from Our entry.
Hope you saved your money.
My Exit Point:- $1.50-$2.0
Now Trading:- $0.54
Now You can buy Small Fund not all.
2-3% of your Portfolio.
Please Like and Share and Send me Love ❤️❤️❤️
Thank you.

polkadot will go 12$so guys. look at this king of web3 currency...
pullback completed and it will go 10.5$-12.5$
R/R 1.4 not so good for my trading setup
so i don't use this position.
but i like to see what happen in 10-12 dollar that for buy this or not.
Follow for more Ideas❤️
Like 👍🏻 & Comment 💬

DOTEUR #polkadot - Next target is the lowest fibo level 0.618Next target is the lowest fibo level 0.618

POLKADOT - ROAD TO $200Good morning traders.
DOT/USDT the pair for today, lets begin.
In light of the recent Bitcoin dump, a lot of alts have found themselves at strong support, some below it and stables depegging from the dollar.
Question is, are we at the bottom now?
While i may not be able to clarify if we are at the bottom or not, it doesn't feel like it, I can however say this is a very good buying opportunity for many alts.
From the chart above we have the DOT price back at July 2021 levels, very strong support area. It could however make it's way down to our worst case scenario region which is also in line with the 1.236 fib support level dependng on Bitcoin's price action.
So far we have a Regular flat formed on the chart which in theory has it's C wave to be 61.8%-123.6% of wave AB.
Whether or not this is the bottom it is still a very good buying opportunity (but don't take my word for it).
If the Elliott wave theory is correct (and has been so far), targets for our wave 3 range from $175-$240 dollars(red zone) depending on where the bottom will be.
In the blue zone we have our Take profit region just to ensure we take some of the table in the case of exhaustion.
I expect this to fulfil over a lengthy timeframe given the state of the market but, you never know.
If you agree with this Idea pls like, share and comment your thoughts below.
As always feedback is appreciated!

SCENARIO 2 FOR A POLKADOT BOTTOMPls visit our last Polkadot analysis for better context.
As we know DOT was inside an ascending triangle pattern ( bullish ), however price has fallen out of that pattern for a much larger wave 2 correction.
Should price fail to close back inside the triangle and i think it wil fail due to bitcoin's vacation, we will have ourselves in play, a regular flat correction for wave 2, comprising of a large ABC correction with the C wave being a 5 way impulse move marking a 100% retracement of our Wave AB and aligns perfectly with the downward trend channel price seems to have created.
Make sure to apply proper risk management.
Goodluck

Polkadot Polkadot
Only one step left, Polkadot came to the edge of the abyss.
Polkadot, as part of a downward up-trend on D-1, has fallen to critical lows since early April and approached its historical key support at $12.00, breaking through which risks losing investment interest and, as a result, its liquidity and recovery potential in the short term. The level of $13.00 is not only the middle of the channel and intermediate local support for the downward dynamics, this level may well be a good start for a test of the channel trendline breakout, followed by an attempt to restore its liquidity as part of medium-term purchases. The support level of $12.00 is critical and in case of its breakdown, Polkadot risks updating the historical low of $10.00 per coin.


#btcstarburst Hope Can Still Exist…For a minute I was thinking and believe we are definitely going down… down!! However here still is a very real possibility, long shot maybe, but still… Let’s say there are so many people accumulating and buying the dips, this is why there is such a change in the market. At this level people are trying to accumulate as much as they can on many BTC and other projects… The crypto market as a whole seems to be slightly off. Bitcoin apparently should be at lower levels by now… Its not, DCA SAFELY Buy what you can when you can… We always could go lower this is a Gann study I would expect Bitcoin to play out in this form possibly hitting the green at 32k… Just a Model

DOT Bearish Gartlay still in play$DOT Bearish Gartlay still in play...
Next major support areas to hold are $12.54 & $10.37.

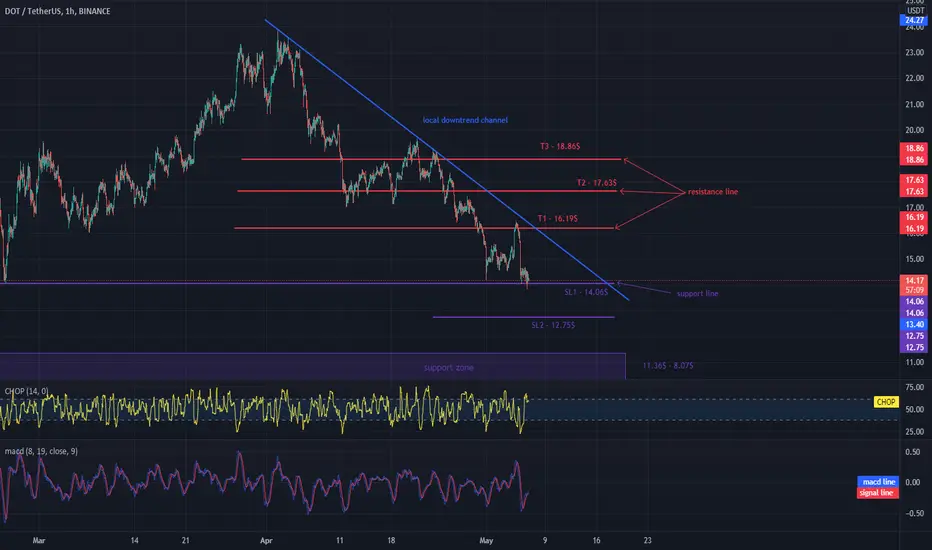
DOT on support, three price targets possibleHello everyone, let's take a look at the 1H DOT to USDT chart. As you can see, the price is moving below the local downtrend line.
Let's start with marking the support line and as you can see the first support in the near future is $ 14.06, here it is worth setting the first stop loss, if the support breaks, the next support is at $ 12.75, here it is worth setting the second stop loss. Next we have a support zone from $ 11.36 to $ 8.07
Now let's move from the resistance line as you can see the first resistance is $ 16.19, if you can break it the next resistance will be $ 17.63 and $ 18.86.
Looking at the CHOP indicator, we can see that in the 1H interval we have a lot of energy for new movement in the coming hours.
DOTUSD analysis Euphoria High and depressions low Full breakdown how i find my euphoria and Depressions

DOT - Going lower?⭐️ BTC bearish
⭐️ Level is seen on all timeframes
⭐️ Level is at round number
⭐️ 5th touch
⭐️ Level is 71 days old
⭐️ 40 ATR
⭐️ Under VWAP
Will enter when price squeezes to the level on lower timeframes, the base will form and the strip will get faster.
Fix profit by parts:
1% - 1/3
2% - 1/3, stoploss to breakeven
What's left, hold to the maximum
What do you think of this idea? What is your opinion? Share it in the comments📄🖌
If you like the idea, please give it a like. This is the best "Thank you!" for the author 😊
P.S. Always do your own analysis before a trade. Put a stop loss. Fix profit in parts. Withdraw profits in fiat and reward yourself and your loved ones

POLKADOT-Can a good news save an asset?Hello everyone
Due to the bad news from wallsreet and Nasdaq, a big red bar appeared on every chart, on daily of coarse.It's not the first time we had more than 10% fall in crypto market.
On daily chart of DOTUSDT, there's a double bottom pattern forming, which can take the price to our resistance level of 15.5$ and maybe break out of our bear trend line; As for our support, price levels of 14.5$ and 14$ are in place , plus a weekly trend line which held on good in the past couple of days.
We may get a doji bar for today,because of the news and fear, so just don't expect that much from the market today.
I will be glad to hear some feedback and questions.
