Polkadot in Bearish Setup, Target at 19.25Trend Analysis
The main view of this trade idea is on the 4-Hour Chart. The cryptocurrency Polkadot (DOT) has constructed a descending triangle setup since the beginning of December 2021. The support line is observed around the 25.50 price level while the resistance trend line is seen with lower highs at 31.50 and 30. Expectations are for DOT to break support and head towards 19.25. Failure of this would take DOT back above 30.30.
From a longer term view Polkadot has trended lower and is currently testing support. A break lower can take the cryptocurrency towards 10.
Technical Indicators
Currently Polkadot is below its short (50-MA), medium (100-MA) and long (200-MA) fractal moving averages. There has been negative crossovers on these MAs, which has set the downtrend for the cryptocurrency. The technical indicators have also shown bearish signs. The RSI is below 50 while the KST is in sell mode.
Recommendation
The recommendation will be to go short at market, with a stop loss at 30.30 and a target of 19.25. This produces a risk/reward ratio of 1.36.
Disclaimer
The views expressed are mine and do not represent the views of my employers and business partners. Persons acting on these recommendations are doing so at their own risk. These recommendations are not a solicitation to buy or to sell but are for purely discussion purposes. At the time of publishing I have exposure to DOT.
Polkadot

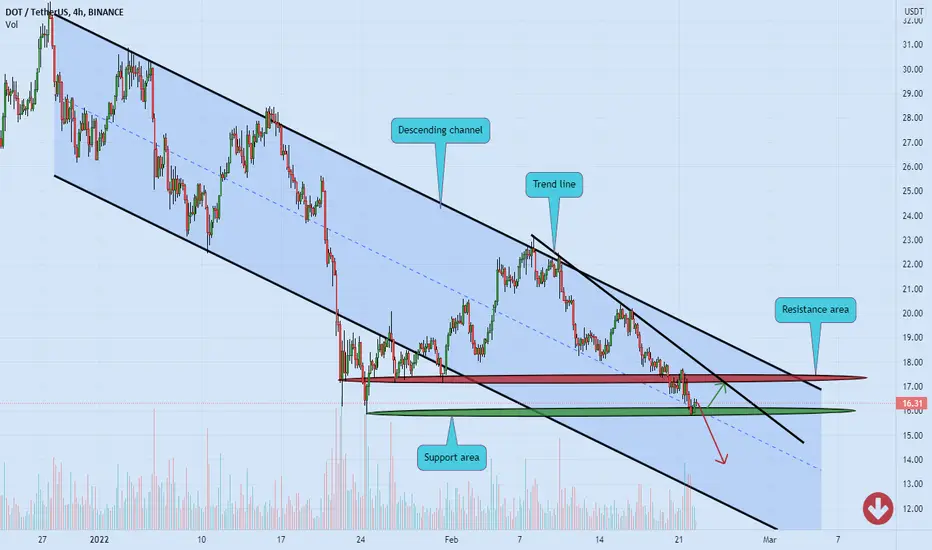
POLKADOT middle of the descending channel ❌🧨My previous analysis hit the target ✔️
and the price has started to dump from the resistance area 💣🐳💣
and now the price is close to support area, middle of the descending channel ✔️
if the price breaks the support area here, we will see more correction to the downside ❌🧨
Please, feel free to ask your question, write it in the comments below, and I will answer.🐋
DOT - Detailed Video Analysis!Hello everyone, if you like the idea, do not forget to support with a like and follow.
Here is the top-down analysis for DOT, feel free to request any pair/instrument or ask any questions in the comment section below.
Best of luck!

Polkadot: Continuation of the fallThe price formed a candlestick pattern of an inverted cross and returned to the descending channel.
I expect a further test of the support level.

POLKADOT, A PREDICTED SUPPORT AREA...!Dot is going forward to reaching the 12.88 again. The green area can play as a support role, but the 10.55 is more important.
--------------------------
*Full chart view:
The fifth bullish wave (v) is still available.
--------------------------
-Thanks-

DOT POLKADOT only having two choices - DOTBTC DOTUSDTDOT POLKADOT only having two choices - DOTBTC DOTUSDT

$GLMR ShortShort term I expect price to hit the 4h Legacy trendline at aprox 1.5$ where my buy orders start. I expect a nice bounce off this zone as price action has respected this trendline for a while now. Stack $GLMR for long term, If my 1.5$ buy goes through i'm gonna hold, however if it starts breaking and hard closing below the trendline there's possibility of sub 1$ price zone but that would need bitcoin to tank as well.
Moonbeam rn has significant sell pressure from profit takers from Take Flight event, so with bitcoin going below 37k I can see a lot more of them realizing
profits which would bring lower prices and sharper decline against bitcoin.

$DOT breakout to the up sidedot has alot of utility and has formed a bullish triangle that is likely to break to the upside target prices $40-$55

DOT Exchange Trading Idea 22-02-20Like all cryptos, DOT is falling again. Still within the 78.6-88.6% zone but for this week or longer it is going to be rough on cryptos and all financial markets.

Load your accounts for the big move$DOT is getting ready to get out of this accumulation area. I predict an upward momentum however it depends on the market conditions.


polkadot is for head and shoulder which is bearish pattern polkadot is for head and shoulder which is bearish pattern

Falling Wedge in Polkadot combined with a Bullish Divergence!Hey Traders,
As you can see on the 4HR of Polkadot (DOT.) The price action has formed Lower Lows and Lower Highs symptoms of a falling wedge! The price target out of this pattern would be at $23 (+22%). In the rare case it does break down, the target for that is $14 (-18%). There is a 70% chance Falling Wedges breakout to the upside and a 30% chance they fall to the downside. However, I think there is a VERY good chance we breakout mainly due to the Momentum Oscillator (RSI) showing a Bullish Divergence with Higher Lows while the Price is in a Decline.
Safe trading,
-Pulkanator


Long DOT - Discounts on PolkadotDOT - without any doubt we are very BULLISH on Polkadot. We believe it's a great discount and a perfect time to start investing.
Please go and DYOR on the project, if you don't know that much about it yet.
The coin is highly susceptible to Bitcoin Dominance and has not yet corrected in the same manner, this is however temporary.
There is a very strong support level of $17.37, which is very well held, it is also sitting on our trendline. We are not chasing a couple of cents here and there on the price. We are buying and holding. As you see there is a small SL under the support and trendline. That is in case Bitcoin starts falling and Dot follows, we will then be adding even better long positions, at a more favourable price.
We believe that DOT at $18.5 is an amazing discounted gift. Like someone offering you a brand new Mercedes-Benz G-Class for 20k today. You find the money and you purchase it :)
Targets: $30.9 | 35.4$ | 40.3$ | $47 | $51 | MOON?

Polkadot before the reboundThe price turned out to be in the fan.
The price decline has slowed down, we are near the liquidity zone.
I expect further growth to the level of $19.1.

POLKADOT - Close To Breakout! 👀Following on from our last post on DOT where we found a divergence breakout starting the bullish wave, we now have another entry for DOT to take it higher.
There are 2 ways we can trade this.
1st Trade Idea:
- Watch for bounce off double bottom and enter
- Stops below the double bottom
2nd Trade Idea:
- Watch for a breakout of the red descending trendline
- Stops below the structure indicated on the chart
Targets:
23.3, 32.3, actively manage the rest.
We'll update this chart once there's a breakout.
Goodluck!

DOT is bearish$DOT bounced off the broken ascending trendline after the retest and the resistance level. Bearish movement to support level at 18,86 $ is likely to happen.

Polkadot will continue the correctionThe price continues to move within the descending channel.
Volatility decreased when trying to break through the resistance level.
I expect a fall to the resistance level.


Reduced volatilityThe price is moving between the liquidity zone and the trend line.
Stochastic RSI 4H shows overbought.
A bearish divergence is forming at the 30m timeframe.
I expect a decline to the 0.5 Fibonacci level.

DOT - CORRECTION TILL FED'S DECISION ABOUT RATES HIKE IN MARCH?Looking for one move down for alts till FED's decison about raising rates in mid march. If we are still in bull market correction from december can be just to wait for regulators, so we can pump afterwards. In 2017 we had rates hikes three times in mid march, june and december. Everytime we corrected after decision bt finally the last one meant "game over".

Polkadot will riseThe price formed an ascending wedge and broke the resistance level.
The stochastic RSI is locally oversold.
I expect a retest of the lower boundary of the wedge and then a rise to the target indicated on the chart.
